

Metabolic subtypes of patients with NAFLD exhibit distinctive cardiovascular risk profiles
- PMID: 35220605
- PMCID: PMC9790568
- DOI: 10.1002/hep.32427
Metabolic subtypes of patients with NAFLD exhibit distinctive cardiovascular risk profiles
Abstract
Background and aims: We previously identified subsets of patients with NAFLD with different metabolic phenotypes. Here we align metabolomic signatures with cardiovascular disease (CVD) and genetic risk factors.
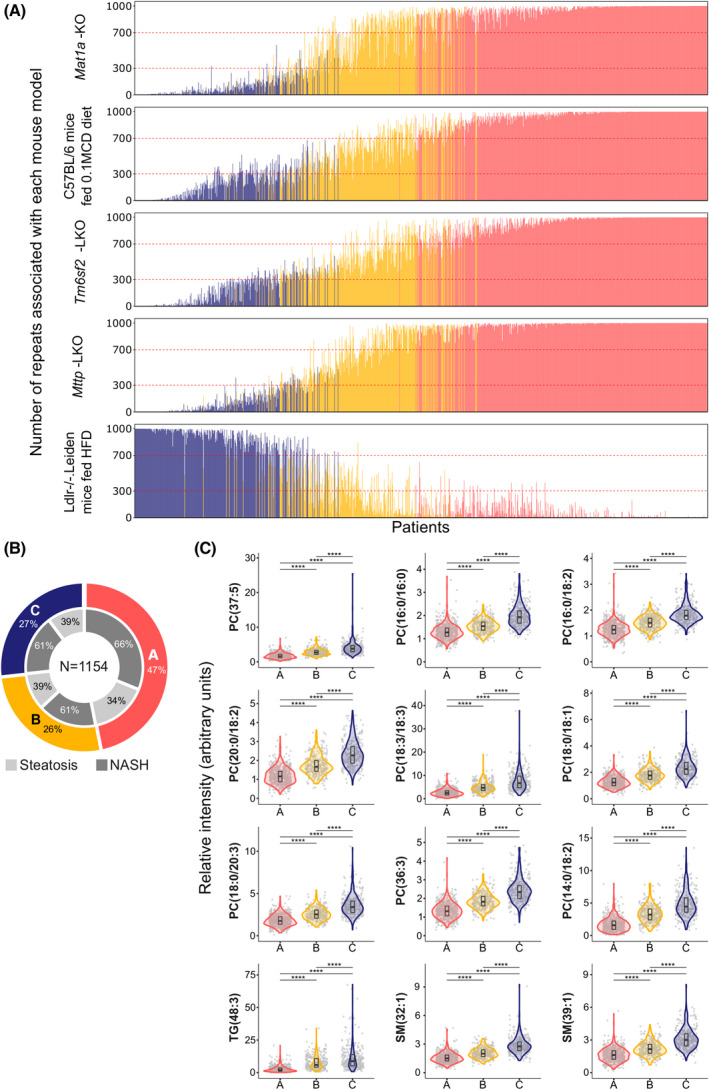
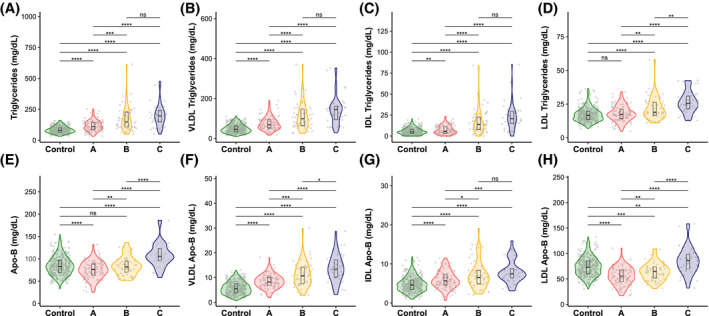
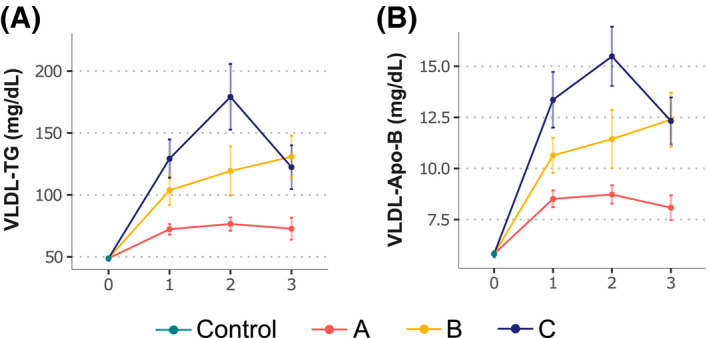
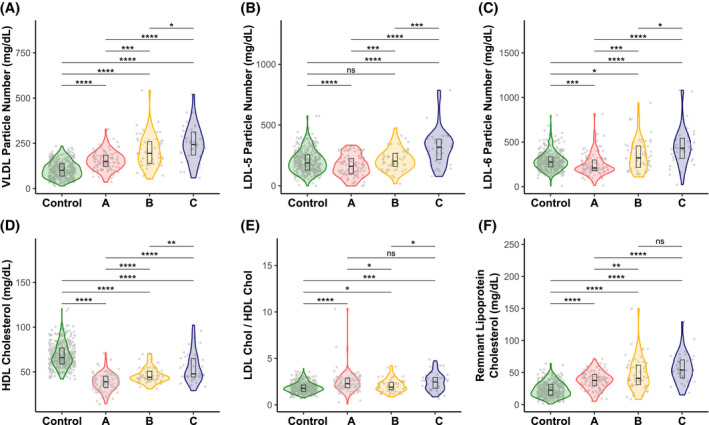
Approach and results: We analyzed serum metabolome from 1154 individuals with biopsy-proven NAFLD, and from four mouse models of NAFLD with impaired VLDL-triglyceride (TG) secretion, and one with normal VLDL-TG secretion. We identified three metabolic subtypes: A (47%), B (27%), and C (26%). Subtype A phenocopied the metabolome of mice with impaired VLDL-TG secretion; subtype C phenocopied the metabolome of mice with normal VLDL-TG; and subtype B showed an intermediate signature. The percent of patients with NASH and fibrosis was comparable among subtypes, although subtypes B and C exhibited higher liver enzymes. Serum VLDL-TG levels and secretion rate were lower among subtype A compared with subtypes B and C. Subtype A VLDL-TG and VLDL-apolipoprotein B concentrations were independent of steatosis, whereas subtypes B and C showed an association with these parameters. Serum TG, cholesterol, VLDL, small dense LDL5,6 , and remnant lipoprotein cholesterol were lower among subtype A compared with subtypes B and C. The 10-year high risk of CVD, measured with the Framingham risk score, and the frequency of patatin-like phospholipase domain-containing protein 3 NAFLD risk allele were lower in subtype A.
Conclusions: Metabolomic signatures identify three NAFLD subgroups, independent of histological disease severity. These signatures align with known CVD and genetic risk factors, with subtype A exhibiting a lower CVD risk profile. This may account for the variation in hepatic versus cardiovascular outcomes, offering clinically relevant risk stratification.
© 2022 The Authors. Hepatology published by Wiley Periodicals LLC on behalf of American Association for the Study of Liver Diseases.
Conflict of interest statement
Dr. Alonso is employed by OWL Metabolomics. Dr. Anstee is the coordinator of the EU IMI‐2 LITMUS consortium. He received grants from, consults for, and is on the speaker’s bureau for Allergan. He received grants from and consults for AstraZeneca, Boehringer Ingelheim, Intercept, Novartis, and Pfizer. He consults for and is on the speakers’ bureau for BMS, Genfit SA, and Gilead. He consults for 89 Bio, Abbvie, Akero, Altimentiv, Alitimmune, Axcella, Blade, BNN Cardio, Cirius, CymaBay, EcoR1, E3Bio, Eli Lilly & Company Ltd, Galmed, Genentech, Grunthal, HistoIndex, Indalo, Inventiva, IQVIA, Janssen, Johnson & Johnson, Madrigal, MedImmune, Medpace, Merck, Metacrine, NGMBio, North Sea Therapeutics, Novo Nordisk, PathAI, Poxel, ProSciento, Raptor Pharma, Roche, Servier, Shionogi, Terns, The Medicines Company, and Viking Therapeutics. He is on the speakers’ bureau for Abbott Laboratories, Clinical Care Options, Falk, Fishawack, Integritas Communications, Kenes, and Medscape. He received grants from GlaxoSmithKline and Glympse Bio. He receives royalties from Elsevier. Dr. Arretxe is employed by OWL Metabolomics. Dr. Banales advises OWL Metabolomics. Dr. Bugianesi consults for and received grants from Gilead. She consults for NovoNordisk, Lilly, and Merck. Dr. Crespo is on the speakers’ bureau for Intercept and Shionogui. He received grants from Gilead and AbbVie. Dr. Cusi consults for Arrowhead, AstraZeneca, 89 Bio, Lilly, Madrigal, and Quest. He advises Sagimet, Sonic Incytes, and Terns. He received grants from Echosens, Inventiva, Novo, Poxel, and Labcorp. Dr. Iruarrizaga‐Lejarreta is employed by OWL Metabolomics. Dr. Hayardeny owns stock in and is employed by Galmed. Dr. Mato consults and advises Abbott. He owns stock in, consults for, and advises OWL Metabolomics. He consults for Galmed. Dr. mayo is employed by OWL Metabolomics. Mr. Martinez‐Arranz is employed by OWL Metabolomics. Mrs. Mincholé is employed by OWL Metabolomics. Dr. Noureddin owns stock in and received grants from Viking. He advises and received grants from Gilead, Madrigal, and Pfizer. He consults for Perspectum. He advises 89 Bio, Altimmune, CohBar, Cytodyn, Intercept, Novo Nordisk, Blade, EchoSens, Fractyl, NorthSea, Terns, Siemens, and Roche. He received grants from Allergan, BMS, Galmed, Galectin, Genfit, Conatus, Enanta, Novartis, Shire, and Zydus. He owns stock in Anaetos and Rivus Pharma.
Figures
Similar articles
-
Dysfunction of estrogen-related receptor alpha-dependent hepatic VLDL secretion contributes to sex disparity in NAFLD/NASH development.Theranostics. 2020 Aug 29;10(24):10874-10891. doi: 10.7150/thno.47037. eCollection 2020. Theranostics. 2020. PMID: 33042259 Free PMC article.
-
Apolipoprotein F is reduced in humans with steatosis and controls plasma triglyceride-rich lipoprotein metabolism.Hepatology. 2023 Apr 1;77(4):1287-1302. doi: 10.1002/hep.32631. Epub 2022 Jul 15. Hepatology. 2023. PMID: 35735979 Free PMC article.
-
Gut inflammation exacerbates high-fat diet induced steatosis by suppressing VLDL-TG secretion through HNF4α pathway.Free Radic Biol Med. 2021 Aug 20;172:459-469. doi: 10.1016/j.freeradbiomed.2021.06.027. Epub 2021 Jun 26. Free Radic Biol Med. 2021. PMID: 34186207
-
Omega-3 fatty acids eicosapentaenoic acid and docosahexaenoic acid and their mechanisms of action on apolipoprotein B-containing lipoproteins in humans: a review.Lipids Health Dis. 2017 Aug 10;16(1):149. doi: 10.1186/s12944-017-0541-3. Lipids Health Dis. 2017. PMID: 28797250 Free PMC article. Review.
-
Pathophysiology of Diabetic Dyslipidemia.J Atheroscler Thromb. 2018 Sep 1;25(9):771-782. doi: 10.5551/jat.RV17023. Epub 2018 Jul 12. J Atheroscler Thromb. 2018. PMID: 29998913 Free PMC article. Review.
Cited by
-
Semaglutide Has Beneficial Effects on Non-Alcoholic Steatohepatitis in Ldlr-/-.Leiden Mice.Int J Mol Sci. 2023 May 9;24(10):8494. doi: 10.3390/ijms24108494. Int J Mol Sci. 2023. PMID: 37239841 Free PMC article.
-
The Ameliorating Effects of n-3 Polyunsaturated Fatty Acids on Liver Steatosis Induced by a High-Fat Methionine Choline-Deficient Diet in Mice.Int J Mol Sci. 2023 Dec 7;24(24):17226. doi: 10.3390/ijms242417226. Int J Mol Sci. 2023. PMID: 38139055 Free PMC article.
-
Translational characterization of the temporal dynamics of metabolic dysfunctions in liver, adipose tissue and the gut during diet-induced NASH development in Ldlr-/-.Leiden mice.Heliyon. 2023 Feb 24;9(3):e13985. doi: 10.1016/j.heliyon.2023.e13985. eCollection 2023 Mar. Heliyon. 2023. PMID: 36915476 Free PMC article.
-
The Preventive Effect of Exercise and Oral Branched-Chain Amino Acid Supplementation on Obesity-Induced Brain Changes in Ldlr-/-.Leiden Mice.Nutrients. 2023 Mar 31;15(7):1716. doi: 10.3390/nu15071716. Nutrients. 2023. PMID: 37049556 Free PMC article.
-
Something to mTORC About in NASH.Cell Mol Gastroenterol Hepatol. 2022;13(6):1843-1844. doi: 10.1016/j.jcmgh.2022.03.001. Epub 2022 Apr 2. Cell Mol Gastroenterol Hepatol. 2022. PMID: 35378066 Free PMC article. No abstract available.
References
-
- Cotter TG, Rinella M. Nonalcoholic fatty liver disease 2020: the state of the disease. Gastroenterology. 2020;158:1851–64. - PubMed
-
- Stefan N, Häring HU, Cusi K. Non‐alcoholic fatty liver disease: causes, diagnosis, cardiometabolic consequences, and treatment strategies. Lancet Diabetes Endocrinol. 2019;7:313–24. - PubMed
-
- Francque SM, van der Graaff D, Kwanten WJ. Non‐alcoholic fatty liver disease and cardiovascular risk: pathophysiological mechanisms and implications. J Hepatol. 2016;65:425–43. - PubMed
-
- Anstee QM, Darlay R, Cockell S, Meroni M, Govaere O, Tiniakos D, et al. Genome‐wide association study of non‐alcoholic fatty liver and steatohepatitis in a histologically characterised cohort. J Hepatol. 2020;73:505–15. - PubMed
