. 2022 Feb;12(2):e746.
doi: 10.1002/ctm2.746.

Melatonin enhances osteoblastogenesis of senescent bone marrow stromal cells through NSD2-mediated chromatin remodelling

Affiliations

Melatonin enhances osteoblastogenesis of senescent bone marrow stromal cells through NSD2-mediated chromatin remodelling

Ying Xie et al. Clin Transl Med. 2022 Feb.

Abstract

Background: Aging-associated osteoporosis is frequently seen in the elderly in clinic, but efficient managements are limited because of unclear nosogenesis. The current study aims to investigate the role of melatonin on senescent bone marrow stromal cells (BMSCs) and the underlying regulating mechanism.

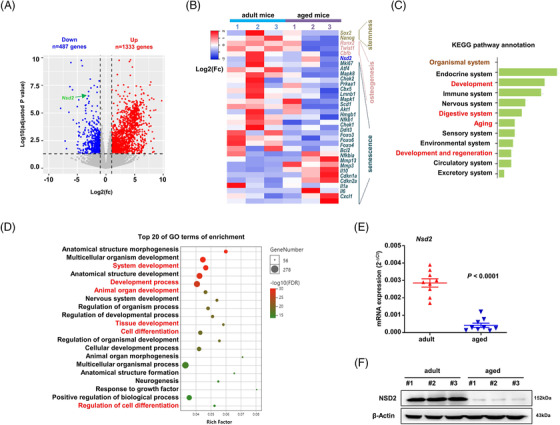
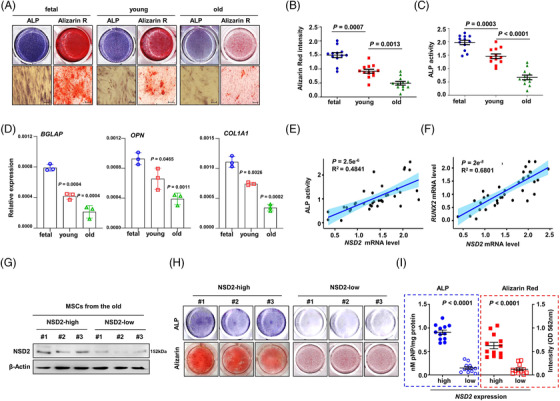
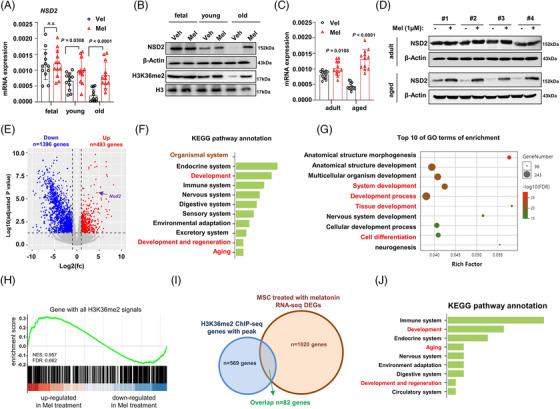
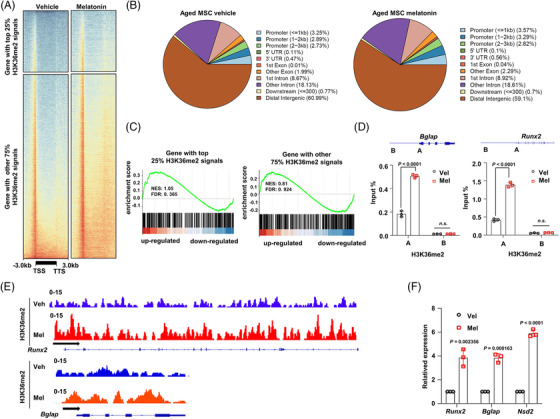
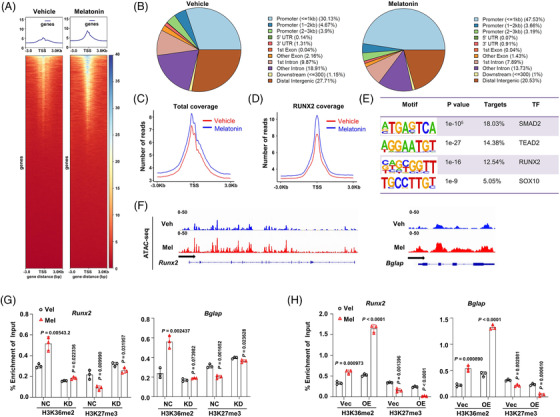
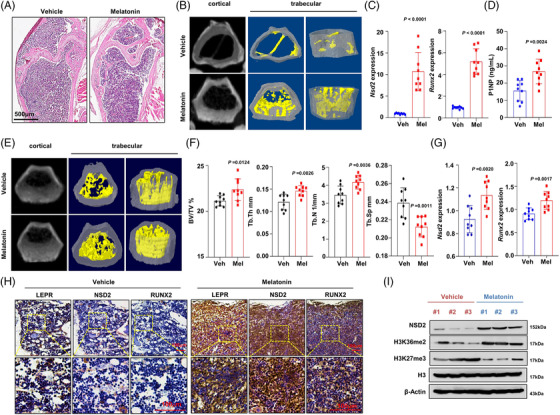
Methods: Melatonin levels were tested by ELISA. Gene expression profiles were performed by RNA-sequencing, enrichment of H3K36me2 on gene promoters was analyzed by Chromatin Immunoprecipitation Sequencing (ChIP-seq), and chromatin accessibility was determined by Assay for Transposase-Accessible Chromatin with high-throughput sequencing (ATAC-seq). Osteogenesis of BMSCs in vitro was measured by Alizarin Red and Alkaline Phosphatase staining, and in vivo effects of melatonin was assessed by histological staining and micro computed tomography (micro-CT) scan. Correlation of NSD2 expression and severity of senile osteoporosis patients were analyzed by Pearson correlation.

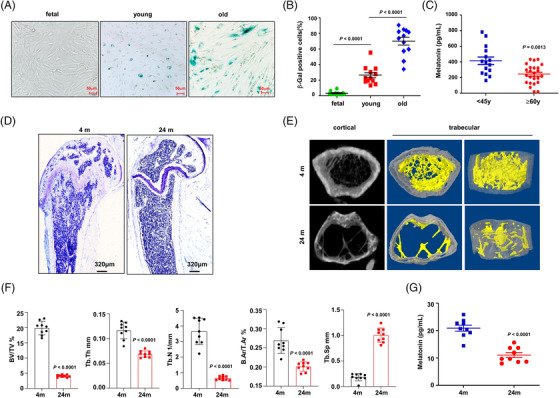
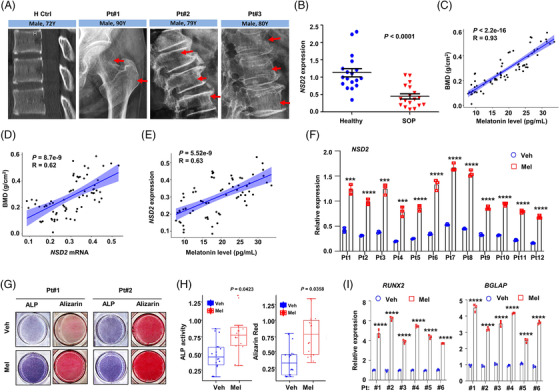
Results: Melatonin levels were decreased during aging in human bone marrow, accompanied by downregulation of the histone methyltransferase nuclear receptor binding SET domain protein 2 (NSD2) expression in the senescent BMSCs. Melatonin stimulated the expression of NSD2 through MT1/2-mediated signaling pathways, resulting in the rebalancing of H3K36me2 and H3K27me3 modifications to increase chromatin accessibility of the osteogenic genes, runt-related transcription factor 2 (RUNX2) and bone gamma-carboxyglutamate protein (BGLAP). Melatonin promoted osteogenesis of BMSCs in vitro, and alleviates osteoporosis progression in the aging mice. In clinic, severity of senile osteoporosis (SOP) was negatively correlated with melatonin level in bone marrow, as well as NSD2 expression in BMSCs. Similarly, melatonin remarkably enhanced osteogenic differentiation of BMSCs derived from SOP patients in vitro.

Conclusions: Collectively, our study dissects previously unreported mechanistic insights into the epigenetic regulating machinery of melatonin in meliorating osteogenic differentiation of senescent BMSC, and provides evidence for application of melatonin in preventing aging-associated bone loss.

Keywords: NSD2; bone marrow stromal cells; melatonin; osteoporosis; senescence.


Conflict of interest statement

The authors declare no competing financial interests.

Figures

FIGURE 1
FIGURE 1
Melatonin level declines with aging in human bone marrow and mouse plasma. (A) Representative images of lysosomal β‐galactosidase staining in bone marrow stromal cells (BMSCs) from donors with different ages. Scale bar, 50 μm. (B) Quantification of the percentage of β‐galactosidase positive BMSCs in three groups (n = 12). Nine random vision fields with 200 × magnification were analysed. (C) Melatonin levels in the bone marrow plasma of donors under 45 years old (n = 15) or over 60 years old (n = 24) measured by ELISA. (D) Toluidine Blue O staining of the trabecular bone near the distal femoral metaphyseal region from adult (4 months) and aged mice (24 months). (E) Representative three‐dimensional trabecular architecture examined by a micro‐CT scan of the trabecular bone near the distal femoral metaphyseal region from adult and aged mice. Region of interest (ROI), 1 mm length starting from .5 mm proximal to the growth plate consisting of 140 slices. (F) Quantifications of the trabecular bone volume/tissue volume (BV/TV), trabecular thickness (Tb.Th), trabecular number (Tb.N), trabecular separation (Tb.Sp) and mean cortical area fraction (B.Ar/T.Ar) (n = 9 mice per group). (G) Melatonin level in the peripheral blood of adult and aged mice. n = 9 mice per group. Data are mean ± s.e.m. p values are determined by unpaired two‐sided t‐tests with Welch's correction
FIGURE 2
FIGURE 2
Gene expression profiling identifies NSD2 as marker of senescent bone marrow stromal cells (BMSCs). (A) Volcano plot showing differently expressed genes in BMSCs from aged mice compared to the young adult as control. Dashed lines show differential expression cutoffs (log 2 [fc] at 1% FDR). (B) Heat map of differently expressed key genes of stemness, senescence and osteogenesis in BMSCs from aged and adult mice. (C) Kyoto Encyclopedia of Genes and Genomes (KEGG) pathway annotation of differential expressed genes (DEGs) involved in organismal system. (D) Gene Ontology (GO) analysis of top 20 enriched terms of the DEGs. (E) qPCR analysis of Nsd2 expression in BMSCs derived from adult and aged mice (n = 9 mice per group). (F) Western blotting assay of the NSD2 level in BMSCs isolated from adult and aged mice. Data are mean ± s.e.m. p values are determined by unpaired two‐sided t‐tests with Welch's correction
FIGURE 3
FIGURE 3
Osteogenic potential of senescent bone marrow stromal cells (BMSCs) correlates with NSD2 expression. (A) Representative images of alkaline phosphatase assay (ALP) staining and Alizarin Red S assay for BMSCs from fetal, young or old donors cultured with osteogenic media for 14 days and quantification of Alizarin Red staining (B) and ALP staining (C) (n = 12 samples per group). Scale bar, 100 μm. (D) qPCR assay for expressions of osteogenic genes BGLAP, OPN, COL1A1 in different aged BMSCs after induced for 14 days. (E) Correlation of ALP activity and NSD2 expression in BMSCs of different groups (n = 36). (F) Correlation of RUNX2 and NSD2 expression in BMSCs of different groups (n = 36). (G) Representative Western blotting analysis of NSD2 protein level in the senescent BMSCs. (H) Representative images of ALP staining and Alizarin Red S assay in the senescent BMSCs with different NSD2 levels. (I) Quantification of ALP staining and Alizarin Red S assay in human senescent BMSCs with different NSD2 levels (n = 12 samples per group). Data are mean ± s.e.m. p values are determined by unpaired two‐sided t‐tests with Welch's correction
FIGURE 4
FIGURE 4
Melatonin stimulates NSD2 expression in senescent bone marrow stromal cells (BMSCs). (A) qPCR analysis of NSD2 expression in human BMSCs from donors of different ages treated with 1 μM melatonin for 24 h (n = 12 samples per group). n.s., no significance. (B) Western blotting analysis of NSD2 and H3K36me2 levels in human BMSCs from donors of different ages and treated with 1 μM melatonin for 24 h. (C) qPCR analysis of Nsd2 expression in mouse BMSCs from adult and aged groups and treated with 1 μM melatonin for 24 h (n = 12 samples per group). (D) NSD2 level in mouse BMSCs from adult and aged groups and treated with 1 μM melatonin for 24 h. (E) Volcano plot of differentially expressed genes analysed from bulk RNA‐sequencing in the senescent mouse BMSCs treated with vehicle or 1 μM melatonin for 24 h. Blue, down‐regulated genes; red, up‐regulated genes; light gray, statistically non‐significance genes (n = 3 mice per group). (F) Kyoto Encyclopedia of Genes and Genomes (KEGG) pathway annotation of differential expressed genes (DEGs) involved in organismal system. (G) Gene Ontology (GO) analysis of top 10 enriched terms of the DEGs. (H) The gene set enrichment analysis (GSEA) showing up‐ and down‐regulated genes enriched by H3K36me2 antibody in mouse senscent BMSCs treated with 1 μM melatonin for 24 h by chromatin‐immunoprecipitation (ChIP)‐sequation (n = 3 biological experiemtns). (I) Venn diagram showing the number of overlaps between genes bound by H3K36me2 ChIP‐seq assay and DEGs upon melatonin treatment by RNA‐seq assay. (J) Kyoto Encyclopedia of Genes and Genomes (KEGG) pathway annotation of overlapped genes bound by H3K36me2 ChIP‐seq assay and DEGs upon melatonin treatment by RNA‐seq assay. Data are mean ± s.e.m. p values are determined by paired two‐sided t‐tests with Welch's correction
FIGURE 5
FIGURE 5
Melatonin promotes H3K36me2 enrichment on osteogenic gene promoters. (A) Genome‐wide distribution of H3K36me2 binding regions in the senescent mouse bone marrow stromal cells (BMSCs) treated with vehicle or melatonin for 24 h (n = 3 biological experiments). (B) Pie charts of the distribution of H3K36me2 peaks relative to gene features in the senescent BMSCs treated with vehicle control or melatonin for 24 h. (C) The GSEA enrichment of genes with top 25% H3K36me2 signals and other 75% signals. (D) Chromatin‐immunoprecipitation (ChIP)‐qPCR of H3K36me2 at Runx2 and Bglap gene loci in the senescent mouse BMSCs treated with vehicle or melatonin (n = 3 biological experiments). Schematic representation of PCR primer design is provided. (E) Gene tracks of representative ChIP‐seq profiles for the H3K36m2 mark at the Runx2 and Bglap gene loci. (F) qPCR expression analyses of Runx2, Bglap and Nsd2 mRNA expression levels in mouse senescent BMSCs in osteogenic induction medium for 7 days treated with vehicle or melatonin (n = 3 biological experiments). Data are mean ± s.e.m. p values are determined by paired two‐sided t‐tests with Welch's correction
FIGURE 6
FIGURE 6
Melatonin favours chromatin accessibility of osteogenic genes. (A) Heat maps of signal distribution around the transcription start site (TSS) ± 3Kb of genes in mouse senescent bone marrow stromal cells (BMSCs) treated with vehicle control or melatonin for 24 h (n = 3 biological experiments). (B) Pie charts of the distribution of assay for transposase‐accessible chromatin with high‐throughput sequencing (ATAC‐seq) consensus peaks relative to gene features in mouse senescent BMSCs treated with vehicle control or melatonin for 24 h. (C) Total average coverage of enrichment around the TSS regions in the vehicle control (red line)‐ and melatonin (blue line)‐treated mBMSCs. (D) Average coverage of RUNX2 enrichment around the TSS regions in the veihicle control (red line)‐ and melatonin (blue line)‐treated mBMSCs. (E) Sequences of the most significantly enriched motifs detected in the differentially accessible regions. (F) ATAC‐seq tracks for the identification of accessible chromatin regions of Runx2 and Bglap genes in mouse senescent BMSCs treated with vehicle control or melatonin. Chromatin‐immunoprecipitation (ChIP)‐qPCR assay for changes of H3K36me2 and H3K27me3 enrichment on the Runx2 and Bglap gene promoters in mouse senscent BMSCs, (G) with (nontarget control, NC) or NSD2 kowckdown (KD), (H) with (vector control, Vec) or NSD2 overexpression (OE) (n = 3 indepednent experiments). Data are mean ± s.e.m. p values are determined by paired two‐sided t‐tests with Welch's correction
FIGURE 7
FIGURE 7
Melatonin facilitates osteogenesis of bone marrow stromal cells (BMSCs) from aging mice via NSD2. (A) Representative hematoxylin and eosin staining of trabecular bone structures of the femur metaphysis from the aged mice treated with vehicle control or melatonin. (B) MicroCT analysis of the femur metaphysis from the aged mice treated with vehicle control or melatonin. Region of interest (ROI), 1 mm length starting from .5 mm proximal to the growth plate consisting of 140 slices. (C) qPCR assay of Nsd2 and Runx2 expression in BMSCs and (D) enzyme immunoassay (EIA) assay of P1NP level in serum from the aged mice treated with vehicle control or melatonin. (E) MicroCT analysis of the femur metaphysis from the adult mice treated with vehicle control or melatonin (ROI: a 1 mm length starting from .5 mm proximal to the growth plate). (F) Quantification of microCT analysis of bone volume ratio to tissue volume (BV/TV), trabecular thickness (Tb.Th), and trabecular number (Tb.N) and trabecular separation (Tb.Sp) in adult mice treated with vehicle control or melatonin (n = 9). (G) qPCR assay of Nsd2 and Runx2 expression in BMSCs from the adult mice treated with vehicle control or melatonin. Data are mean ± s.e.m. p values are determined by unpaired two‐sided t‐tests with Welch's correction. (H) Immunohistochemistry assay for the expression of leptin receptor (LPER) as the marker of BMSCs, NSD2 and RUNX2 in the sequential slide of femur tissue from the aged mice treated with vehicle control or melatonin. Scale bar, 100 μm. (I) Western blotting assay of the NSD2, H3K36me2 and H3K27me3 level in BMSCs from the aged mice treated with vehicle control or melatonin. Data are mean ± s.e.m. p values are determined by paired two‐sided t‐tests with Welch's correction
FIGURE 8
FIGURE 8
Melatonin recovers osteogenic potential of bone marrow stromal cells (BMSCs) from patients with senile osteoporosis. (A) Radiographic images of healthy control (H Ctrl) and patients with senile osteoporosis (Pt). Red arrows indicate the typical area with osteoporosis. (B) NSD2 expression in BMSCs isolated from healthy control and patients with senile osteoporosis (n = 18 with each detection triplicated). (C) Correlation of bone mass density (BMD) with melatonin level in bone marrow plasma. (D) NSD2 expression in BMSCs from senile osteoporosis patients (three independent reads for n = 12 patients). (E) Correlation of NSD2 expression in BMSCs and melatonin level in bone marrow plasma of patients with senile osteoporosis (three independent reads for n = 12 patients). (F) NSD2 expression in 12 BMSCs from patients with senile osteoporosis treated with 1 μM melatonin for 24 h (n = 3 with each detection triplicated). (G) Representative images of alkaline phosphatase (ALP) and Alizarin Red S staining in BMSCs from donors with senile osteoporosis treated with osteogenic media for 14 days in the presence of vehicle or melatonin. (H) Quantification of ALP and Alizarin Red S staining for BMSCs under osteogenesis induction and in the presence of Dimethyl Sulfoxide (DMSO) vehicle or melatonin (three independent reads for n = 6 BMSCs). (I) mRNA levels of RUNX2 and BGLAP in BMSCs under osteogenesis induction and in the presence of vehicle or melatonin (n = 3 with each detection triplicated). Data are mean ± s.e.m. p values are determined by two‐sided t‐tests with Welch's correction. ***p < .001; ****p < .0001

Similar articles

Cited by

References

    1. Armas LA, Recker RR. Pathophysiology of osteoporosis: new mechanistic insights. Endocrinol Metab Clin North Am. 2012;41:475‐486. 10.1016/j.ecl.2012.04.006 - DOI - PubMed
    1. Pevet P. Melatonin and biological rhythms. Therapie. 1998;53:411‐420. - PubMed
    1. St Hilaire MA, Rahman SA, Gooley JJ, Witt‐Enderby PA, Lockley SW. Relationship between melatonin and bone resorption rhythms in premenopausal women. J Bone Miner Metab. 2019;37:60‐71. 10.1007/s00774-017-0896-6 - DOI - PubMed
    1. Liu J, Huang F, He HW. Melatonin effects on hard tissues: bone and tooth. Int J Mol Sci. 2013;14:10063‐10074. 10.3390/ijms140510063 - DOI - PMC - PubMed
    1. Radio NM, Doctor JS, Witt‐Enderby PA. Melatonin enhances alkaline phosphatase activity in differentiating human adult mesenchymal stem cells grown in osteogenic medium via MT2 melatonin receptors and the MEK/ERK (1/2) signaling cascade. J Pineal Res. 2006;40:332‐342. 10.1111/j.1600-079X.2006.00318.x - DOI - PubMed

Publication types

MeSH terms

LinkOut - more resources