

Gnas Loss Causes Chondrocyte Fate Conversion in Cranial Suture Formation
- PMID: 35220829
- PMCID: PMC9266356
- DOI: 10.1177/00220345221075215
Gnas Loss Causes Chondrocyte Fate Conversion in Cranial Suture Formation
Abstract
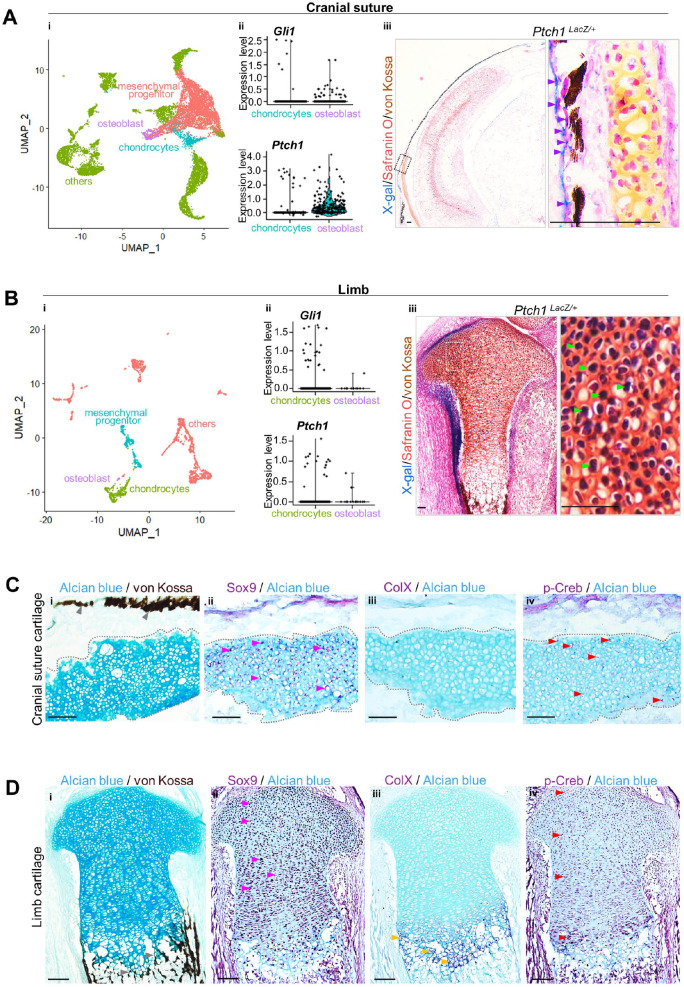
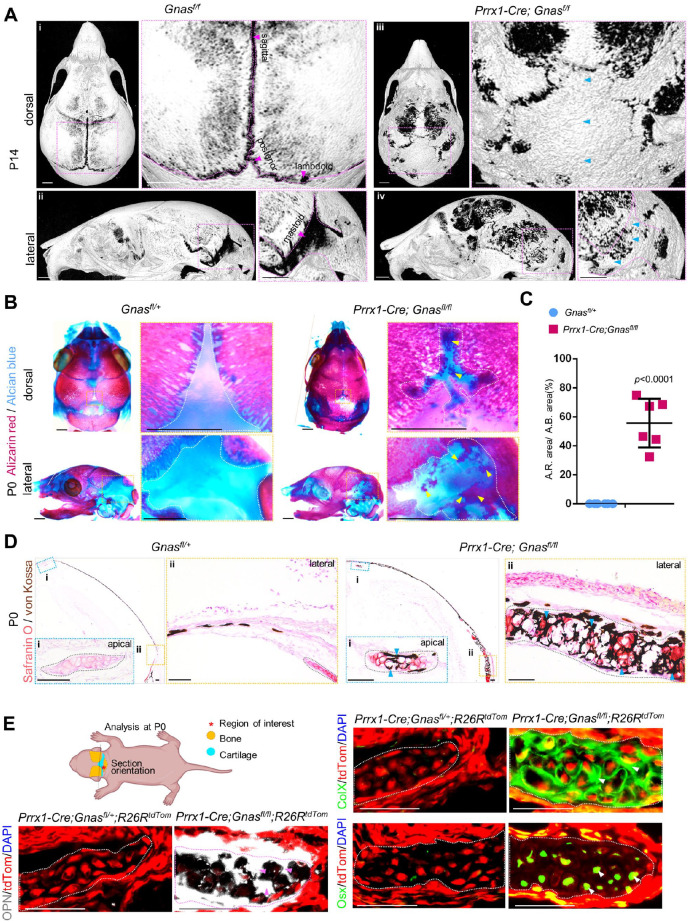
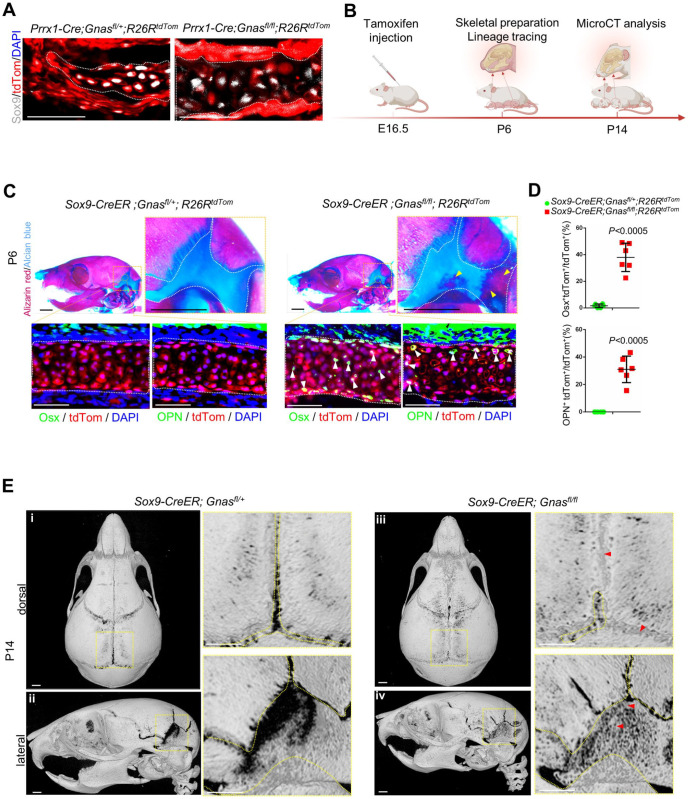
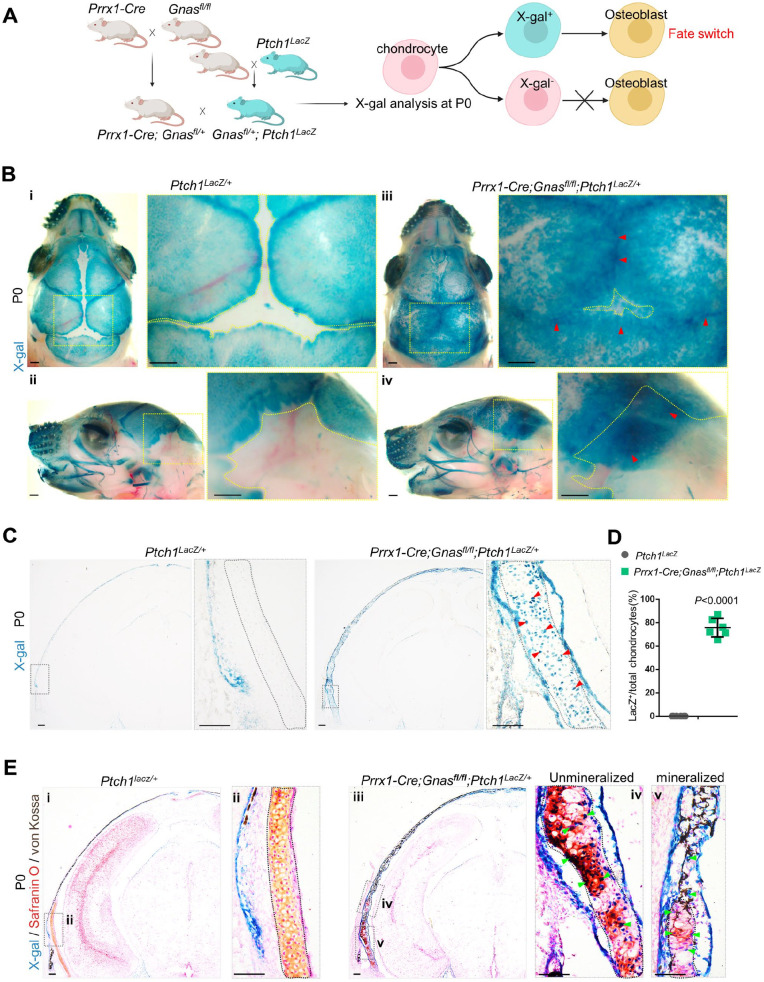
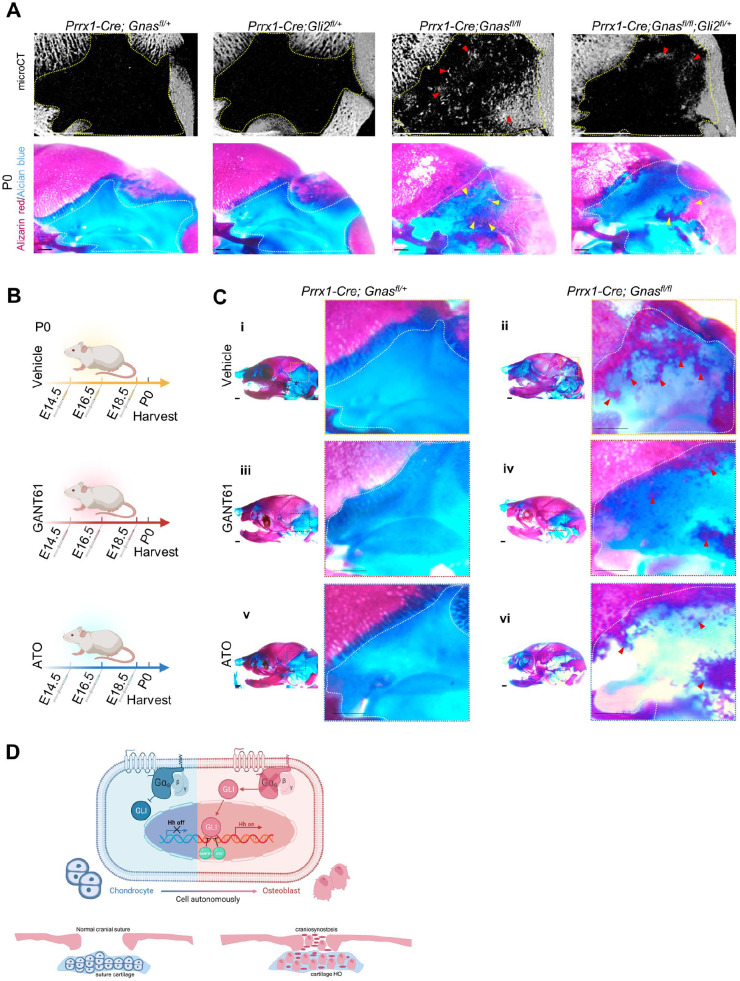
Calvaria development is distinct from limb formation. Craniosynostosis is a skull deformity characterized by premature cranial suture fusion due to the loss of the GNAS gene and, consequently, its encoded protein Gαs. This birth defect requires surgery, with potential lethal consequences. So far, hardly any early-stage nonsurgical interventions for GNAS loss-related craniosynostosis are available. Here, we investigated the role of the Gnas gene in mice in guarding the distinctiveness of intramembranous ossification and how loss of Gnas triggered endochondral-like ossification within the cranial sutures. Single-cell RNA sequencing (scRNA-seq) of normal neonatal mice cranial suture chondrocytes showed a Hedgehog (Hh) inactivation pattern, which was associated with Gαs signaling activation. Loss of Gnas evoked chondrocyte-to-osteoblast fate conversion and resulted in cartilage heterotopic ossification (HO) within cranial sutures and fontanels of the mouse model, leading to a skull deformity resembling craniosynostosis in patients with loss of GNAS. Activation of ectopic Hh signaling within cranial chondrocytes stimulated the conversion of cell identity through a hypertrophy-like stage, which shared features of endochondral ossification in vivo. Reduction of Gli transcription activity by crossing with a loss-of-function Gli2 allele or injecting GLI1/2 antagonist hindered the progression of cartilage HO in neonatal stage mice. Our study uncovered the role of Gαs in maintaining cranial chondrocyte identity during neonatal calvaria development in mice and how reduction of Hh signaling could be a nonsurgical intervention to reduce skull deformity in craniosynostosis due to loss of GNAS.
Keywords: cell differentiation; craniofacial anomalies; craniofacial biology/genetics; developmental biology; signal transduction; translational medicine.
Conflict of interest statement
Figures
Similar articles
-
Activation of Hedgehog signaling by loss of GNAS causes heterotopic ossification.Nat Med. 2013 Nov;19(11):1505-12. doi: 10.1038/nm.3314. Epub 2013 Sep 29. Nat Med. 2013. PMID: 24076664 Free PMC article.
-
Gαs signaling controls intramembranous ossification during cranial bone development by regulating both Hedgehog and Wnt/β-catenin signaling.Bone Res. 2018 Nov 20;6:33. doi: 10.1038/s41413-018-0034-7. eCollection 2018. Bone Res. 2018. PMID: 30479847 Free PMC article.
-
Increased FGF8 signaling promotes chondrogenic rather than osteogenic development in the embryonic skull.Dis Model Mech. 2018 Jun 15;11(6):dmm031526. doi: 10.1242/dmm.031526. Dis Model Mech. 2018. PMID: 29752281 Free PMC article.
-
Aberrant Bone Regulation in Albright Hereditary Osteodystrophy dueto Gnas Inactivation: Mechanisms and Translational Implications.Curr Osteoporos Rep. 2022 Feb;20(1):78-89. doi: 10.1007/s11914-022-00719-w. Epub 2022 Feb 28. Curr Osteoporos Rep. 2022. PMID: 35226254 Review.
-
Gαs signaling in skeletal development, homeostasis and diseases.Curr Top Dev Biol. 2019;133:281-307. doi: 10.1016/bs.ctdb.2018.11.019. Epub 2018 Dec 28. Curr Top Dev Biol. 2019. PMID: 30902256 Review.
Cited by
-
GNAS locus: bone related diseases and mouse models.Front Endocrinol (Lausanne). 2023 Oct 18;14:1255864. doi: 10.3389/fendo.2023.1255864. eCollection 2023. Front Endocrinol (Lausanne). 2023. PMID: 37920253 Free PMC article. Review.
-
Cathepsin K-Positive Cell Lineage Promotes In Situ Dentin Formation Controlled by Nociceptive Sonic Hedgehog.Adv Sci (Weinh). 2024 Dec;11(47):e2310048. doi: 10.1002/advs.202310048. Epub 2024 Oct 30. Adv Sci (Weinh). 2024. PMID: 39474995 Free PMC article.
-
Craniofacial developmental biology in the single-cell era.Development. 2023 Oct 1;150(19):dev202077. doi: 10.1242/dev.202077. Epub 2023 Oct 9. Development. 2023. PMID: 37812056 Free PMC article. Review.
-
Rapid induction and long-term self-renewal of neural crest-derived ectodermal chondrogenic cells from hPSCs.NPJ Regen Med. 2022 Dec 8;7(1):69. doi: 10.1038/s41536-022-00265-0. NPJ Regen Med. 2022. PMID: 36477591 Free PMC article.
-
The role of Hedgehog and Notch signaling pathway in cancer.Mol Biomed. 2022 Dec 15;3(1):44. doi: 10.1186/s43556-022-00099-8. Mol Biomed. 2022. PMID: 36517618 Free PMC article. Review.
References
-
- Bai CB, Auerbach W, Lee JS, Stephen D, Joyner AL. 2002. Gli2, but not Gli1, is required for initial Shh signaling and ectopic activation of the Shh pathway. Development. 129(20):4753–4761. - PubMed
-
- Cong Q, Xu R, Yang Y. 2019. Gαs signaling in skeletal development, homeostasis and diseases. Curr Top Dev Biol. 133:281–307. - PubMed
-
- Corrales JD, Blaess S, Mahoney EM, Joyner AL. 2006. The level of sonic hedgehog signaling regulates the complexity of cerebellar foliation. Development. 133(9):1811–1821. - PubMed
Publication types
MeSH terms
Substances
Grants and funding
LinkOut - more resources
Full Text Sources
