. 2022;19(1):333-352.
doi: 10.1080/15476286.2021.2020455. Epub 2021 Dec 31.

A novel role for nucleolin in splice site selection

Affiliations

A novel role for nucleolin in splice site selection

Kinneret Shefer et al. RNA Biol. 2022.

Abstract

Latent 5' splice sites, not normally used, are highly abundant in human introns, but are activated under stress and in cancer, generating thousands of nonsense mRNAs. A previously proposed mechanism to suppress latent splicing was shown to be independent of NMD, with a pivotal role for initiator-tRNA independent of protein translation. To further elucidate this mechanism, we searched for nuclear proteins directly bound to initiator-tRNA. Starting with UV-crosslinking, we identified nucleolin (NCL) interacting directly and specifically with initiator-tRNA in the nucleus, but not in the cytoplasm. Next, we show the association of ini-tRNA and NCL with pre-mRNA. We further show that recovery of suppression of latent splicing by initiator-tRNA complementation is NCL dependent. Finally, upon nucleolin knockdown we show activation of latent splicing in hundreds of coding transcripts having important cellular functions. We thus propose nucleolin, a component of the endogenous spliceosome, through its direct binding to initiator-tRNA and its effect on latent splicing, as the first protein of a nuclear quality control mechanism regulating splice site selection to protect cells from latent splicing that can generate defective mRNAs.

Keywords: 5ʹ splice site selection; RNA sequencing; alternative splicing; bioinformatics analysis; endogenous spliceosome; latent splice sites; latent splicing; mass spectrometry; splicing regulation; suppression of splicing.


Conflict of interest statement

No potential conflict of interest was reported by the author(s).

Figures

Figure 1.
Figure 1.
Specific crosslinking of proteins to ini-tRNA in the nucleus. (A) Scheme of the experiment. In vitro transcribed 32P-labelled ini-tRNA was injected into individual nuclei of Xenopus oocytes. Isolated nuclei and cytoplasm were crosslinked with UV light, and the crosslinked complexes were further digested with RNase. (B) SDS PAGE analysis of aliquots from experiments performed as described in A. Lane 1, UV crosslinked cytoplasm; lane 3, non-crosslinked nucleus; lanes 4–8, individual nuclei transfected with the indicated levels of ini-tRNA (cpm) and crosslinked by UV light at the indicated dose. (C) Specific association with ini-tRNA. The UV crosslinked bands are chased by 100X cold ini-tRNA, but not by 100X cold elongator-tRNA. Lower panel, quantification of the experiment (4 biological repeats for panels 1–3, and 3 biological repeats for panel 4) (D) Affinity purification of proteins bound to ini-tRNA. In vitro transcribed biotinylated 32P-labelled ini-tRNA was injected into individual nuclei of Xenopus oocytes [as described in (A)], UV crosslinked, and affinity purified on streptavidin magnetic beads and run on SDS PAGE. Control, non-biotinylated 32P-labelled ini-tRNA.
Figure 2.
Figure 2.
NCL is directly bound to ini-tRNA in the nucleus. (A, B) Proteins bound to ini-tRNA in nuclear extracts. Increasing quantities of in vitro transcribed biotinylated 32P-labelled ini-tRNA were incubated with nuclear (lanes 1–3) and cytoplasmic (lanes 4–6) extracts, UV crosslinked and affinity purified on streptavidin magnetic beads and run on SDS PAGE before (A) or after (B) RNase treatment. (C) Significant peptides associated with ini-tRNA in the nucleus based on mass spectrometry analysis; aBio/noBio indicates the fold change in biotin versus no biotin, average of three biological experiments; bnumber of peptides (see also Table S1). (D) Scheme of the experiment described in E, F confirming NCL binding to ini-tRNA. (E) In vitro transcribed biotinylated 32P-labelled ini-tRNA was incubated with nuclear extract of Xenopus oocytes, UV crosslinked, and subjected to affinity purification on streptavidin magnetic beads, and run on SDS PAGE after RNase digestion (lane 1), and control non-biotinylated 32P-labelled ini-tRNA that went through the same procedure (lane 2). (F) Analogous experiment, followed by WB with anti-NCL antibodies. Left, GVs; middle, control non-biotinylated ini-tRNA; right, biotinylated ini-tRNA.
Figure 3.
Figure 3.
Ini-tRNA/NCL are bound to pre-mRNAin vivo. (A, B) ini-tRNA/NCL are bound to pre-mRNA in the general population of purified supraspliceosomes. (A) WB analysis of purified supraspliceosomes. Supraspliceosomes were refractionated on a second glycerol gradient, and aliquots from even fractions were analysed by WB. We use splicing factor hnRNP G to locate 200S supraspliceosomes. Purified supraspliceosomes peak in fractions 8–10. (B) RT-PCR analysis of supraspliceosome peak fractions. Both primers pairs of SMN1 amplify SMN1 pre-mRNA. (C-F) Affinity purification shows that ini-tRNA/NCL are bound to SMN1 pre-mRNAin vivo. (C) Affinity purification scheme. Nuclear supernatants prepared from a HeLa cell line stably expressing the SMN1-PP75ʹUTR transcript, harbouring the PP7 tag at the 5ʹUTR, were incubated with PP7 coat protein bound to protein A via a TEV protease sensitive peptide (ZTP). SMN1 bound components were affinity purified using IgG-coated beads and eluted by TEV protease cleavage. The same protocol was applied to cells stably expressing SMN1 minigene, without the tag, as control. (D) Specific affinity purification of components bound to PP7-tagged SMN1 transcript, WB analysis. Nuclear supernatants prepared from cell lines stably expressing the SMN1-PP75ʹUTR (SMN1+ PP7) transcript (right), or SMN1 WT (SMN1 WT) transcript without the tag (left), were affinity purified. Aliquots from the different steps of the affinity purification were analysed by WB using an anti-hnRNP G antibody. Lanes 1, 8: nuclear supernatant (Nuc. Sup.); lanes 2, 9: material not bound to the beads (Unbound); lanes 3,4, 10,11: washes, 1st and 4th, respectively; lanes 5–7, 12–14: elutions [1–3] (*, heavy and light chains of the IgG antibody used for the affinity purification procedure. **, ZZTEVPP7CP protein). (E) WB analysis of proteins bound to SMN1 pre-mRNA. (F) RT-PCR analysis of bound RNA. Both primer pairs of SMN1 amplify SMN1 pre-mRNA. Actin is used as a negative control. Nuc. Sup., starting material; Elution, bound material; N.C, negative control, PCR of RNA without reverse transcription. Both primers pairs of SMN1 amplify SMN1 pre-mRNA. Identity of bands is given on the left; open boxes, exons; lines, introns; arrows, PCR primers. All DNA bands were confirmed by sequencing.
Figure 4.
Figure 4.
A potential role for NCL in SOS. (A-D) The recovery of SOS by ini-tRNA complementation is NCL dependent. (A) Hypothesis and experimental design. It was previously shown that abrogation of SOS, caused by mutations in the translation initiation AUG codon can be rescued by expressing ini-tRNA constructs carrying anticodon mutations that complement the AUG mutations [20]. Specifically, it was shown that bypassing SOS in an AUG to ACG mutant (CAD-Mut31), which elicits latent splicing [19], could be rescued by a mutant ini-tRNA that carries a complementary anticodon (CGU) mutation, resulting in a reduced level of latent splicing [20]. We hypothesize that the above rescue of SOS by ini-tRNA complementation is NCL dependent. (B – D) Experimental verification using the CAD minigene. HEK 293 T cells were co-transfected with CAD-Mut31 (CAD31), which carries the mutated ACG start-codon; with mutant ini-tRNA, in which the antisense codon was mutated to CGU (ini-CGU), as indicated; and with si-RNA directed against NCL (NCLsi) and control siRNA control (CONTsi), as indicated. (B) Quantification of NCL knockdown. NCL was analysed by WB and normalized to GAPDH. (C) RT-PCR analysis of: un-transfected cells; cells transfected with: CAD Mut31(CAD31); CAD Mut31(CAD31)+ mutant ini-tRNA (ini-CGU); CAD Mut31(CAD31)+ mutant ini-tRNA (ini-CGU)+control si-RNA (CONTsi); and CAD Mut31(CAD31)+ mutant ini-tRNA (ini-CGU)+siRNA against NCL (NCLsi), using CAD minigene specific primers, as indicated. (D) The block diagrams represent averages of three independent experiments. The densitometric ratio of CAD31 was established as 100%. (E-H) Decrease in NCL concentration is followed by increase in latent splicing of the endogenous gene transcript LARS. HEK 293 T cells were transfected with increasing amount of siRNA against NCL (0, 22.5 nM, and 45 nM) and control siRNA. (E, F) Quantification of the NCL knockdown. NCL was analysed by WB (E); and data were normalized to GAPDH, with the level of un-transfected cells taken as 1. (G, H) RT-PCR validation of activation of LSS in intron 14 of the endogenous LARS gene transcript, using the indicated primers. Quantification of the RT-PCR. The densitometric ratio of NCLsi 45 nM was established as 100%. The data are Means ±SD of the independent analyses.
Figure 5.
Figure 5.
Latent splice sites (LSSs) in human genes. (A) Flowchart of computational steps performed to identify LSSs using the hg19 assembly of the human genome. 1Number of transcripts reflect only multiple-exon protein-coding transcripts annotated on chromosomes 1–22, X, and Y. 2Candidate GTs include only those GTs located within-CDS intronic regions that would extend the upstream exon by at most 1000 nt while preserving a downstream intronic region of at least 20 nt (see also Table S2). (B) Examples of GTs evaluated for their potential LSS function in intron 15 of the PLEKHN1 gene (RefSeq accession number NM_032129). (C) Distributions of MaxEntScan scores for LSSs and corresponding annotated donor 5’SSs. 0.9% of annotated 5’SSs have scores lower than −5 (not shown), and can be as low as −42.68. (D) Distribution of differences in MaxEntScan scores between the highest scoring LSSs located downstream of an annotated 5’SS and the score of that 5’SS. 34.2% of 5’SSs have at least one stronger LSS downstream of them. (E) Distributions of distances between LSSs and corresponding 5’SSs (i.e. exon extensions). ‘Single LSSs’ denotes those cases where a single LSS can be found downstream of a specific 5’SS (8886 cases). For 5’SSs with more than one LSS downstream (159,931 cases), distributions of exon extensions for both the closest and strongest LSSs are shown.
Figure 6.
Figure 6.
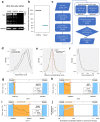
Identification of LSSs activated by knockdown of NCL. (A, B) HEK 293 cells were treated by siRNA against NCL (see Materials and Methods). As controls, we used non-targeting siRNA #1(Dharmacon), and non-treated cells. Proteins and RNA were extracted after 48 hr. (A) Proteins were analysed by SDS PAGE. (B) Analysis of NCL expression using RNA-seq data (see Materials and Methods). Normalized reads of RNA from cells treated by siNCL (NCLsi) and siControl (CONTsi) (biological duplicates from each) are presented (see also Table S4). (C) The computational pipeline for identification of activated LSSs. Selection of LSS activated candidates was done based on the presence of split reads supporting the LSS junction. Replicate 1 and 2 can refer to either sample replicate pairs. Expression profiles for all candidates were analysed individually to assure consistency between the two replicates. SRS – split read support (see also Table S5). (D) Distribution of MaxEntScan scores for the 399 activated LSS and the corresponding 385 annotated 5’SS upstream of them. (E) Distribution of differences in MaxEntScan scores between the activated LSSs and the corresponding upstream 5’SS (score5’SS – scoreLSS). There are 401 unique LSS-5’SS pairs. Data for the set of non-activated LSSs was obtained with the highest scoring LSSs downstream of the 103,375 5’SSs with split read support of at least 10 reads for the canonical junction in both CONTsi samples. (F) Distribution of lengths for exon extensions caused by LSS activation. (G-I) Typical expression profiles of exon extension regions upstream of LSSs activated in NCLsi samples. Positions of in-frame STOPs are shown by red segments. Numbers on top of the graph indicate MxEntScan scores for the annotated 5’SS (black) and the LSS (red). The length of the exon extension is indicated in the corresponding segment of the gene model. (J) Composite profile showing the fold difference in expression level between NCLsi and CONTsi samples for all 399 cases of activated LSSs. The black line represents median fold difference values at nucleotide resolution, whereas the grey area represents the 95% confidence interval for the median.
Figure 7.
Figure 7.
Overview of LSS activation upon NCL knockdown. Colour-coded levels of fold-difference in expression levels is shown for all 399 activated LSSs. Fold difference was computed using normalized expression levels, where the normalization factor was the number of split reads supporting the corresponding annotated 5’SS (see also Table S5). (A) Data are shown for the actual length of exon extension regions, and LSSs are sorted based on the exon extension length. (B) LSSs are sorted based on the average fold difference across the exon extension region, which is shown as a standardized length of 100 bp. The difference in MaxEntScan score between the LSS and the corresponding 5’SS is shown on the right. Shades of red correspond to cases where the LSS has a score higher or close to the score of the corresponding 5’SS. The score is not significantly correlated with the increase in expression observed for the exon extension (Spearman’s ρ = −0.051, p = 0.3).
Figure 8.
Figure 8.
Genes with activated LSSs upon NCL knockdown. (A) List of 20 activated LSSs with strongest support based on split reads from the RNA-seq experiments. Cases are ranked based on the p-value obtained using one-sided Fisher’s exact test with the number of reads supporting the LSS and the annotated 5’SS in the NCLsi and CTRLsi samples (values of the two replicates were combined using Fisher’s method). The fold difference in normalized LSS usage between NCLsi and CTRLsi samples is shown in light blue (the value shown corresponds to the geometric mean between the two replicates). Name of the gene and length of the exon extension are also provided (complete details for these cases can be found in Table S5). Cases experimentally validated through RT-PCR are highlighted. The case in the HEATR1 gene was ranked 32nd, but is included here to show it was also experimentally validated. (B) RT-PCR validation of activation of latent splicing at LSSs in nine genes expressed in NCLsi treated HEK 293 T cells. CONTsi treated cells were used as the control. Numbers below PCR bands represent the sizes of the PCR products obtained with primers designed to match the schematic representation shown on the left (boxes represent exons, narrow box represents latent exon, i.e. exon extension, triangles represent primers). Bars represent averages and SEMs for three biological replicates. TCERG1, Transcription Elongation Regulator 1; ANK2, Ankyrin 2; LARS, Leucyl-tRNA Synthetase; COPA, Coatomer Protein Complex Subunit Alpha; WASHC5, WASH complex subunit 5; RAF1, Proto-Oncogene, Serine/Threonine Kinase; VRK2, vaccinia-related kinase (VRK) of serine/threonine kinase 2; HTT, Huntingtin; HEATR1, HEAT Repeat Containing 1. GAPDH, glyceraldehyde-3-phosphate dehydrogenase was used for normalization. All PCR products were verified by sequencing. (C) Gene sets from MSigDB over-represented among the 362 genes with activated LSSs. Circle areas correspond to the number of genes. Gray lines connect gene sets that share at least 50% of the genes in the smaller set. Thick circle borders correspond to gene sets that remain significant after stringent overall Bonferroni correction for multiple testing (17,810 total tests) (see also Table S6).
Figure 9.
Figure 9.
An updated speculative schematic model for the quality control function of SOS. (A) The supraspliceosome model [39,43,69,83,84]. Exon, red; intron, light blue. (Top) The folded pre-mRNA that is not being processed is protected within the cavities of the native spliceosome. (Bottom) When a staining protocol that allows visualization of nucleic acids was used, RNA strands and loops were seen emanating from the supraspliceosomes [85]. The RNA kept in the cavity likely unfolded and looped-out under these conditions. In the looped-out scheme an alternative exon is depicted in the upper right corner. (B) Zoom into one spliceosome. Left scheme, splicing at the authentic 5SS; right scheme, splicing at the latent 5SS. Blue stripes, exons; red line, intron; yellow narrow stripe, latent exon; red circle, in-frame STOP codon; circles, U snRNPs; Orange ellipse (UAC), initiator-tRNA; purple ellipse, NCL directly bound with ini-tRNA; and blue ellipse, additional associated components; Orange triangles, hypothesized triplet-binding proteins; red triangle, STOP-codon-binding protein. Updated from ref [20].

Similar articles

Cited by

References

    1. Kelemen O, Convertini, P, Zhang, Z, et al. Function of alternative splicing. Gene. 2013;514(1):1–30. - PMC - PubMed
    1. Lee Y, Rio DC.. Mechanisms and regulation of alternative pre-mRNA splicing. Annu Rev Biochem. 2015;84(1):291–323. - PMC - PubMed
    1. Akerman M, Fregoso, OI, Das, S, et al. Differential connectivity of splicing activators and repressors to the human spliceosome. Genome Biol. 2015;16(1):119. - PMC - PubMed
    1. Papasaikas P, and Valcárcel J. The spliceosome: The ultimate RNA chaperone and sculptor. Trends Biochem Sci. 2016;41(1):33–45. - PubMed
    1. Fiszbein A, Kornblihtt AR. Alternative splicing switches: important players in cell differentiation. Bioessays. 2017;39(6):1600157. - PubMed

Publication types