. 2022 Oct;18(10):2459-2480.
doi: 10.1080/15548627.2022.2039000. Epub 2022 Feb 27.

A defective lysophosphatidic acid-autophagy axis increases miscarriage risk by restricting decidual macrophage residence

Affiliations

A defective lysophosphatidic acid-autophagy axis increases miscarriage risk by restricting decidual macrophage residence

Hui-Li Yang et al. Autophagy. 2022 Oct.

Abstract

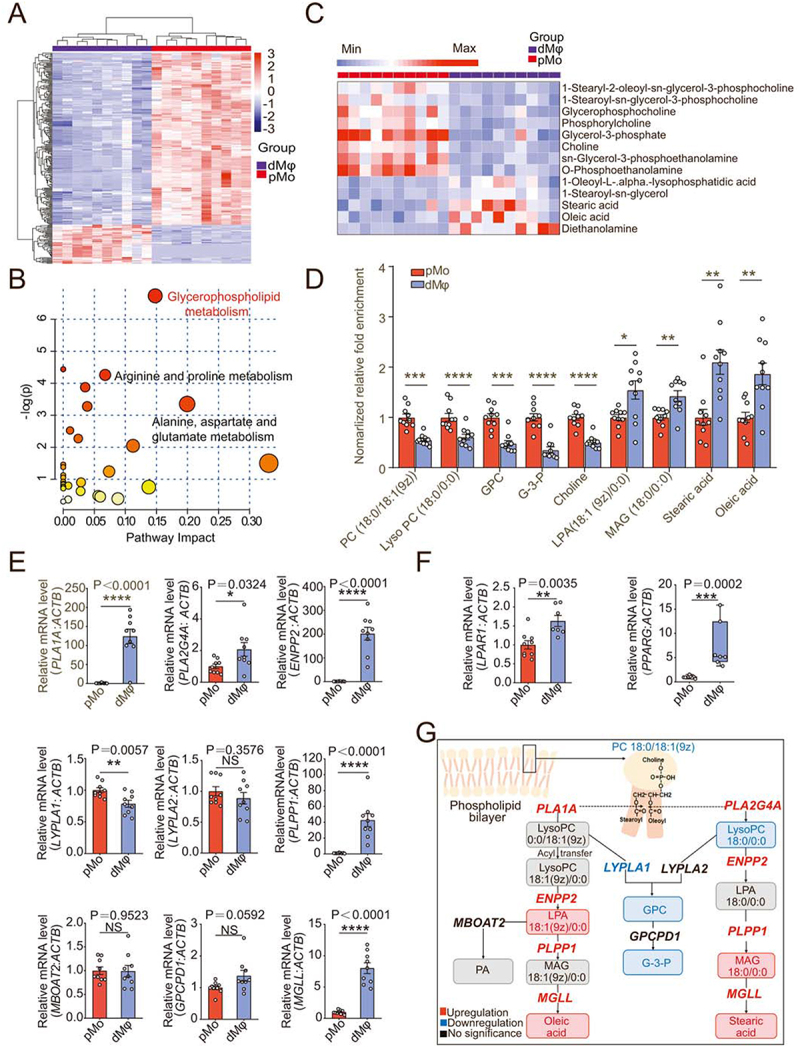
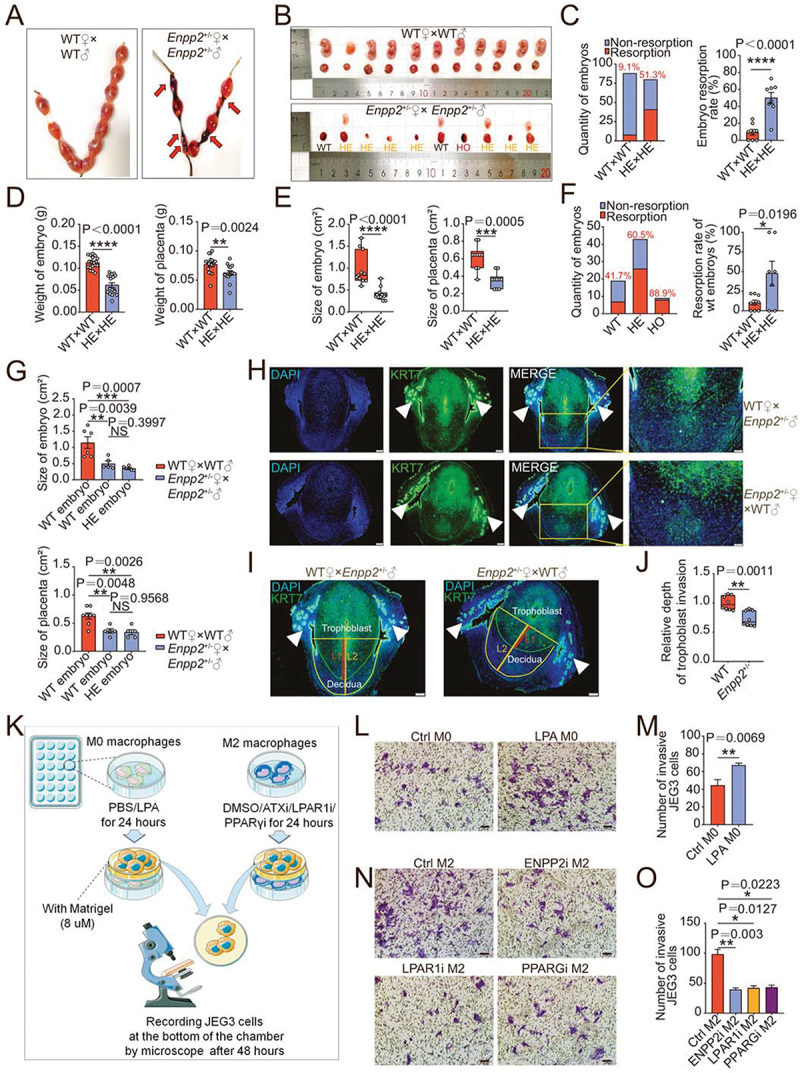
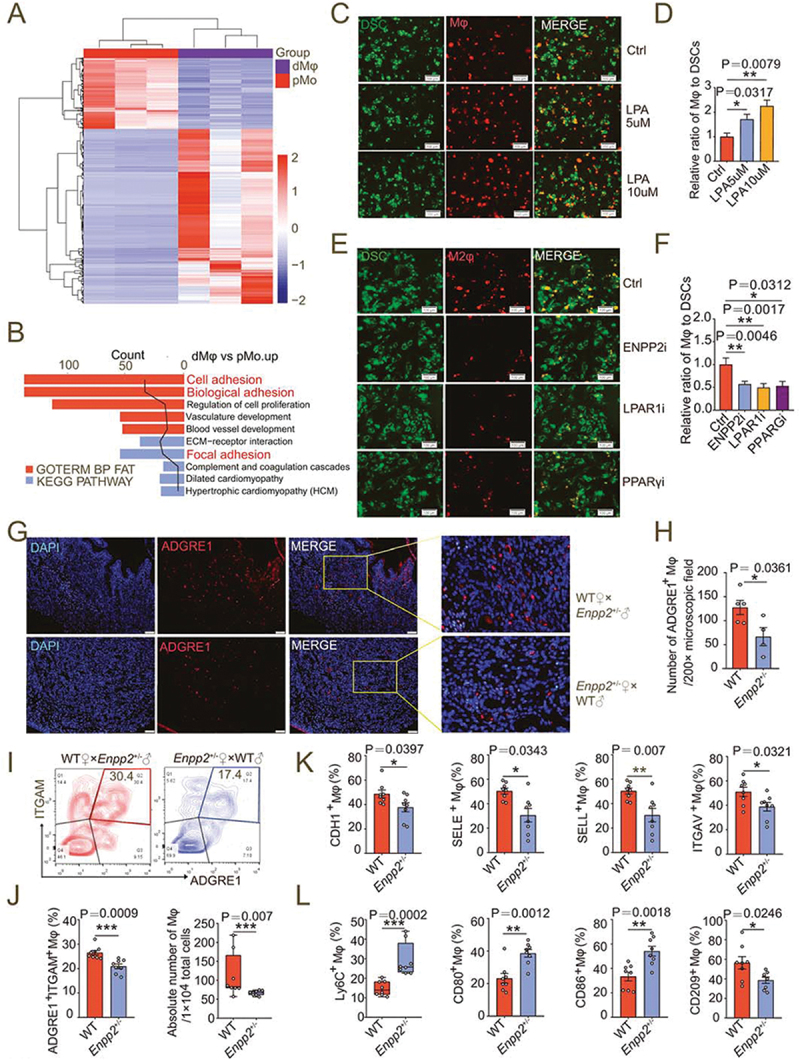
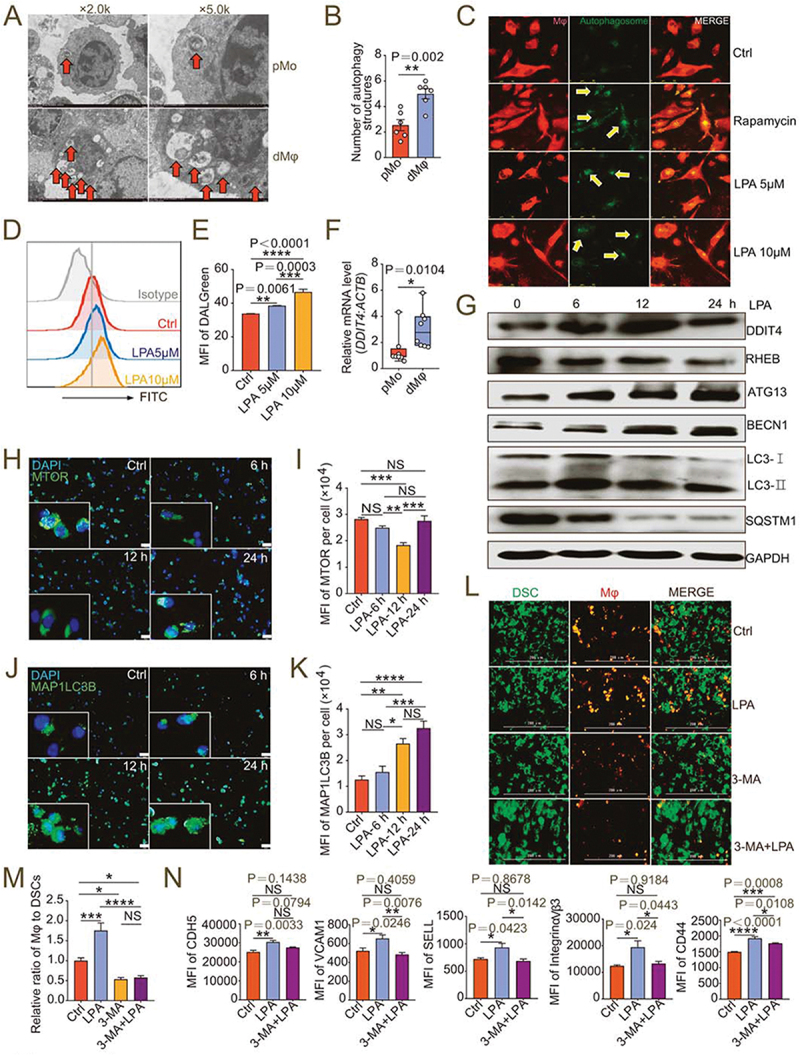
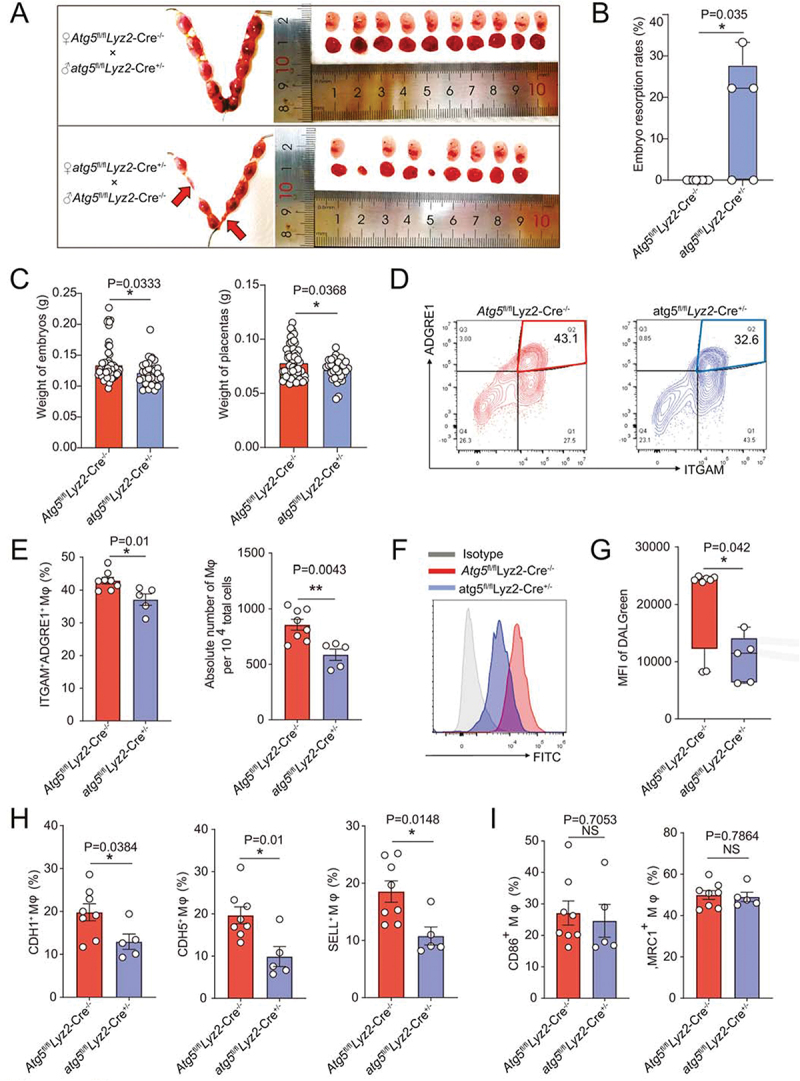
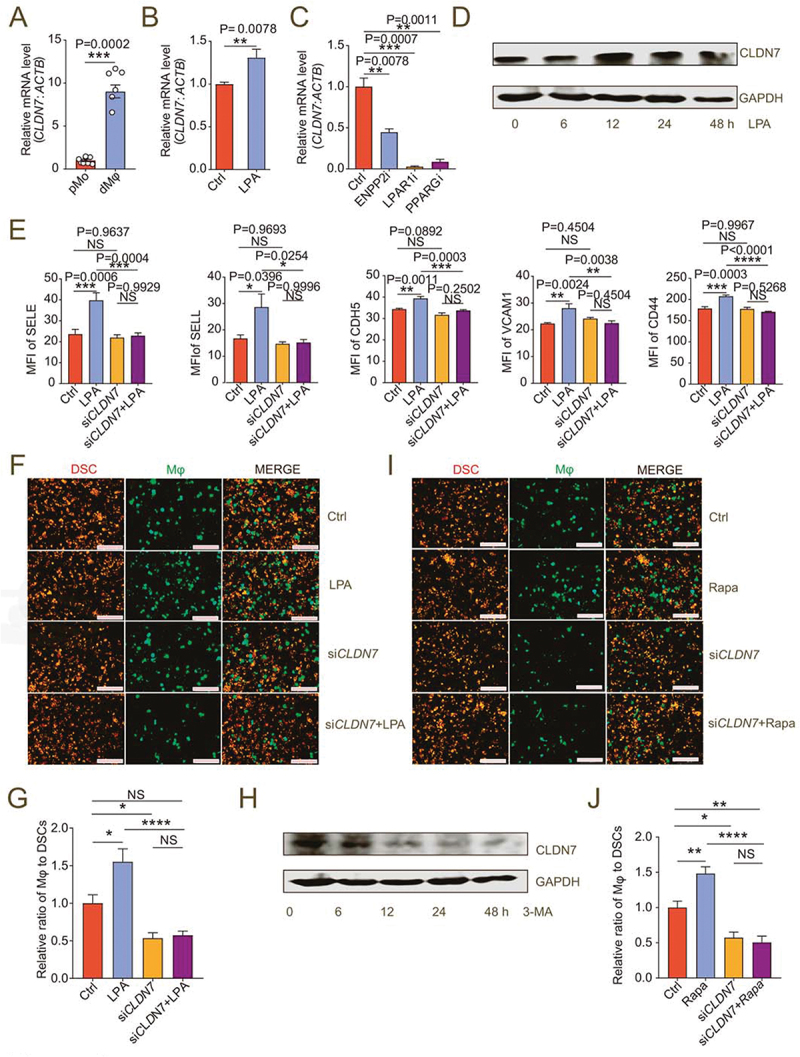
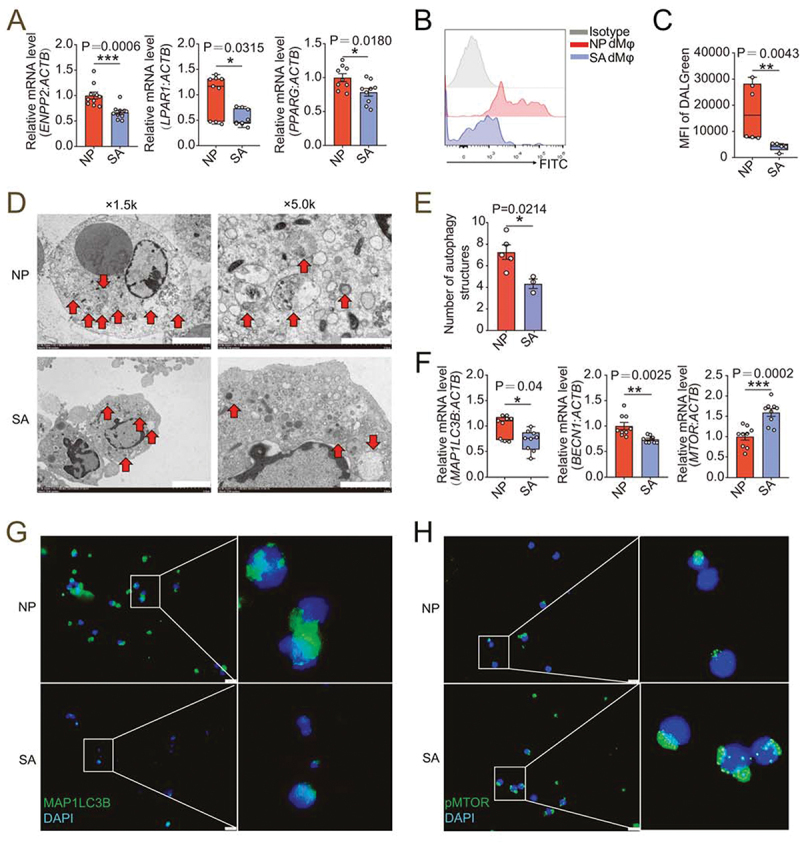
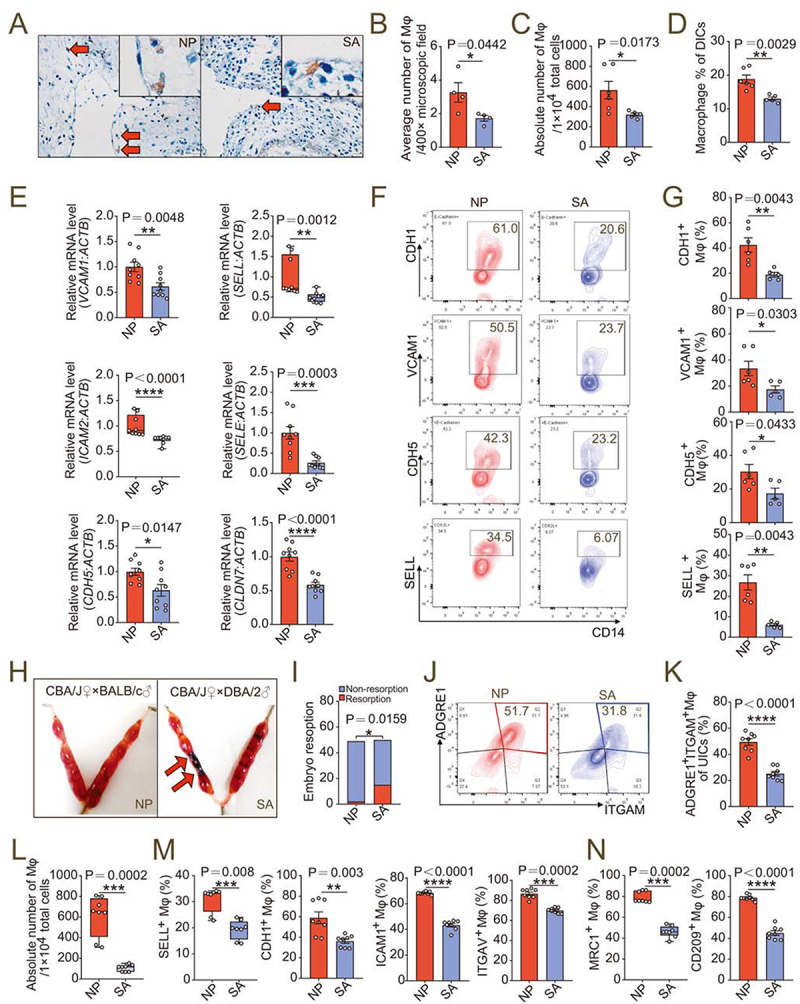
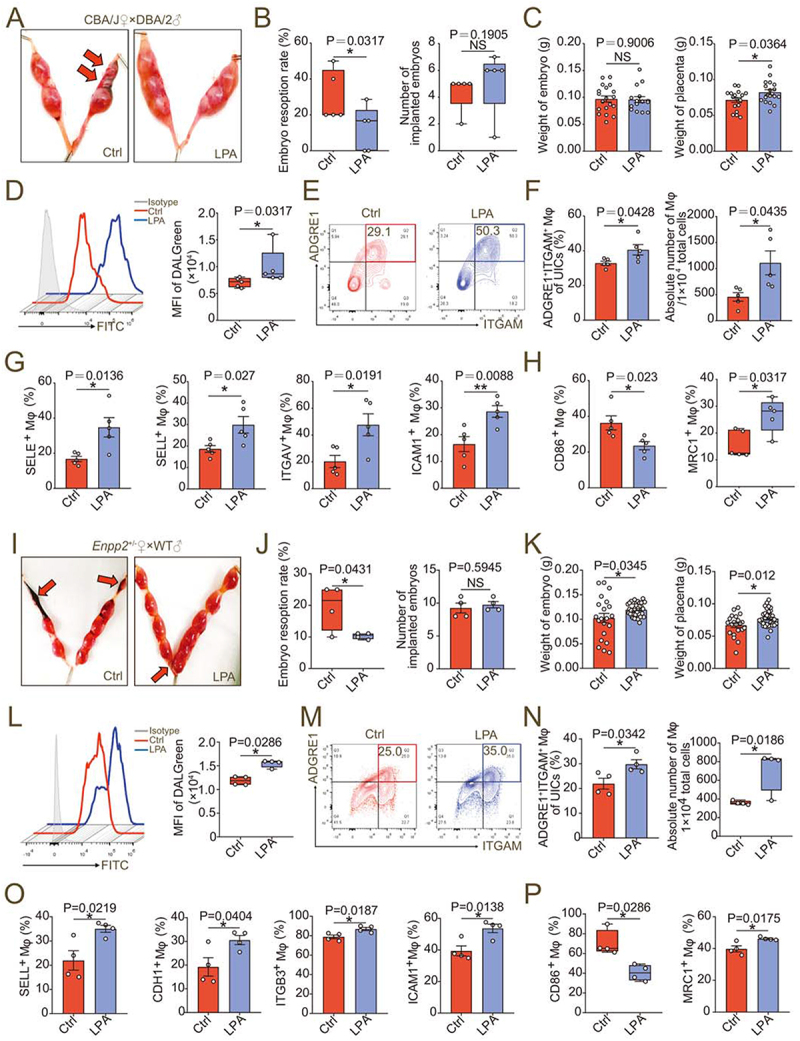
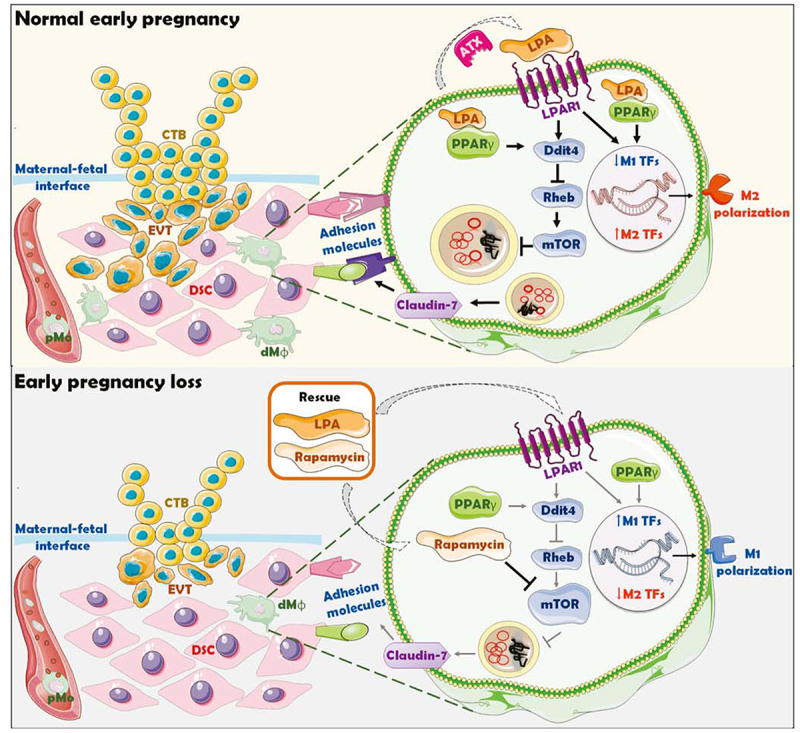
Massive infiltrated and enriched decidual macrophages (dMφ) have been widely regarded as important regulators of maternal-fetal immune tolerance and trophoblast invasion, contributing to normal pregnancy. However, the characteristics of metabolic profile and the underlying mechanism of dMφ residence remain largely unknown. Here, we observe that dMφ display an active glycerophospholipid metabolism. The activation of ENPP2-lysophosphatidic acid (LPA) facilitates the adhesion and retention, and M2 differentiation of dMφ during normal pregnancy. Mechanistically, this process is mediated through activation of the LPA receptors (LPAR1 and PPARG/PPARγ)-DDIT4-macroautophagy/autophagy axis, and further upregulation of multiple adhesion factors (e.g., cadherins and selectins) in a CLDN7 (claudin 7)-dependent manner. Additionally, poor trophoblast invasion and placenta development, and a high ratio of embryo loss are observed in Enpp2±, lpar1-/- or PPARG-blocked pregnant mice. Patients with unexplained spontaneous abortion display insufficient autophagy and cell residence of dMφ. In therapeutic studies, supplementation with LPA or the autophagy inducer rapamycin significantly promotes dMφ autophagy and cell residence, and improves embryo resorption in Enpp2± and spontaneous abortion mouse models, which should be dependent on the activation of DDIT4-autophagy-CLDN7-adhesion molecules axis. This observation reveals that inactivation of ENPP2-LPA metabolism and insufficient autophagy of dMφ result in resident obstacle of dMφ and further increase the risk of spontaneous abortion, and provides potential therapeutic strategies to prevent spontaneous abortion.Abbreviations: ACTB: actin beta; ADGRE1/F4/80: adhesion G protein-coupled receptor E1; Atg5: autophagy related 5; ATG13: autophagy related 13; BECN1: beclin 1; CDH1/E-cadherin: cadherin 1; CDH5/VE-cadherin: cadherin 5; CFSE: carboxyfluorescein succinimidyl ester; CLDN7: claudin 7; CSF1/M-CSF: colony stimulating factor 1; CSF2/GM-CSF: colony stimulating factor 2; Ctrl: control; CXCL10/IP-10: chemokine (C-X-C) ligand 10; DDIT4: DNA damage inducible transcript 4; dMφ: decidual macrophage; DSC: decidual stromal cells; ENPP2/ATX: ectonucleotide pyrophosphatase/phosphodiesterase 2; Enpp2±: Enpp2 heterozygous knockout mouse; ENPP2i/PF-8380: ENPP2 inhibitor; EPCAM: epithelial cell adhesion molecule; ESC: endometrial stromal cells; FGF2/b-FGF: fibroblast growth factor 2; GAPDH: glyceraldehyde-3-phosphate dehydrogenase; GPCPD1: glycerophosphocholine phosphodiesterase 1; HE: heterozygote; HIF1A: hypoxia inducible factor 1 subunit alpha; HNF4A: hepatocyte nuclear factor 4 alpha; HO: homozygote; ICAM2: intercellular adhesion molecule 2; IL: interleukin; ITGAV/CD51: integrin subunit alpha V; ITGAM/CD11b: integrin subunit alpha M; ITGAX/CD11b: integrin subunit alpha X; ITGB3/CD61: integrin subunit beta 3; KLRB1/NK1.1: killer cell lectin like receptor B1; KRT7/cytokeratin 7: keratin 7; LPA: lysophosphatidic acid; LPAR: lysophosphatidic acid receptor; lpar1-/-: lpar1 homozygous knockout mouse; LPAR1i/AM966: LPAR1 inhibitor; LY6C: lymphocyte antigen 6 complex, locus C1; LYPLA1: lysophospholipase 1; LYPLA2: lysophospholipase 2; Lyz2: lysozyme 2; MAP1LC3B: microtubule associated protein 1 light chain 3 beta; MARVELD2: MARVEL domain containing 2; 3-MA: 3-methyladenine; MBOAT2: membrane bound O-acyltransferase domain containing 2; MGLL: monoglyceride lipase; MRC1/CD206: mannose receptor C-type 1; MTOR: mechanistic target of rapamycin kinase; NP: normal pregnancy; PDGF: platelet derived growth factor; PLA1A: phospholipase A1 member A; PLA2G4A: phospholipase A2 group IVA; PLPP1: phospholipid phosphatase 1; pMo: peripheral blood monocytes; p-MTOR: phosphorylated MTOR; PPAR: peroxisome proliferator activated receptor; PPARG/PPARγ: peroxisome proliferator activated receptor gamma; PPARGi/GW9662: PPARG inhibitor; PTPRC/CD45: protein tyrosine phosphatase receptor type, C; Rapa: rapamycin; RHEB: Ras homolog, mTORC1 binding; SA: spontaneous abortion; SELE: selectin E; SELL: selectin L; siCLDN7: CLDN7-silenced; STAT: signal transducer and activator of transcription; SQSTM1: sequestosome 1; TJP1: tight junction protein 1; VCAM1: vascular cell adhesion molecule 1; WT: wild type.

Keywords: Abortion; CLDN7; DDIT4; ENPP2; LPAR1; decidual macrophage; lysophosphatidic acid; trophoblast invasion.


Conflict of interest statement

No potential conflict of interest was reported by the author(s)

Figures

Figure 1.
Figure 1.
Decidual macrophages exhibit an active glycerophospholipid metabolic profile and are rich in LPA. (a) Heatmap of differential metabolites in metabolomics for pMo (n = 10) and dMφ (n = 10) from normal early pregnant women. (b) Enriched metabolic pathways of differential metabolites in (a) was obtained by topology analysis. (c and d) Differential metabolites in glycerophospholipid metabolism pathway between pMo and dMφ. (e) Relative mRNA expression of metabolic enzymes in glycerophospholipid metabolism pathway between pMo and dMφ by RT-PCR. (f) Transcriptional levels of LPAR1 and PPARG in pMo and dMφ by RT-PCR. (g) Summary of glycerophospholipid metabolism characteristics in dMφ from normal early pregnant women (inside the box: metabolites, outside the box: metabolic enzymes). Data were presented as mean ± SEM or median and quartile and analyzed by t test or Mann-Whitney U test. *P < 0.05, **P < 0.01, ***P < 0.001, ****P < 0.0001, NS: no significance.
Figure 2.
Figure 2.
Macrophage with aberrant LPA metabolism induces spontaneous abortion by impairing trophoblast invasion and placenta development. (a) Photograph of uterus of wild-type (WT) and Enpp2± mice (red arrow: resorption point). (b) Photograph of embryos and placentas of WT (WT♀×WT♂) and Enpp2± (Enpp2±♀×Enpp2±♂) pregnant mice and the genotypes of embryos for Enpp2± pregnant mice. (c) Numbers of resorptive and non- resorptive embryos of WT and Enpp2± mice (left, red number on the top of the columns: the total resorption rate) and comparison of resorption rates of total embryos (right, n = 8). (d and e) The weight or size of embryos and placentas of WT and Enpp2± mice. (f) Numbers of resorptive and non-resorptive embryos different genotypes of Enpp2± mice (left, red number on the top of the columns: the total resorption rate) and comparison of the resorption rates of WT embryos from WT (n = 9) and Enpp2± (n = 7) pregnant mice (right). (g) Comparison of the sizes of WT embryos from WT pregnant mice and WT or HE embryos form Enpp2± pregnant mice. (h) Diffusion and invasion of KRT7+ trophoblasts into uterus of WT (n = 8) or Enpp2±(n = 8) pregnant mice (white solid triangles: uterine glandular epithelium cells). (i and j) Relative depth of trophoblast invasion into uterus: the ration of KRT7+ trophoblast depth (Line 1/L1 in red) to the total depth (Line 2/L2 in Orange) (white solid triangles: uterine glandular epithelium cells). (k) Schematic diagram of the operation of the invasion assays of JEG3 cells in the co-culture system with M0 macrophages or M2 macrophages. (l) Matrigel invasion assays for evaluation of the invasiveness of JEG3 cells in the co-culture system (48 h) with control or LPA-treated M0 macrophages (24 h). (m) Statistical graph of numbers of invasive JEG3 cells from (l). (n) Matrigel invasion assays for evaluation of the invasion of JEG3 cells in the co-culture system (48 h) with control, ENPP2 inhibitor, LPAR1 inhibitor or PPARG inhibitor-treated M2 macrophages macrophage (24 h). (o) Statistical graph of numbers of invasive JEG3 cells from (n). Data were presented as mean ± SEM or median and quartile and analyzed by t test, Mann-Whitney U test or one-way ANOVA test. *P < 0.05, **P < 0.01, ***P < 0.001, ****P < 0.0001, NS: no significance.
Figure 3.
Figure 3.
LPA promotes the adhesion and enrichment of M2-polarized macrophages in decidua. (a) Heatmap of differential genes in RNA-seq for pMo (n = 3) and dMφ (n = 3) from women with normal pregnancy. (b) Enriched KEGG and GOTERM pathways of differential gene clustering from (a). (c and d) Adhesion assays for control or LPA-treated (24 h) PKH-26-labeled red-fluorescent M0 macrophages to PKH-67-labeled green-fluorescent DSCs (n = 5). (e and f) Adhesion assays for PKH-26-labeled red-fluorescent M2 macrophages treated with vehicle (n = 10), ENPP2 inhibitor (n = 7), LPAR1 inhibitor (n = 6) or PPARG inhibitor (n = 6) for 24 h to PKH-67-labeled green-fluorescent DSCs. (g and h) The residence and number of ADGRE1+ macrophages in the uterus of WT (n = 5) and Enpp2± (n = 4) mice by immunofluorescence assays. (i and j) Flow cytometry assays for detection of the proportion in PTPRC+ immune cells and the absolute numbers of ADGRE1+ITGAM+ uterine macrophages per 10,000 cells in uterus of WT (n = 8) or Enpp2± (n = 8) pregnant mice. (k and l) Adhesion molecules and differentiation markers of PTPRC+ADGRE1+ITGAM+ uterine macrophages of WT (n = 8) or Enpp2± (n = 8) pregnant mice in flow cytometry assays. Data were presented as mean ± SEM or median and quartile and analyzed by t test, Mann-Whitney U test or one-way ANOVA test. *P < 0.05, **P < 0.01, ***P < 0.001.
Figure 4.
Figure 4.
Autophagy is critical to LPA-induced adhesion of dMφ in decidua. (a) Autophagic structures under transmission electron microscopy in pMo (n = 6) and dMφ (n = 6). (b) Numbers of autophagic structures in (a). (c) DALGreen for autophagy detection of M0 macrophages dyed with PKH26 red fluorescence and treated with vehicle, rapamycin, LPA (5 μM or 10 μM) for 48 h. (d and e) Flow cytometry assays for autophagy detection of M0 macrophages treated with vehicle or LPA (5 μM or 10 μM) for 48 h. (f) Transcription level of DDIT4 in pMo (n = 8) and dMφ (n = 8) by RT-PCR. (g) Western-blot for DDIT4, RHEB, ATG13, BECN1, LC3I/II or SQSTM1 of M0 macrophages treated with LPA (10 μM) for 0, 6, 12 or 24 h. (h-k) Immunofluorescence detection for MTOR and MAP1LC3B expression of M0 macrophages treated with LPA (10 μM) for 0, 6, 12 or 24 h. (l and m) Adhesion assays for control, LPA-treated (10 μM for 24 h), 3-MA-treated (10 mM for 24 h) or both 3-MA (10 mM for 24 h-pretreatment) and LPA-treated (10 μM for 24 h) PKH-26-labeled red-fluorescent dMφ to green-fluorescent DSCs (n = 5). (n) Flow cytometry assays for adhesion molecule expression of control, LPA-treated (10 μM for 24 h) or 3-MA (10 mM for 24 h-pretreatment) and LPA-treated (10 μM for 24 h) dMφ. Data were presented as mean ± SEM or median and quartile and analyzed by t test, Mann-Whitney U test or one-way ANOVA test. *P < 0.05, **P < 0.01, ***P < 0.001, ****P < 0.0001, NS: no significance.
Figure 5.
Figure 5.
Atg5fl/fl Lyz2-Cre± pregnant mice show adverse pregnancy outcomes and reduced uterine macrophage residence. (a and b) Photograph (red arrow: absorption point) and analysis of embryo absorption rates and numbers of implanted embryos of uterus from atg5fl/fl Lyz2-Cre± (mated with male Atg5fl/fl Lyz2-Cre−/− mice, n = 8) and Atg5fl/fl Lyz2-Cre−/− (mated with male atg5fl/fl Lyz2-Cre± mice, n = 5) pregnant mice. (c) Comparison of weight of embryos and placentas of atg5fl/fl Lyz2-Cre± (n = 8) and Atg5fl/fl Lyz2-Cre−/− (n = 5) pregnant mice. (d and e) The residence and number of ADGRE1+ macrophages in the uterus of atg5fl/fl Lyz2-Cre± (n = 8) and Atg5fl/fl Lyz2-Cre−/− (n = 5) pregnant mice by immunofluorescence assays. (f and g) Flow cytometry assays for autophagy detection of ADGRE1+ ITGAM+ uterine macrophages of atg5fl/fl Lyz2-Cre± (n = 8) and Atg5fl/fl Lyz2-Cre−/− (n = 5) pregnant mice. (h and i) Adhesion molecules and differentiation markers of PTPRC+ ADGRE1+ ITGAM+ uterine macrophages of atg5fl/fl Lyz2-Cre± (n = 8) and Atg5fl/fl Lyz2-Cre−/− (n = 5) pregnant mice in flow cytometry assays. Data were presented as mean ± SEM or median analyzed by t test. *P < 0.05, **P < 0.01, NS: no significance.
Figure 6.
Figure 6.
LPA/autophagy-mediated adhesion and residence of dMφ is dependent on CLDN7. (a) Transcription level of CLDN7 in pMo (n = 7) and dMφ (n = 6) by RT-PCR. (b) Transcription level of CLDN7 in control or LPA-treated (10 mM for 12 h) M0 macrophages by RT-PCR. (c) Transcription level of CLDN7 in control, ENPP2 inhibitor (100 nM), LPAR1 inhibitor (100 nM) or PPARG inhibitor (3.3 nM)-treated M2 macrophages by RT-PCR (12 h). (d) Western-blot for CLDN7 expression of M0 macrophages after treatment with LPA (10 μM) for 0, 6, 12, 24 or 48 h. (e) Flow cytometry assays for adhesion molecule expression of control, LPA-treated (10 μM for 24 h), CLDN7-silenced (siCLDN7) or LPA-treated (10 μM for 24 h) siCLDN7 macrophages. (f and g) Adhesion assays of control, LPA-treated (10 μM for 24 h), siCLDN7 or LPA-treated (10 μM for 24 h) siCLDN7 green-fluorescent dMφ to PKH-26-labeled red-fluorescent DSCs (n = 5). (h) Western-blot for levels of CLDN7 of M2 macrophage after treatment with 3-MA (10 mM) for 0, 6, 12, 24 or 48 h. (i and j) Adhesion assays of control, rapamycin-treated (2 μM for 24 h), siCLDN7 or rapamycin-treated (2 μM for 24 h) siCLDN7 green-fluorescent dMφ to red-fluorescent DSCs (n = 5). Data were presented as mean ± SEM and analyzed by t test or one-way ANOVA test. *P < 0.05, **P < 0.01, ***P < 0.001, ****P < 0.0001, NS: no significance.
Figure 7.
Figure 7.
dMφ in spontaneous abortion exhibit weakened LPA-autophagy axis. (a) Transcription level of ENPP2, LPAR1 and PPARG in dMφ of women in normal early pregnancy (NP, n = 10 or 9) or with unexplained spontaneous abortion (SA, n = 10 or 9) by RT-PCR. (b and c) Flow cytometry for autophagy detection of dMφ of women in NP (n = 6) or with SA (n = 5). (d) Autophagic structures under transmission electron microscopy in dMφ from NP women (n = 5) or SA patients (n = 3). (e) Numbers of autophagic structures in (d). (f) Transcriptional level of autophagy-related genes (MAP1LC3B, BECN1 and MTOR) of dMφ of women in NP (n = 9) or with SA (n = 9) by RT-PCR. (g and h) Immunofluorescence detection for MAP1LC3B and pMTOR expression of dMφ from NP women (n = 6) or SA patients (n = 6). Data were presented as mean ± SEM or median and quartile and analyzed by t test or Mann-Whitney U test. *P < 0.05, **P < 0.01, ***P < 0.001.
Figure 8.
Figure 8.
dMφ in spontaneous abortion shows abnormal residence and reduced adhesion. (a) Immunohistochemistry assays for numbers of resident CD68+ dMφ (red arrows) from women in NP (n = 4) or with SA (n = 4). (b) Average numbers of dMφ per 400× microscope field in the images from (a). (c) Numbers of dMφ per 10,000 total decidua single cells from NP (n = 6) or SA (n = 5) women flow cytometry assays. (d) Proportion of CD14+ macrophages in PTPRC+ decidual immune cells in NP (n = 6) or SA (n = 5) group in flow cytometry assays. (e) Relative mRNA level of adhesion-related genes in NP (n = 9) or SA (n = 9) dMφ, including CDH5, SELE, SELL, VCAM1, ICAM2 and CLDN7 by RT-PCR. (f and g) Expression of adhesion molecules on NP (n = 6) or SA (n = 5) dMφ in flow cytometry assays. (h and i) Photograph (red arrow: resorption point) and embryo resorption rates of uterus from normal pregnant (NP) or spontaneous abortion-prone mouse (SA) models. (j-l) Proportion of ADGRE1+ITGAM+ uterine macrophages in PTPRC+ uterus immune cells and numbers per 10,000 uterine cells in NP (n = 8) or SA mouse models (n = 8) in flow cytometry assays. (m and n) Adhesion molecules and differentiation markers of PTPRC+ ADGRE1+ ITGAM+ uterine macrophages of NP (n = 8) or SA (n = 8) mice in flow cytometry assays. Data were presented as mean ± SEM or median and quartile and analyzed by t test or Mann-Whitney U test. *P < 0.05, **P < 0.01, ***P < 0.001, ****P < 0.0001.
Figure 9.
Figure 9.
LPA prevents pregnancy loss by promoting autophagy-mediated macrophage residence in decidua. (a and b) Photograph (red arrow: resorption point) and analysis of embryo resorption rates and numbers of implanted embryos of uterus from SA mice intraperitoneally injected with 1% PBS (Ctrl, n = 5) or LPA (n = 5). (c) Comparison of weight of embryos and placentas of SA mice intraperitoneally injected with 1% PBS (Ctrl, n = 5) or LPA (n = 5). (d) Flow cytometry assays for autophagy detection of ADGRE1+ ITGAM+uterine macrophages of SA mice intraperitoneally injected with 1% PBS (Ctrl, n = 5) or LPA (n = 5). (e and f) Flow cytometry assays for detection of the proportion of ADGRE1+ITGAM+uterine macrophages in PTPRC+ immune cells and the absolute numbers per 10,000 cells in uterus of 1% PBS (Ctrl, n = 5)/LPA (n = 5)-treated SA mice. (g and h) Adhesion molecules and differentiation markers of PTPRC+ ADGRE1+ ITGAM+ uterine macrophages of 1% PBS (Ctrl, n = 5)/LPA (n = 5)-treated SA mice in flow cytometry assays. (i and j) Photograph (red arrow: resorption point) and embryo resorption rates and numbers of implanted embryos of uterus from Enpp2± pregnant mice intraperitoneally injected with 1% PBS (Ctrl, n = 4) or LPA (n = 4). (k) Comparison of weight of embryos and placentas of Enpp2± pregnant mice intraperitoneally injected with 1% PBS (Ctrl, n = 4) or LPA (n = 4). (l) Flow cytometry assays for autophagy detection of ADGRE1+ ITGAM+ uterine macrophages of Enpp2± pregnant mice intraperitoneally injected with 1% PBS (Ctrl, n = 4) or LPA (n = 4). (m and n) Flow cytometry assays for detection of the proportion of ADGRE1+ ITGAM+ uterine macrophages in PTPRC+ immune cells and the absolute numbers per 10,000 cells in uterus of 1% PBS (Ctrl, n = 4)/LPA (n = 4)-treated Enpp2± pregnant mice. (o and p) Adhesion molecules and differentiation markers of PTPRC+ ADGRE1+ ITGAM+ uterine macrophages of 1% PBS (Ctrl, n = 4)/LPA (n = 4)-treated Enpp2± pregnant mice in flow cytometry assays. Data were presented as mean ± SEM or median and quartile and analyzed by t test or Mann-Whitney U test. *P < 0.05, **P < 0.01, NS: no significance.
Figure 10.
Figure 10.
Schematic roles of inactive lysophosphatidic acid metabolism-autophagy axis in increasing spontaneous abortion risk by restricting dMφ residence. The growth and invasion of trophoblasts is the key to the establishment and maintenance of normal pregnancy, which is accompanied by the residence and development of dMφ. The enrichment and activation of ENPP2-LPA metabolism promotes the expression of adhesion molecules on dMφ via the LPA receptors-DDIT4-RHEB-MTOR-autophagy-CLDN7 axis, thereby facilitating the adhesion and retention of macrophage in decidua. Decidual-resident macrophages further promote trophoblast invasion, fetal and placental development of early pregnancy. Inactivation of ENPP2-LPA metabolism and insufficient autophagy of dMφ results in the decrease of dMφ residence, increasing the risk of spontaneous abortion. LPA and rapamycin have potential therapeutic values in spontaneous abortion due to the activation of DDIT4-autophagy-CLDN7-adhension molecules-mediated dMφ residence and trophoblast invasion during early pregnancy.

References

    1. Musallam R, Salem N, Al Halol R, et al. Management of pregnancy loss in the first trimester: a retrospective audit. Lancet. 2018;391(Suppl 2):S34. DOI:10.1016/S0140-6736(18)30400-8. - DOI - PubMed
    1. Garrido-Gimenez C, Alijotas-Reig J.. Recurrent miscarriage: causes, evaluation and management. Postgrad Med J. 2015;91(1073):151–162. - PubMed
    1. Alijotas-Reig J, Garrido-Gimenez C. Current concepts and new trends in the diagnosis and management of recurrent miscarriage. Obstet Gynecol Surv. 2013;68(6):445–466. - PubMed
    1. Erlebacher A. Immunology of the maternal-fetal interface. Annu Rev Immunol. 2013;31(1):387–411. - PubMed
    1. Williams PJ, Searle RF, Robson SC, et al. Decidual leucocyte populations in early to late gestation normal human pregnancy. J Reprod Immunol. 2009;82(1):24–31. DOI:10.1016/j.jri.2009.08.001. - DOI - PubMed

Publication types

MeSH terms

Substances