. 2022 Nov;18(11):2561-2575.
doi: 10.1080/15548627.2022.2039991. Epub 2022 Feb 27.

The Crohn Disease-associated ATG16L1T300A polymorphism regulates inflammatory responses by modulating TLR- and NLR-mediated signaling

Affiliations

The Crohn Disease-associated ATG16L1T300A polymorphism regulates inflammatory responses by modulating TLR- and NLR-mediated signaling

Ping Gao et al. Autophagy. 2022 Nov.

Abstract

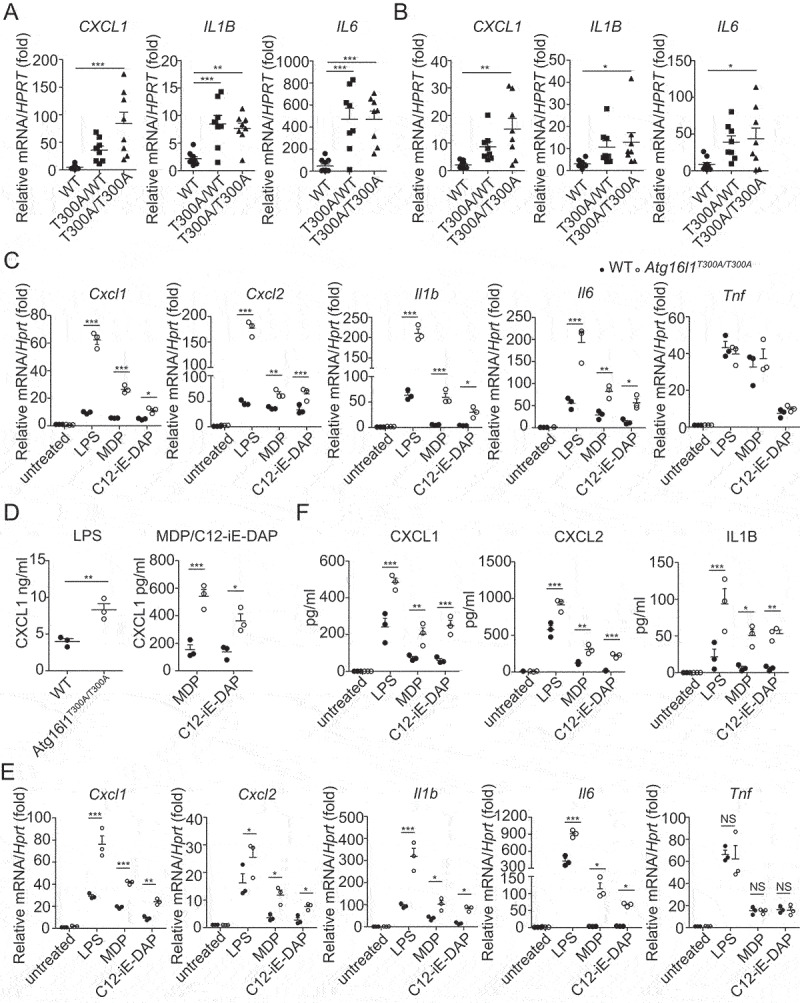
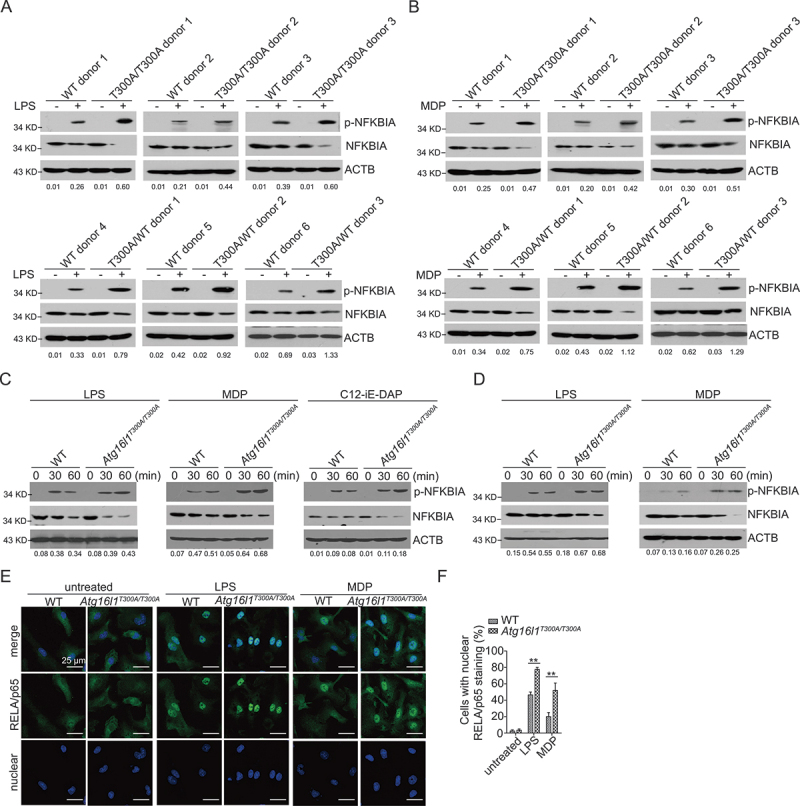
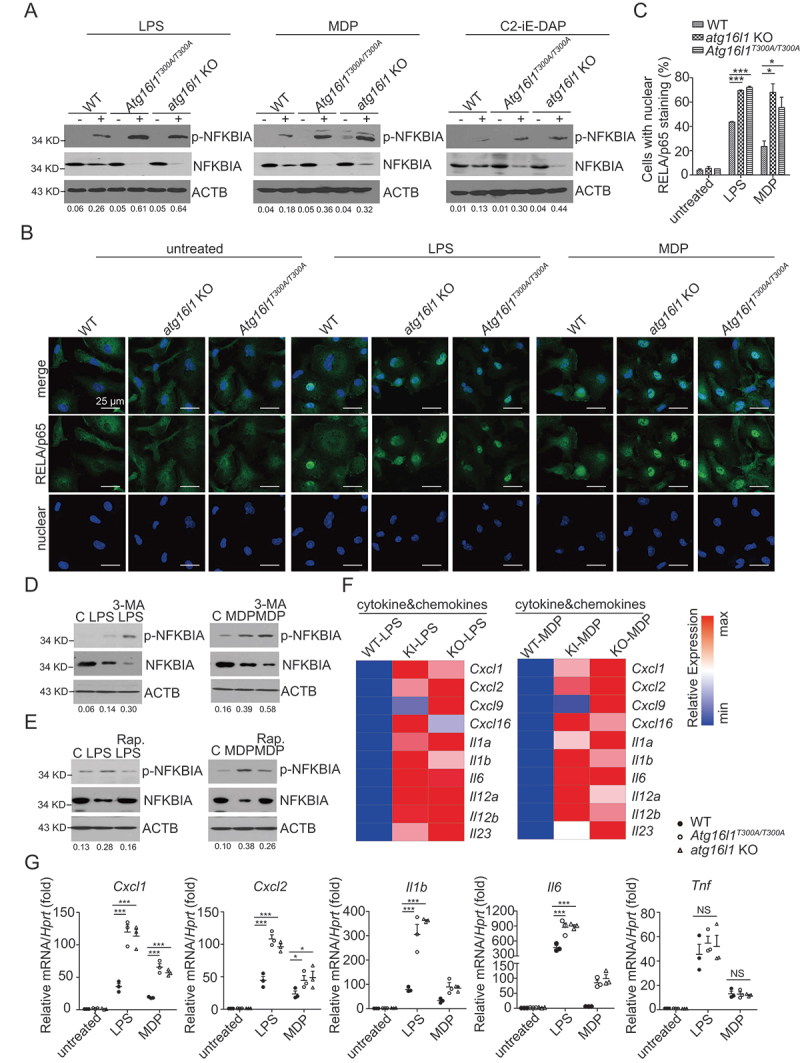
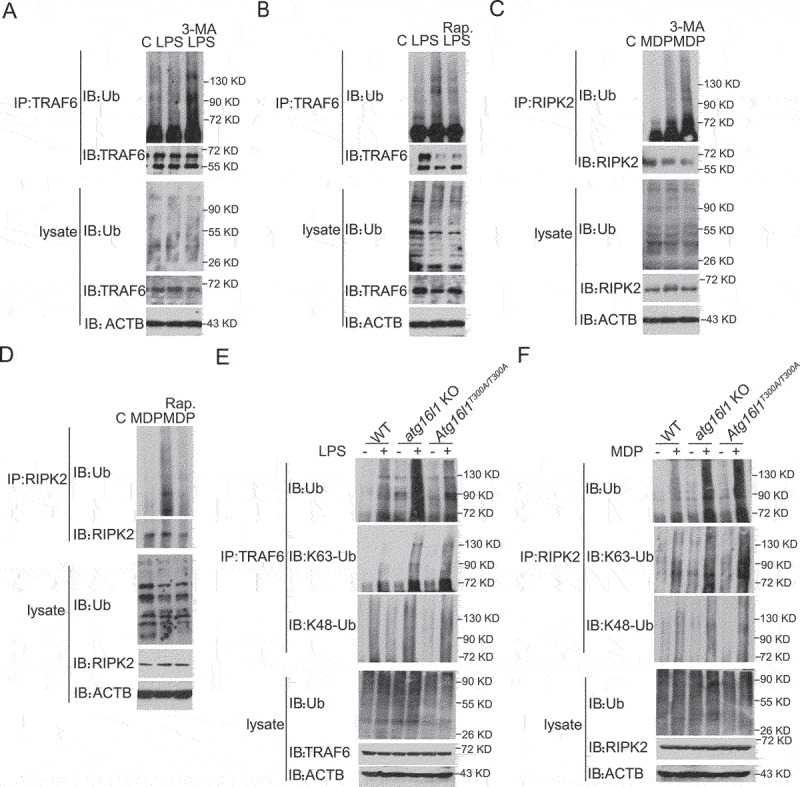
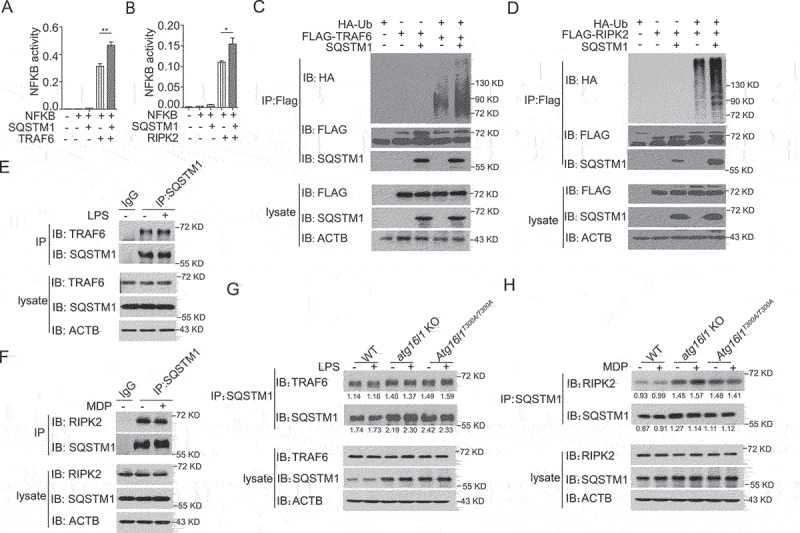
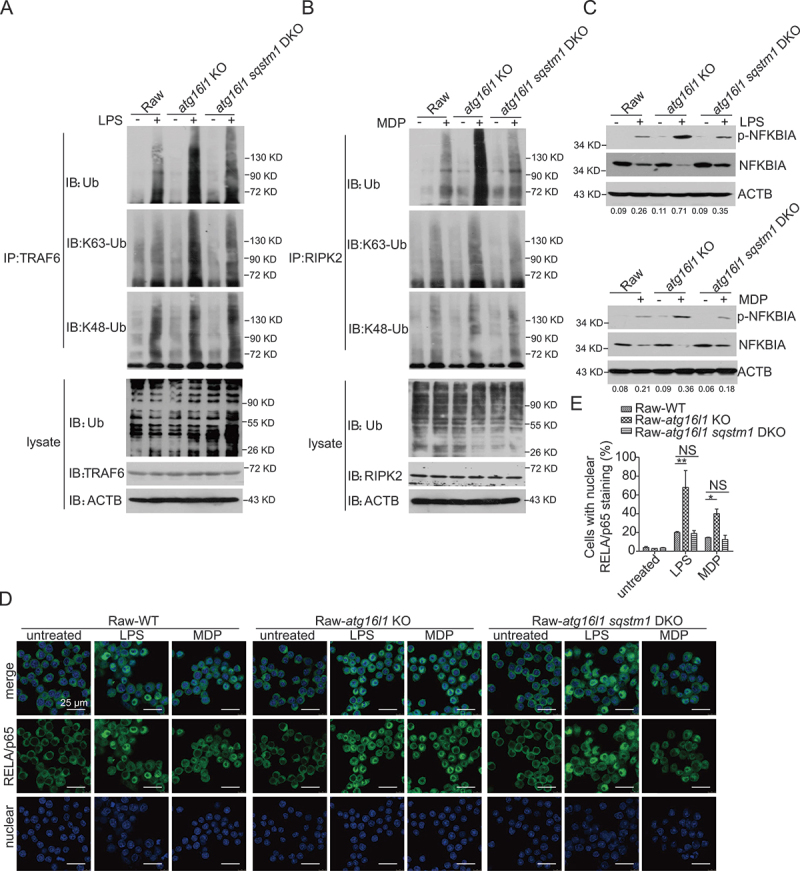
The mechanisms by which the ATG16L1T300A polymorphism affects cell function and causes an increased risk for the development of Crohn disease remain incompletely understood. Here we report that healthy individuals and mice bearing this polymorphism, even as heterozygotes, manifest enhanced TLR, and NLR cytokine and chemokine responses due to increased activation of NFKB. We elucidated the mechanism of the NFKB abnormality and found that in the ATG16L1T300A cell, there is enhanced polyubiquitination of TRAF6 or RIPK2 resulting from the accumulation of SQSTM1/p62. Indeed, knockout of Sqstm1 in autophagy-deficient cells almost completely normalized TRAF6 or RIPK2 polyubiquitination and NFKB activation in these cells. Thus, by identifying that autophagy is a pathway-intrinsic homeostatic mechanism that restricts excessive TLR- or NLR-mediated inflammatory signaling, our findings shed new light on how the ATG16L1T300A polymorphism sets the stage for the occurrence of Crohn disease.Abbreviations: 3-MA: 3-methyladenine; ATG16L1: autophagy related 16 like 1; ATG7: autophagy related 7; BMDM: bone marrow-derived macrophage; CD: Crohn disease; CXCL: C-X-C motif chemokine ligand; IBD: inflammatory bowel disease; iBMDM: immortalized mouse BMDM; IL1B/IL-1β: interleukin 1 beta; IL6: interleukin 6; KI: knockin; KO: knockout; MAP1LC3/LC3: microtubule associated protein 1 light chain 3; LPS: lipopolysaccharide; MDP: muramyl dipeptide; MEF: mouse embryonic fibroblast; NFKB/NF-κB: nuclear factor kappa B; NFKBIA/IKBA: NFKB inhibitor alpha; NLR: NOD-like receptor; NOD: nucleotide-binding oligomerization domain containing; RIPK2: receptor interacting serine/threonine kinase 2; SNP: single nucleotide polymorphism; SQSTM1/p62: sequestosome 1; TLR: toll like receptor; TNF/TNF-α: tumor necrosis factor; TRAF6: TNF receptor associated factor 6; Ub: ubiquitin; WT: wild type.

Keywords: ATG16L1T300A; NFKB; NLR; TLR4; autophagy.


Conflict of interest statement

No potential conflict of interest was reported by the author(s).

Figures

Figure 1.
Figure 1.
Human macrophages and mouse cells bearing the Crohn disease–associated ATG16L1T300A variant exhibit enhanced pro-inflammatory responses. (A-B) Expression of CXCL1, IL1B, and IL6 in the human monocyte-derived macrophages obtained from WT and ATG16L1T300A donors (WT: n = 10; ATG16L1T300A/WT: n = 8; ATG16L1T300A/T300A: n = 8) treated for 3 h in vitro with LPS (A) or MDP (B). Each symbol represents an individual donor; (C-D) Expression of the chemokines and cytokines in the MEF cells obtained from WT and Atg16l1T300A/T300A KI mice treated with LPS, MDP, C12-iE-DAP for indicated times were detected by real-time PCR (C) and ELISA (D); (E-F) Expression of the chemokines and cytokines in the BMDM cells obtained from WT and Atg16l1T300A/T300A KI mice treated as in (C) and (D) were assessed by real-time PCR (E) and ELISA (F). p-values were determined using one-way ANOVA followed by Tukey’s multiple-comparisons test (A-F). *p < 0.05. **p < 0.01. ***p < 0.001.
Figure 2.
Figure 2.
Enhanced TLR and NLR responses in human and mouse ATG16L1T300A/T300A KI cells are mediated by NFKB activation. (A-B) Human monocyte-derived macrophages from WT and ATG16L1T300A donors were treated with LPS (A) or MDP (B) for 1 h after which whole cell extracts were obtained and subjected to immunoblot analysis with anti-p-NFKBIA, anti-NFKBIA, and anti-ACTB/β-actin. (C-D) WT and Atg16l1T300A/T300A KI MEFs (C) or BMDMs (D) were treated with LPS, MDP, or C12-iE-DAP after which whole cell extracts were obtained and subjected to immunoblot analysis with anti-p-NFKBIA, anti-NFKBIA, and anti-ACTB. (E) WT and Atg16l1T300A/T300A KI BMDMs were treated with LPS or MDP and then subjected to immunofluorescent staining to detect RELA/p65 translocation from the cytosol to the nuclear (RELA/p65, green; DAPI, blue). Scale bar: 25 µm. (F) Quantitative assessment of the percentage of cells with RELA/p65 translocation in (E); at least 100 cells in 3 random fields were assessed. Numbers underneath the blot (A-D) represent the fold change of p-NFKBIA intensity compared with ACTB. p-values were determined using one-way ANOVA followed by Tukey’s multiple-comparisons test (F). *p < 0.05. **p < 0.01.
Figure 3.
Figure 3.
Upregulated NFKB activation and pro-inflammatory cytokine production in ATG16L1T300A/T300A KI cells are autophagy dependent. (A) BMDMs from WT, Atg16l1T300A/T300A KI, atg16l1 KO mice were treated with LPS, MDP, or C12-iE-DAP for 1 h after which whole cell extracts of the treated cells were obtained and subjected to immunoblot analysis with anti-p-NFKBIA, anti-NFKBIA, and anti-ACTB. Numbers underneath the blot represent the fold change of p-NFKBIA intensity compared with ACTB. (B) BMDMs from WT, atg16l1 KO, Atg16l1T300A/T300A KI mice were treated as in A and then subjected to immunofluorescent staining to detect RELA/p65 translocation (RELA/p65, green; DAPI, blue). Scale bar: 25 µm. (C) Quantitative assessment of the percentage of the cells with RELA/p65 translocation in (B); at least 100 cells in 3 random fields were assessed. (D-E) MEFs from WT mice were pretreated with 3-MA (D) or rapamycin (E) for 16 h and then treated with LPS (left) or MDP (right) after which the cells were subjected to immunoblot analysis to assess p-NFKBIA, NFKBIA; ACTB as a loading control. Numbers underneath the blot represent the fold change of p-NFKBIA intensity compared with ACTB. (F) Heat map of Atg16l1 KI-LPS vs. KO-LPS or Atg16l1 KI-MDP vs. KO-MDP regulated genes. (G) Real-time qPCR of selected pro-inflammatory genes identified in RNA-seq. p-values were determined using two-way ANOVA followed by Bonferroni post hoc test (C and G). *p < 0.05. **p < 0.01. ***p < 0.001.
Figure 4.
Figure 4.
Accumulation of ubiquitinated TRAF6 and RIPK2 in Atg16l1T300A/T300A KI cell upon TLR4 and MDP stimulation. (A-B) Raw cells were pretreated with 3-MA (A) or rapamycin (B) for 16 h and then cultured with LPS for 1 h; extracts of the cells were then subjected to immunoprecipitation with anti-TRAF6 followed by immunoblotting with anti-TRAF6, anti-Ub, and anti-ACTB. (C-D) Raw cells were pretreated with 3-MA (C) or rapamycin (D) for 16 h and then cultured with MDP for 1 h; extracts of the cells were then subjected to immunoprecipitation with anti-RIPK2 followed by immunoblotting with anti-RIPK2, anti-Ub, and anti-ACTB. (E-F) BMDMs from WT, atg16l1 KO, and Atg16l1T300A/T300A KI mice were treated with LPS (E) or MDP (F) for 1 h; extracts of the cells were then subjected to immunoprecipitation with anti-TRAF6 (E) or anti-RIPK2 (F) followed by immunoblotting with anti-TRAF6 (E) or anti-RIPK2 (F), anti-Ub, and anti-ACTB.
Figure 5.
Figure 5.
The autophagy receptor SQSTM1/p62 interacts with RIPK2 or TRAF6 and augments RIPK2 or TRAF6 polyubiquitination and NFKB activation. (A-B) HEK293T cells were co-transfected with SQSTM1/p62, TRAF6 (A) or RIPK2 (B) plasmids as well as an NFKB luciferase reporter plasmid and cultured for 24 h; the cells were then assessed for NFKB activity by luciferase assay. (C-D) HEK293T cells were co-transfected with HA-Ub, SQSTM1/p62, and FLAG-TRAF6 or FLAG-RIPK2 plasmids and cultured for 24 h; cell extracts were then obtained and subjected to immunoprecipitation with anti-FLAG and immunoblotting with anti-Ub, anti- SQSTM1/p62, and anti-FLAG. (E-F) WT BMDMs were stimulated with LPS (E) or MDP (F) for 1 h following which cell extracts were obtained and subjected to immunoprecipitation with anti-TRAF6 (E) or anti-RIPK2 (F) or IgG and immunoblotting with anti-TRAF6 (E) or anti-RIPK2 (F), anti-SQSTM1/p62 and anti-ACTB. (G-H) BMDMs from WT, atg16l1 KO, and Atg16l1T300A/T300A KI mice were stimulated with LPS (G) or MDP (H) for 1 h following which cell extracts were obtained and subjected to immunoprecipitation with anti-SQSTM1/p62 and immunoblotting with anti-TRAF6 (G) or anti-RIPK2 (H), anti-SQSTM1/p62 and anti-ACTB. Numbers underneath the blot represent the fold change of indicated band intensity compared with ACTB. Values are depicted as mean ± SD. P values were determined using one-way ANOVA followed by Tukey’s multiple-comparisons test (A). *p < 0.05. **p < 0.01.
Figure 6.
Figure 6.
Sqstm1/p62 deletion in autophagy-deficient cells normalizes ubiquitination of TRAF6, RIPK2, and NFKB activation. (A-B) WT, atg16l1 KO, atg16l1 sqstm1 DKO Raw cells were treated with LPS (A) or MDP (B) for 1 h; cell extracts were then obtained and subjected to immunoprecipitation with anti-TRAF6 (A) or anti-RIPK2 (B) and immunoblotting with anti-TRAF6 (A) or anti-RIPK2 (B), anti-Ub and anti-ACTB. (C) WT, atg16l1 KO, atg16l1 sqstm1 DKO Raw cells were treated with LPS or MDP for 1 h; cell extracts were then obtained and subjected to immunoblotting with anti-p-NFKBIA, anti-NFKBIA, anti-ACTB. Numbers underneath the blot represent the fold change of p-NFKBIA intensity compared with ACTB. (D) WT, atg16l1 KO, Atg16l1 sqstm1 DKO Raw cells were treated as in (C) and then subjected to immunofluorescent staining and confocal microscopy to detect RELA/p65 translocation (RELA/p65, green; DAPI, blue). Scale bar: 25 µm. (E) Quantitative assessment of the percentage of the cells with RELA/p65 translocation in (D); at least 100 cells in 3 random fields were assessed. P values were determined using two-way ANOVA followed by Bonferroni post hoc test (E). *p < 0.05. **p < 0.01.

References

    1. Hampe J, Franke A, Rosenstiel P, et al. A genome-wide association scan of nonsynonymous SNPs identifies a susceptibility variant for Crohn disease in ATG16L1. Nat Genet. 2007;39(2):207–211. - PubMed
    1. Rioux JD, Xavier RJ, Taylor KD, et al. Genome-wide association study identifies new susceptibility loci for Crohn disease and implicates autophagy in disease pathogenesis. Nat Genet. 2007;39(5):596–604. - PMC - PubMed
    1. Murthy A, Li Y, Peng I, et al. A Crohn’s disease variant in Atg16l1 enhances its degradation by caspase 3. Nature. 2014;506(7489):456–462. - PubMed
    1. Lassen KG, Kuballa P, Conway KL, et al. Atg16L1 T300A variant decreases selective autophagy resulting in altered cytokine signaling and decreased antibacterial defense. Proc Natl Acad Sci U S A. 2014;111(21):7741–7746. - PMC - PubMed
    1. Eriguchi Y, Nakamura K, Yokoi Y, et al. Essential role of IFN-gamma in T cell-associated intestinal inflammation. JCI Insight. 2018;3(18). DOI:10.1172/jci.insight.121886. - DOI - PMC - PubMed

Publication types

MeSH terms