. 2022 Feb;3(2):173-187.
doi: 10.1038/s43018-022-00336-7. Epub 2022 Feb 24.

Radiation exposure elicits a neutrophil-driven response in healthy lung tissue that enhances metastatic colonization

Affiliations

Radiation exposure elicits a neutrophil-driven response in healthy lung tissue that enhances metastatic colonization

Emma Nolan et al. Nat Cancer. 2022 Feb.

Erratum in

Abstract

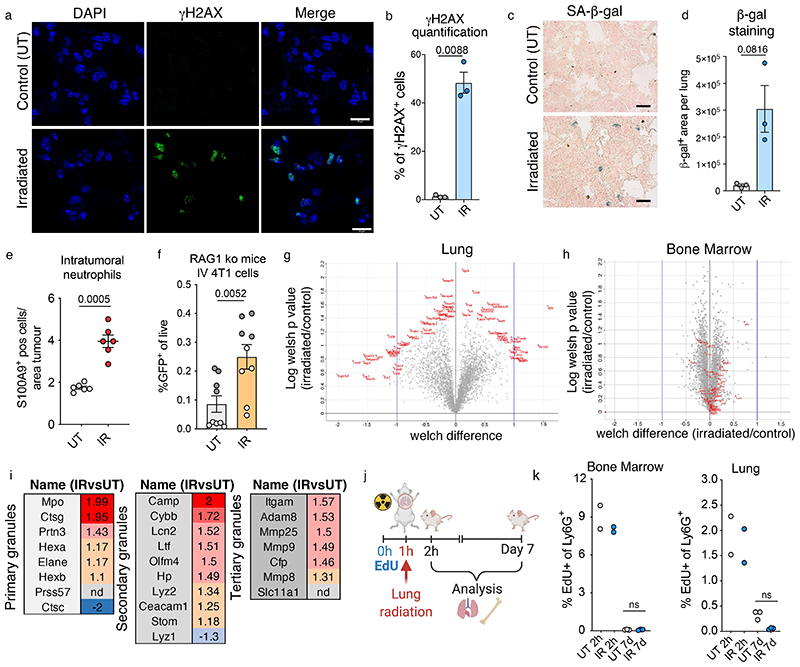
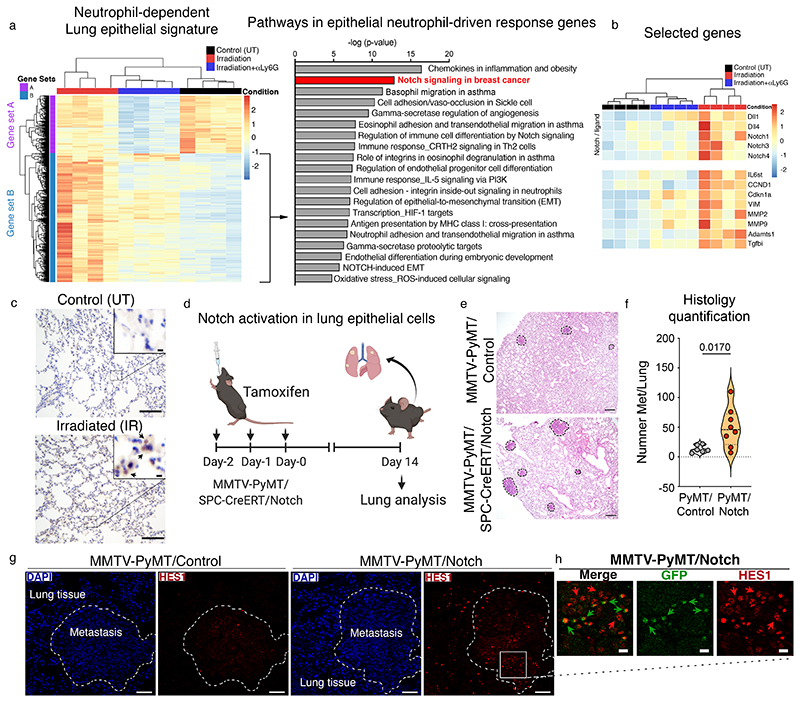
Radiotherapy is one of the most effective approaches to achieve tumor control in cancer patients, although healthy tissue injury due to off-target radiation exposure can occur. In this study, we used a model of acute radiation injury to the lung, in the context of cancer metastasis, to understand the biological link between tissue damage and cancer progression. We exposed healthy mouse lung tissue to radiation before the induction of metastasis and observed a strong enhancement of cancer cell growth. We found that locally activated neutrophils were key drivers of the tumor-supportive preconditioning of the lung microenvironment, governed by enhanced regenerative Notch signaling. Importantly, these tissue perturbations endowed arriving cancer cells with an augmented stemness phenotype. By preventing neutrophil-dependent Notch activation, via blocking degranulation, we were able to significantly offset the radiation-enhanced metastases. This work highlights a pro-tumorigenic activity of neutrophils, which is likely linked to their tissue regenerative functions.


Conflict of interest statement

Competing Interests Statement:

The authors’ declare no competing interests.

Figures

Extended Data Fig. 1
Extended Data Fig. 1. Radiation exposure in healthy lung tissue enhances metastasis.
a, Representative H&E images of metastatic lungs from control (UT) and irradiated BALB/c mice orthotopically injected with 4T1 breast cancer cells to generate a primary tumour. The metastatic area is depicted with a dashed line (n=4 mice per group, 2 independent experiments). Scale bar, 250 μm. b,c, FACS quantification of GFP+ tumour cells in the metastatic lung (b) and primary tumour volume (c) from control and irradiated mice (n=4 mice per group, one experiment). d,e, Representative H&E images (d) and FACS quantification of GFP+ tumour cells (e) from metastatic lungs from control (UT) or irradiated FVB mice intravenously injected with GFP+ MMTV-PyMT primary mammary tumour cells at day 7 (n=5 per group, one experiment). Scale bar, 100 μm. f, Table and representative immunostaining of human-specific Lamin A/C to detect human lung cancer cells growing in BALB/c Nude mice (n=4 mice per group for each cell line tested). Mice were intravenously injected with H460 or A549 human NSCLC cells 7 days following targeted lung irradiation (or sham-irradiation for control mice) and lungs harvested 3 weeks later. The table depicts the number of mice in which h-Lamin A/C+ cancer cells were present in the lungs. No foci were detected in control mice from either experimental group. The representative images show an example of a LaminA/C+ metastatic foci within an irradiated lung, for each cell line. The H460 metastatic lesion (left) is indicated with the arrow. Scale bar, 250 μm. g, Violin plot showing the number of metastatic foci in the non-irradiated left lung lobe from mice that received image-guided targeted radiation to the right lung (n=5 for 8Gy mice; n=7 for 12Gy mice), compared with control mice (n=6). The violin plot displays the median, 25th and 75th percentiles as well as the density of data points. Dots represent individual mice. All data represented as mean ± s.e.m. Statistical analysis by non-parametric two-tailed Mann-Whitney test for (b), (c) and (e) and a one-way ANOVA with multiple comparisons for (g). UT, untreated. IR, irradiated. Gating strategies for FACS analysis provided in Extended Data Fig. 2. Histology quantification process outlined in Supplementary File 1. Source data.
Extended Data Fig. 2
Extended Data Fig. 2. FACS gating strategy.
a-c, Example of FACS gating strategy to determine the frequency of (a) GFP+ cancer cells or (b) Ly6G+ neutrophils in the lung tissue of control/irradiated mice, or (c) Lineage/EpCAM+ epithelial cells in the irradiated metastatic niche (Cherry-labelled, left), or unlabelled distant lung (Cherry-negative, right). All samples were gated to exclude debris and doublets, followed by live cell discrimination by DAPI staining. All gates were set based on fluorescence-minus-one (FMO) controls, containing all antibodies minus the one of interest, to determine the background signal. Importantly, lung tissue displays a high level of autofluorescence, which needs to be considered when excluding dead cells (an FMO-DAPI is critical for this).
Extended Data Fig. 3
Extended Data Fig. 3. Radiation exposure induces lung perturbations including neutrophil infiltration and activation.
a,b, Representative immunofluorescent images (a) and quantification (b) of phospho-Histone H2A.X (Ser139) (green) and DAPI (blue) stained lungs from control/irradiated mice, 7 days post-irradiation (n=3 mice per group, one experiment). Scale bar, 10 μm. 6 fields of view were quantified per mouse. c,d, Representative images of senescence-associated β-galactosidase (SA-β-gal) staining on lung cryosections (c) and quantification (d) from control/irradiated mice, 7 days post-irradiation (n=3 mice per group, one experiment). Scale bar, 25 μm. e, Quantification of immunostaining for S100A9+ neutrophils in metastases from control and irradiated lungs at day 14 (7 days post-IV, Figure 1d) (n=6 mice per group, 2 independent experiments). The number of neutrophils within the metastatic area was normalised to tumour area. f, FACS quantification of GFP+ cancer cells in control/irradiated lungs from RAG1-ko mice at day 14 (7 days post-IV). n=9 mice per group, two independent experiments, grey dots C57BL/6J and white dots FVB background. g,h, Volcano plots showing protein expression from irradiated versus control lung (g) and bone marrow (h) neutrophils. A selection of differentially expressed proteins in the lung are depicted in red, with the same proteins shown in bone marrow samples (n=3 mice per group). i, Table of granule proteins within primary, secondary or tertiary granules with their fold change in irradiated lung neutrophils (IR) vs untreated control (UT). Nd = not detected. Highly enriched proteins are highlighted in red. j, Mice received an intraperitoneal EdU injection (25 mg/kg) 1h prior to lung irradiation. Lungs/bone marrow were harvested 1h or 7 days later, and EdU incorporation assessed by FACS. k, EdU incorporation in Ly6G+ neutrophils from bone marrow (left) and lungs (right) from control (UT) and irradiated (IR) mice (n=2 control/irradiated mice at 2h, n=3 control/irradiated mice at day 7). A representative of two independent experiments is shown (total for both experiments n=5 control/irradiated at 2h,, n=6 control/irradiated mice at day 7) All data represented as mean ± s.e.m. Statistical analysis by two-tailed t-test with Welch’s correction for (d) and (e), two-tailed non-parametric Mann-Whitney test for (f) and (k) and one-sample t-test (for value different from 2) for (b). UT, untreated; IR, irradiated. FACS gating strategies provided in Extended Data Fig. 2. Source data.
Extended Data Fig. 4
Extended Data Fig. 4. Radiation-primed neutrophil fuel metastatic growth independently of NETosis and extravasation.
a, Experimental setup. Irradiated mice were given daily injections of an anti-Ly6G neutrophil depletion antibody or IgG control, beginning the day before an IV injection of 4T1-GFP+ cancer cells. Mice were collected 72h post-IV. b,c, Frequency of Ly6G+ neutrophils (b) and GFP+ cancer cells (c) among live cells by FACS (n=7 mice per group, 2 independent experiments). d, Representative immunofluorescent images of myeloperoxidase (MPO, green), citrullinated histone-H3 (Cit-H3, red) and DAPI (blue) stained lungs at 2h, 24h and 7 days post-irradiation (n=3 mice per group, each timepoint). The positive control represents lung tissue from a mouse infected intratracheally with C.albicans and harvested 24h later. Scale bar, 100 μm. e, Schematic of 3D co-cultures. GFP+MMTV-PyMT cancer cells were seeded in Alvetex™ Scaffold 96-well plates with MACS-sorted Ly6G+ neutrophils from control or irradiated mice, harvested 7 days after irradiation. f, GFP signal quantification. Cancer cell growth on the scaffold is shown as the fold change compared to cancer cells alone (n=3 mice, each with at least 3 technical replicates, see methods). g, Schematic of GFP+MMTV-PyMT cancer cell proliferation in 2D co-culture with MACS-sorted Ly6G+ lung neutrophils from control (UT) or irradiated mice, harvested 7 days after irradiation (n=6 mice per group). Cells were treated with EdU (20 μM) and incorporation was assessed by FACS 6h later. h, Quantification of EdU+ cells among GFP+ cancer cells. PyMT cancer cells co-cultured with neutrophils isolated from control (UT) or irradiated (IR) lungs (n=6 mice per group) were compared to PyMT cells cultured alone (n=2 replicates). All data represented as mean ± s.e.m. Statistical analysis by one-way ANOVA for (b) and (c), two-way ANOVA for (f) and an unpaired two-tailed t-test for (h). UT, untreated; IR, irradiated; NT, neutrophils. Gating strategies for FACS analysis provided in Extended Data Fig. 2. Source data.
Extended Data Fig. 5
Extended Data Fig. 5. Recombinant G-CSF treatment permits controlled neutrophil recruitment.
a, Experimental setup for rG-CSF time course. Mice were given a subcutaneous injection of rGCSF every second day for a total of 4 doses, beginning the day before irradiations. On day 0, 2, 4, 6, 7 and 8, a blood sample was taken from each mouse to quantify Ly6G+ neutrophils. Mice were harvested at day 8. b, FACS analysis of Ly6G+CD11b+ neutrophils among CD45+ cells in the blood (n=6 mice per group). The day of rGCSF injections is depicted in blue and indicated by an arrow. The day of irradiation (day 0), the day of cancer cell injection (day 7) and the day of lung seeding (day 8) are indicated. Each dot represents an individual mouse, treated with either rGCSF (blue dots) or PBS (black dots). IV, intravenous; rG-CSF, recombinant G-CSF; ko, knock-out. Source data.
Extended Data Fig. 6
Extended Data Fig. 6. Primed neutrophils influence the lung epithelial cell response to radiation-induced injury.
a, Principle Component Analysis (PCA) of Lin-EpCAM- mesenchymal cell signatures following RNA-seq analysis of control, irradiated and neutrophil-depleted irradiated lungs. Each dot represents an individual mouse, ovals enclose samples from each group to highlight their similarity in the PCA plot (n=4 mice per group). b,c, 3D co-culture of GFP+MMTV-PyMT+ cancer cells on Alvetex™ Scaffolds with EpCAM+ lung epithelial cells Isolated from control (UT), irradiated (IR) and neutrophil-depleted irradiated (IR + α-Ly6G) mice, 7 days after irradiation with (b) showing GFP signal quantification at day 4, normalised to cancer cell growth alone and (c) displaying representative images of GFP intensity at day 4 (n=9 mice total per group, 3 independent experiments). Each dot in (b) represents the average of n=3 mice for an independent experiment, with at least 3 technical replicates quantified per mouse in each experiment. Scale bar, 400 μm. d,e, 3D culture of GFP+EpCAM+ epithelial cells to assess survival on the scaffold, with (d) showing representative images of GFP intensity on the scaffold at day 4 (n=3 mice per group, at least 3 technical replicates per mouse) and (e) showing GFP signal quantification (n=3 mice per group, at least 3 technical replicates per mouse). Each dot represents an individual mouse. GFP+EpCAM+ cells were sorted from the lungs of control, irradiated and neutrophil-depleted irradiated actin-GFP mice 7 days after irradiation, and seeded in Alvetex™ Scaffolds. f, Heatmap of Lin-EpCAM- mesenchymal cells from control, irradiated and neutrophil-depleted irradiated lungs (hierarchically clustered samples in columns and genes in rows) (n=4 mice per group). All data represented as mean ± s.e.m. Statistical analysis by oneway ANOVA for (b). UT, untreated; IR, irradiated; Ep, epithelial. Source data.
Extended Data Fig. 7
Extended Data Fig. 7. Radiation-induced Notch signalling in the lung environment is boosted by the presence of neutrophils.
a, Representative images and quantification of immunofluorescent staining for the Notch Intracellular Domain (NCID) in irradiated EpCAM+ lung epithelial cells that were MACS-sorted and seeded on coverslips. Cells were harvested at day 7 from irradiated mice that were treated daily with an anti-Ly6G neutrophil depletion antibody or an IgG control antibody. Cells were quantified using CellProfiler, each dot represents the intensity of nuclear NCID staining in an individual cell (n=130 IgG cells, n=205 α-L·y6G cells, see methods). n=3 mice per group, 3 technical replicates quantified per mouse. Scale bar, 5 μm. b, Quantitative RT-PCR validation of differentially-expressed genes identified by RNA-sequencing in sorted Lin-EpCAM+ lung epithelial cells. Lungs were harvested from an independent cohort of control, irradiated and neutrophil-depleted irradiated mice (n=3 mice per group). c, Quantitative RT-PCR expression of Notch genes in sorted CD31+ lung endothelial cells from control, irradiated and neutrophil-depleted irradiated mice (n=4 mice per group). Gapdh was used as a housekeeper gene for normalisation in (b) and (c). All data represented as mean ± s.e.m. Statistical analysis by unpaired two-tailed t-test for (a) and one-way ANOVA for (b) and (c). UT, untreated; IR, irradiated; Ep, epithelial. Source data.
Extended Data Fig. 8
Extended Data Fig. 8. Radiation-exposure boosts Notch-signalling and stemness in metastatic cells.
a, Quantitative RT-PCR analysis of Notch1 and target gene Hes1 in lineage-traced lung alveolar type 2 cells from SPC-Cre-ERT2 control mice and SPC-Cre-ERT2/Rosa26NICD-IRES-GFP Notch-activated mice. Mice were administered tamoxifen by oral gavage (40 mg/kg) over three consecutive days. Lungs were harvested 14 days after the last tamoxifen dose and GFP+ cells were sorted by flow cytometry (n=3 control mice, n=4 Notch mice). b, Primary tumour weight from PyMT/Control (n=6) and PyMT/Notch mice (n=8) harvested two weeks post-tamoxifen induction. c, Quantification and representative images of Hes1 immunostaining in lung metastases from PyMT/Control (n=5) and PyMT/Notch mice (n=7) mice (metastatic lungs harvested over n=5 independent tamoxifen administrations, immunostaining quantification in methods). The enlarged inset shows nuclear localisation. Scale bar, 100 μm (main image), 10 μm (enlarged inset). d, Combined Uniform Manifold Approximation and Projection (UMAP) plot of cells from the mCherry+ niche and mCherry- distant lung from irradiated mice (n=10 mice, pooled). The expression level of EpCAM (distinguishing epithelial cells), Pdgfrα and Pdgfrβ (fibroblasts) and Pecam1(CD31) (endothelial cells) is indicated in blue. e, Representative immunostaining for RBPJ (top panel) and Hes1 (lower panel) in metastatic lungs from control, irradiated, and neutrophil-depleted irradiated mice harvested at day 14 (n=7 mice per group, 2 independent experiments). Quantification shown in Figure 6d,e. The enlarged inset shows nuclear localisation within tumour cells. Hes1+ cells are indicated by arrows. Scale bar, 100 μm (main image), 10 μm (enlarged inset). f, Representative immunostaining and quantification of RBPJ staining intensity in metastatic lungs from irradiated FVB mice pre-treated with rGCSF or PBS prior to injection of MMTV-PyMT cancer cells (Figure 3e, n=5 mice per group). Staining intensity within the metastatic area was measured using ImageJ (see methods). Scale bar, 100 μm. All data represented as mean ± s.e.m. Statistical analysis by non-parametric two-tailed Mann-Whitney test for (a), a two-tailed unpaired t-test for (b), (c) and (f). UT, untreated; IR, irradiated. The violin plot displays the median, 25th and 75th percentiles as well as the density of data points. Dots represent individual mice. Gating strategies for FACS sorting for (d) provided in Extended Data Fig. 2. Source data.
Fig. 1
Fig. 1. Radiation exposure in healthy lung tissue enhances metastasis.
a, Experimental setup. Mice received targeted 13 Gy lung irradiation prior to orthotopic breast cancer transplantation. Spontaneous lung metastatic burden was assessed at day 21. b,c, Representative H&E images (b) and FACS quantification of GFP+ tumour cells (c) from control (UT) and irradiated BALB/c mice inoculated with 4T07 low-metastatic breast cancer cells. Primary tumour volume was equivalent between groups (Extended Data Fig. 1c) (n=12 control mice, n=10 irradiated; 2 independent experiments). Metastatic area is depicted with a dashed line. Scale bar, 250 μm. d, Experimental setup for experimental metastasis. Mice received 13Gy targeted lung irradiation prior to intravenous injection of cancer cells. e,f, Representative H&E images (e) and histology quantification (f) of metastatic lungs from control (UT) and irradiated NSG mice injected with human oesophageal adenocarcinoma Flo-1 cells (n=6 mice per group, one experiment). Metastatic area is depicted with a dashed line. Scale bar, 250 μm. g, Experimental setup for fractionated irradiation. BALB/c mice received a targeted 4Gy dose of lung irradiation over three or four consecutive days. Mice were injected intravenously with 4T1 breast cancer cells 7 days after the final dose. h,i, Representative H&E images (h) and tumour area quantification (i) for control (UT) mice and irradiated mice that received 3x 4Gy or 4x 4Gy (n=5 mice per group, one experiment). Scale bar, 250 μm. j,k Experimental setup (j) and histology quantification (k) for partial lung irradiation. Image-guided radiation at 8Gy or 12Gy was used to specifically target the right lung of BALB/c mice, one week prior to an intravenous injection of 4T1 breast cancer cells. The number of metastatic lesions in the right (irradiated) versus left (non-irradiated) lung lobes was quantified by H&E (n=6 control mice; n=5 8Gy mice; n=7 12Gy mice, one experiment). All data represented as mean ± s.e.m. Statistical analysis by non-parametric two-tailed Mann-Whitney test for (c) and (f), and one-way ANOVA with multiple comparisons for (i) and (k). UT, untreated; IR, irradiated. FACS gating strategies provided in Extended Data Fig. 2. Histology quantification rationale and process is outlined in Supplementary File 1. Source data.
Fig. 2
Fig. 2. Radiation exposure induces the infiltration and local activation of lung neutrophils.
a,b, Representative H&E images of lungs (a) and S100A9 immunostaining for neutrophils (b) from control and irradiated mice at day 7 (n=6 mice per group, 2 independent experiments). Scale bars, 250 μm (a) and 100 μm (b). c, Immune cell frequencies in the lungs estimated by FACS, 7 days post-irradiation (n=7 mice per group, two independent experiments). Data is presented either as the frequency among live cells (for total CD45+ immune cells), or frequency among CD45+ cells. d,e, Representative immunofluorescent images (d) and quantification of nuclear segmentation (e) from sorted Ly6G+ lung neutrophils harvested from control and irradiated lungs at day 7 post-irradiation (n=7 mice per group, two independent experiments). DAPI staining was performed on fixed cells plated on poly-lysine coverslips (n=2 coverslips per mouse for each experiment). Each data point (n=30 UT, n=32 IR) represents the average segmentation across all cells within the field of view. Scale bars: main panel, 100 μm; enlarged insets, 10 μm. f, Experimental setup for quantitative mass-spectrometry based proteomic analysis of Ly6G+ positive cells. Cells were isolated from the lungs and from bone marrow extracted from the femur of control and irradiated BALB/c mice at day 7 by MACS sorting. g, Metacore pathway analysis of proteins upregulated by >1.2 fold in lung neutrophils from irradiated mice, compared to control mice (n=3 mice per group). h, Granule protein upregulation in the lungs of irradiated versus control mice (n=3 mice per group). Each dot represents an individual granule protein (n=24), red dots depict an enrichment in irradiated mice, blue dots represent downregulation. All data represented as mean ± s.e.m. Statistical analysis by a two-tailed t-test with Welch’s correction for (c) and unpaired two-tailed t-test for (e). Gating strategies for FACS analysis provided in Extended Data Fig. 2. Source data.
Fig. 3
Fig. 3. Primed neutrophils support metastatic colonization in irradiated lungs.
a, Experimental setup. BALB/c mice were given daily injections of an anti-Ly6G neutrophil-depletion antibody or an IgG control antibody, beginning the day before lung radiation. One week later, mice received an intravenous injection of 4T1-GFP+ breast cancer cells. b, Representative H&E images of metastatic lungs from control (UT), irradiated and irradiated mice lacking neutrophils (n=7 mice per group, 2 independent experiments). The metastatic area is depicted with a dashed line. Scale bar, 250 μm. c, Ly6G+ neutrophil frequency among live cells by FACS (n=7 mice per group, 2 independent experiments). d, Metastatic burden as quantified by H&E staining (n=7 mice per group, 2 independent experiments). Mice from the two independent experiments are represented by different coloured dots. See Supplementary File 1 for quantification process. e, Schematic showing irradiations in neutropenic FVB G-CSF ko mice. Mice were treated with recombinant GCSF (rGCSF) or PBS every other day, beginning the day before irradiations, for a total of four injections. Mice were intravenously injected with MMTV-PyMT primary breast cancer cells two days after the final rGCSF injection. f,g, Representative immunofluorescent images (f) and quantification of nuclear segmentation (g) from sorted Ly6G+ lung neutrophils harvested from control (UT) and irradiated mice 24h after the final rGCSF treatment. DAPI staining was performed on Ly6G+ cells plated on poly-lysine coverslips (n=3 mice per group, 6 technical replicates quantified per mouse). Scale bars, 10 μm. h,i Quantification (h) and representative H&E images of metastatic lungs (i) from irradiated mice treated with either PBS or rGCSF (n=11 PBS-treated, n=9 rGCSF treated mice, 2 independent experiments). Scale bar, 500 μm. Data represented as mean ± s.e.m. Statistical analysis by One way ANOVA for (c), non-parametric Kruskal-Wallis test for (d), unpaired two-tailed t-test for (g) and (h). UT, untreated; IR, irradiated; px, pixals; Ko, knock-out; rGCSF, recombinant G-CSF. Gating strategies for FACS analysis provided in Extended Data Fig. 2. Histology quantification rationale and process is outlined in Supplementary File 1. Source data.
Fig. 4
Fig. 4. Radiation-primed neutrophils perturb the lung tissue environment.
a, Experimental setup for the neutrophil adoptive transfer. Control or radiation-primed Ly6G+ lung neutrophils were MACS-sorted 7 days following irradiation and intravenously injected into naïve recipient BALB/c mice. Mice were given an intravenous injection of 4T1-GFP+ cancer cells 4 days later, and metastatic burden assessed after one week. b-d, Quantification of the entire lung (serial sectioning) (b) and representative images of GFP (c) and H&E stained lungs (d) (n=6 control, n=7 irradiated mice, two independent experiments). Metastatic foci are outlined and indicated with arrows. See methods for quantification details. Scale bar, 100 μm. e, Schematic depicting the experimental setup for bulk RNA-sequencing. BALB/c mice were given daily injections of anti-Ly6G to deplete neutrophils or a control IgG antibody, beginning the day before targeted lung irradiation. Flow cytometry was used to isolate CD45-CD31-Ter119-(Lin-)EpCAM+ lung epithelial and Lin-EpCAM- mesenchymal cells from control, irradiated and neutrophil-depleted irradiated mice 7 days post-irradiation (n=4 mice per group). f, Principle Component Analysis (PCA) of Lin-EpCAM+ epithelial cell signatures following RNA-seq analysis of control, irradiated and neutrophil-depleted irradiated lung samples. Each dot represents an individual mouse, with ovals enclosing the samples from each group to highlight their similarity in the PCA plot. g, Experimental setup for lung epithelial analysis. Lin-EpCAM+ lung epithelial cells harvested from control, irradiated and neutrophil-depleted irradiated BALB/c mice (7 days post-irradiation) were sorted by flow cytometry and co-cultured in Matrigel with MLg normal lung fibroblasts to generate lung organoids. h,i, Representative images (h) and quantification (i) of lung organoid co-cultures. Scale bar, 1000 μm. Quantification of organoid number is shown as the percentage reduction in organoids compared to the control group. Each dot represents an individual mouse, with the three independent experiments indicated by coloured dots (n=12 mice per group). Triplicate technical replicates were quantified for each mouse. Data represented as mean ± s.e.m. Statistical analysis by two-way ANOVA for (b) and non-parametric two-tailed Mann-Whitney test for (h). UT, untreated; IR, irradiation. Gating strategies for FACS sorting provided in Extended Data Fig. 2. Source data.
Fig. 5
Fig. 5. Notch is activated in the lung epithelium and enhances spontaneous metastasis.
a, Heatmap of Lin-EpCAM+ lung epithelial cells from control, irradiated and neutrophil-depleted irradiated mice (left) (hierarchically clustered samples in columns and genes in rows, n=4 mice per group), and Metacore pathway analysis (right) of the genes triggered by radiation, but influenced by neutrophils (gene set B, indicated by the arrow). b, Heatmap showing selected genes from gene set B from (a) (hierarchically clustered samples in columns and selected genes in rows). c, Representative images for Hes1 immunostaining in lung tissue from control or irradiated mice at day 7. Positive cells are indicated by arrows in the enlarged inset. Scale bar, 100 μm (main image), 10 μm (inset) (n=4 mice per group, one experiment). d, Experiment setup for genetic Notch activation. PyMT/Notch mice (MMTV-PyMT/SPC-Cre-ERT2/Rosa26NICD-IRES-GFP) or PyMT/Control mice were administered tamoxifen by oral gavage (40 mg/kg) over three consecutive days to drive Cre expression in lung alveolar cells. Lungs were harvested 14 days after the last tamoxifen dose and assessed for metastatic burden. e,f, Representative H&E stained lungs (e) and histology quantification of lung metastases (f) from PyMT/Control and PyMT/Notch mice (n=6 PyMT/control mice, n=8 PyMT/Notch mice, spontaneous metastasis assessed over n=6 independent tamoxifen administrations). Scale bar, 250 μm g, Representative immunofluorescence images from DAPI (blue) and Hes1 (red) stained lung sections from PyMT/Control (left panel, n=5) and PyMT/Notch (right, n=7) mice harvested at experimental endpoint. Lung metastases are depicted with a dashed line. Scale bar, 50 μm. h, Enlargement from (g) showing Hes1 (red) and GFP (green) immunofluorescence staining in the PyMT/Notch metastatic lesion (n=7 mice). Positive cells are indicated by arrows. Scale bar, 10 μm. All data represented as mean ± s.e.m. Statistical analysis by a two-tailed t-test with Welch’s correction for (f). The violin plot displays the median, 25th and 75th percentiles as well as the density of data points. Dots represent individual mice. UT, untreated; IR, irradiation. Histology quantification process outlined in Supplementary File 1. Source data.
Fig. 6
Fig. 6. Radiation exposure boosts Notch-signalling and stemness in metastatic cells.
a, Cherry-niche labelling tool. Irradiated BALB/c mice were intravenously injected with GFP+ 4T1-sLP-Cherry-labelling cancer cells 7 days post-irradiation. One week later, GFP-CD45-Ter119- mCherry+ (red) and GFP-CD45-Ter119-mCherry- cells (grey) were FACS-sorted from metastatic lungs, representing the labelled metastatic niche or distant lung cells, respectively. b, Combined Uniform Manifold Approximation and Projection (UMAP) plot of cells from the mCherry+ niche and mCherry- distant lung (n=10 mice, pooled). Clusters representing epithelial cells (EpCAM+), fibroblasts (Pdgfrα/β+) and endothelial cells (Pecam1(CD31)+) are outlined. c, Notch signalling (Reactome) score in irradiated Cherry+ niche (red) and Cherry- distant lung (blue) cells for the compartments in (b), calculated in VISION (methods). d,e, Quantification of RBPJ (d) and Hes1 (e) immunostaining in lung metastases from control, irradiated, and neutrophil-depleted irradiated mice at day 14 (n=7 mice per group, two independent experiments). Representative images in Extended Data Fig. 8e, quantification in methods. f, Cancer stemness assays. Metastatic lungs from control/irradiated BALB/c mice were harvested and the cell suspension plated to select for 4T1 metastatic cells (methods). The following day, equal numbers of cancer cells were plated in 2D or embedded in Matrigel. Colony/tumoroid formation was quantified after 7 days. (g) (left) Representative image of Giemsa-stained 6-well plate after seeding 1000 or 5000 cancer cells from control/irradiated lungs and (right) quantification (n=10 mice per group, 3 independent experiments). Scale bar, 1 cm. (h) (left) Representative image and (right) tumour organoid quantification (n=7 mice per group, 2 independent experiments). Scale bar, 50 μm. i,j, Quantification (i) and representative Sox9 immunostaining (j) in lung metastases from control, irradiated, and neutrophil-depleted irradiated BALB/c mice at day 14 (n=7 mice per group, two independent experiments). Scale bar, 100 μm (main), 10 μm (enlarged inset). All data represented as mean ± s.e.m. Statistical analysis by two-tailed non-parametric Mann-Whitney test for (g),one-way ANOVA for (d,e,i), and unpaired two-tailed t-test for (h). For box plots, boxes represent 25th/75th percentiles, the line represents the median and whiskers indicates the minimum/maximum values. Dots represent individual mice. UT, untreated; IR, irradiated. FACS gating strategies in Extended Data Fig. 2. Source data.
Fig. 7
Fig. 7. Radiation-primed neutrophils boost lung metastasis via their degranulation activity.
a, Schematic depicting the treatment of control and irradiated mice with the neutrophil degranulation inhibitor Nexinhib20. Control or irradiated BALB/c mice were treated with Nexinhib20 or a vehicle control 3x per week (30 mg/kg), beginning the day before irradiation. GFP+ 4T1 breast cancer cells were intravenously injected at day 7 and metastatic burden assessed at day 14. b, Lung metastatic burden in control and irradiated mice treated with Nexinhib20 or vehicle, quantified as tumour area by H&E (see Supplementary File 1) (n=6 mice per group, 2 independent experiments). c,d, Quantification of Hes1 (c) and Sox9 (d) immunostaining in metastatic lesions from (b) (n=6 mice per group, two independent experiments) e, Experimental setup of Ela2ko mouse model. Ela2ko mice or C57BL/6J wild-type littermates received a 13 Gy dose of targeted whole-lung irradiation. Mice received an intravenous injection of E0771 breast cancer cells at day 7, and lungs were harvested at day 14 to assess metastatic load. f-h, Representative H&E staining (f) quantification of metastatic number (g) and Hes1 immunostaining in metastatic lesions (h) from the irradiated lungs of Ela2ko or wild-type control mice (n=6 mice per group, one experiment), Scale bar, 250 μm. All data represented as mean ± s.e.m. Statistical analysis by one-way ANOVA for (b-d), and a two-tailed t-test for (g) and (h). CTL, control; IR, irradiated; Veh, vehicle; Nex, Nexinhib20; IV, intravenous; Ko, knock-out. Metastases quantification process outlined in Supplementary File 1, immunostaining quantification in methods. Source data.
Fig. 8
Fig. 8. Inhibition of Notch signalling attenuates the radiation-driven enhancement of metastatic growth in vivo.
a, Schematic depicting Notch signalling inhibition in vivo. Control or irradiated BALB/c mice were administered the γ-secretase inhibitor DAPT (10 mg/kg) or a vehicle control daily, beginning at the time of 4T1 cancer cell injection and continuing until the experimental endpoint one week later. b,c, Representative immunostaining for Ki67 (b) and quantification (c) of the number of Ki67+ metastatic lesions in control (UT) and irradiated mice treated with vehicle or DAPT (n=8 mice per group, two independent experiments). The quantification of Ki67+ metastatic foci is depicted as fold change, relative to the control mice treated with vehicle. Ki67+ metastatic foci are indicated with a dashed line. Scale bar, 250 μm. d, Quantification of Hes1 immunostaining in metastatic lesions from (b) (n=8 mice per group, two independent experiments) (see methods). All data represented as mean ± s.e.m. Statistical analysis by one-way ANOVA for (c), and a two-tailed t-test for (d). UT, untreated; IR, irradiated; Veh, vehicle. e, Proposed model for radiation-enhanced lung metastasis. Radiation exposure in healthy lung tissue leads to excessive neutrophil accumulation and activation, inducing an array of tissue perturbations such as Notch activation within epithelial cells. Together these alterations foster a pro-tumorigenic milieu within the irradiated lung, fuelling the subsequent growth of arriving metastatic cancer cells. Source data.

Comment in

  • Radiation sparks a dark side in neutrophils.
    Heinberg A, Granot Z. Heinberg A, et al. Nat Cancer. 2022 Feb;3(2):136-137. doi: 10.1038/s43018-021-00324-3. Nat Cancer. 2022. PMID: 35221335 No abstract available.
  • Naughty neutrophils.
    Dart A. Dart A. Nat Rev Cancer. 2022 May;22(5):258. doi: 10.1038/s41568-022-00470-5. Nat Rev Cancer. 2022. PMID: 35314809 No abstract available.

References

    1. Wirsdörfer F, Jendrossek V. The Role of Lymphocytes in Radiotherapy-Induced Adverse Late Effects in the Lung. Front Immunol. 2016;7:207–20. - PMC - PubMed
    1. Ombrato L, et al. Metastatic-niche labelling reveals parenchymal cells with stem features. Nature. 2019;572:603–608. - PMC - PubMed
    1. Vicini FA, Kestin L, Huang R, Martinez A. Does local recurrence affect the rate of distant metastases and survival in patients with early-stage breast carcinoma treated with breast-conserving therapy? Cancer. 2003;97:910–919. - PubMed
    1. Kuonen F, Secondini C, Rüegg C. Molecular pathways: emerging pathways mediating growth, invasion, and metastasis of tumors progressing in an irradiated microenvironment. Clinical cancer research: an official journal of the American Association for Cancer Research. 2012;18:5196–5202. - PubMed
    1. Bouchard G, et al. Pre-irradiation of mouse mammary gland stimulates cancer cell migration and development of lung metastases. Br J Cancer. 2013;109:1829–1838. - PMC - PubMed

Publication types