Case Reports
. 2022 Feb;3(2):232-250.
doi: 10.1038/s43018-022-00337-6. Epub 2022 Feb 24.

A human breast cancer-derived xenograft and organoid platform for drug discovery and precision oncology

Affiliations
Case Reports

A human breast cancer-derived xenograft and organoid platform for drug discovery and precision oncology

Katrin P Guillen et al. Nat Cancer. 2022 Feb.

Abstract

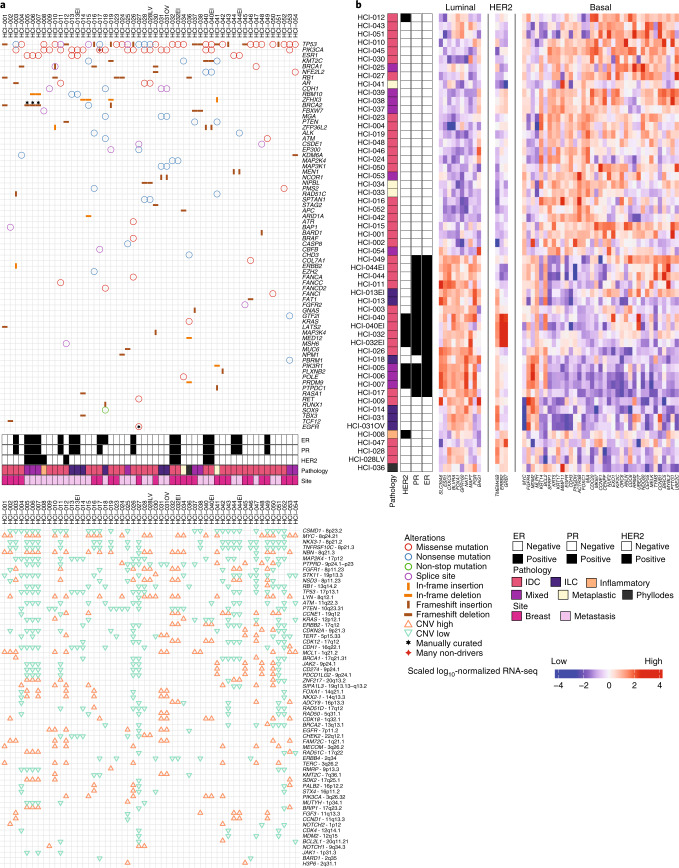
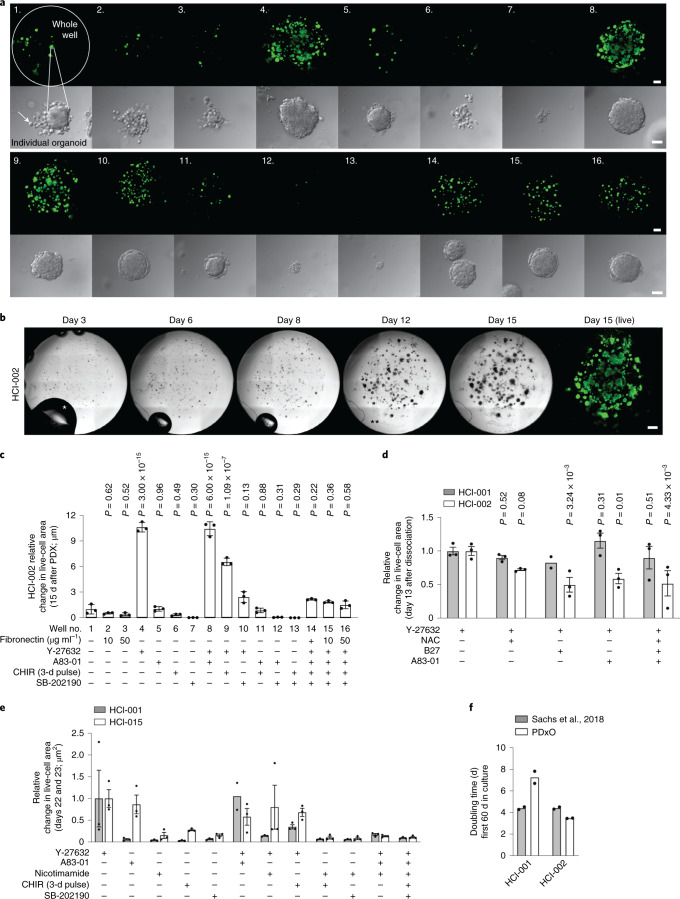
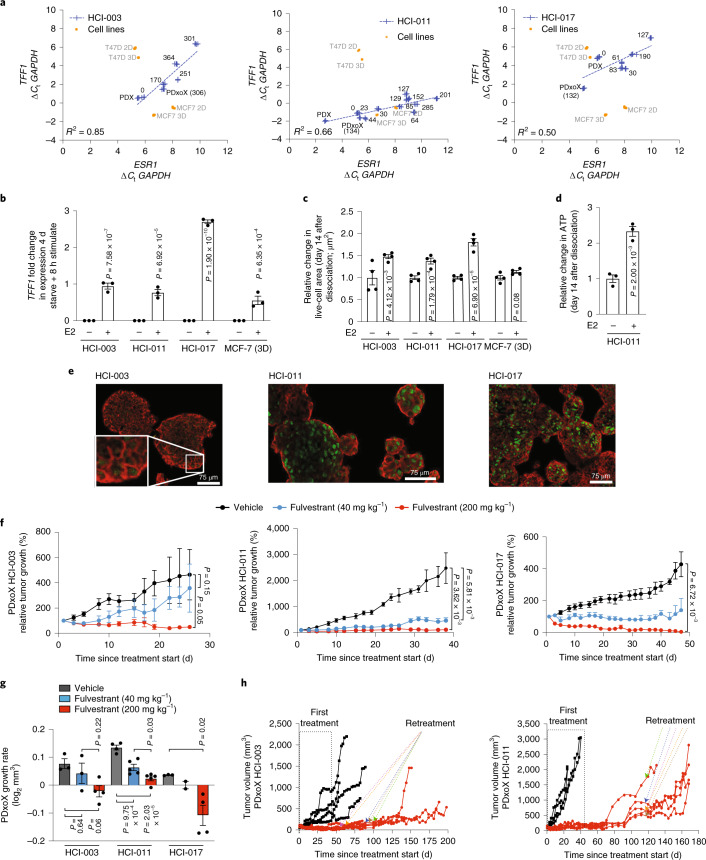
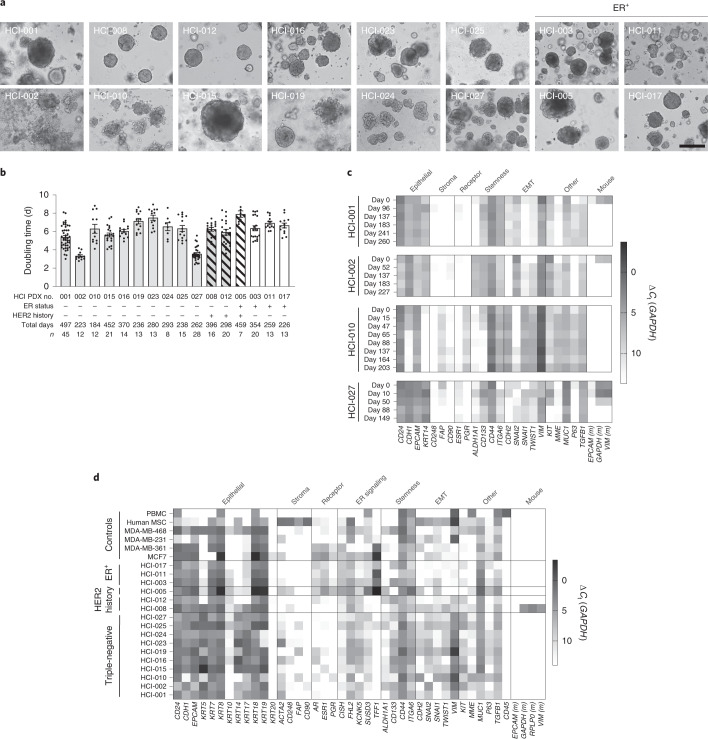
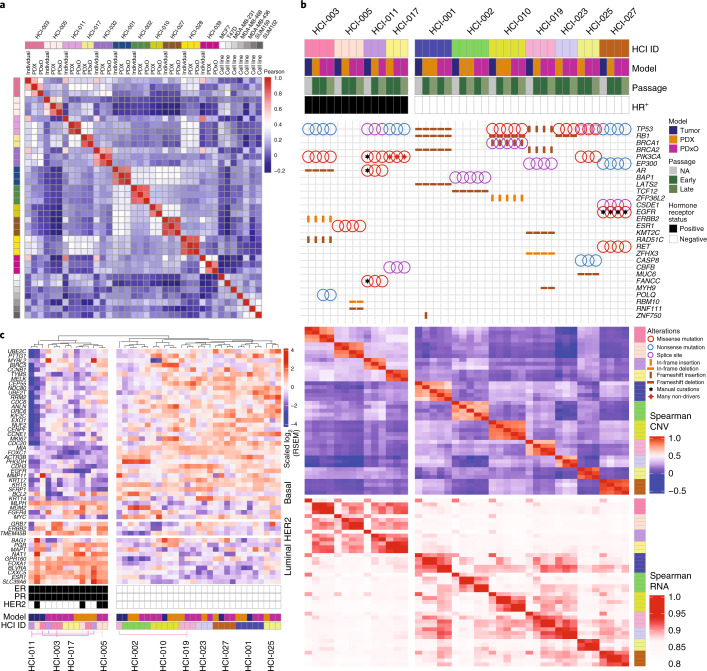
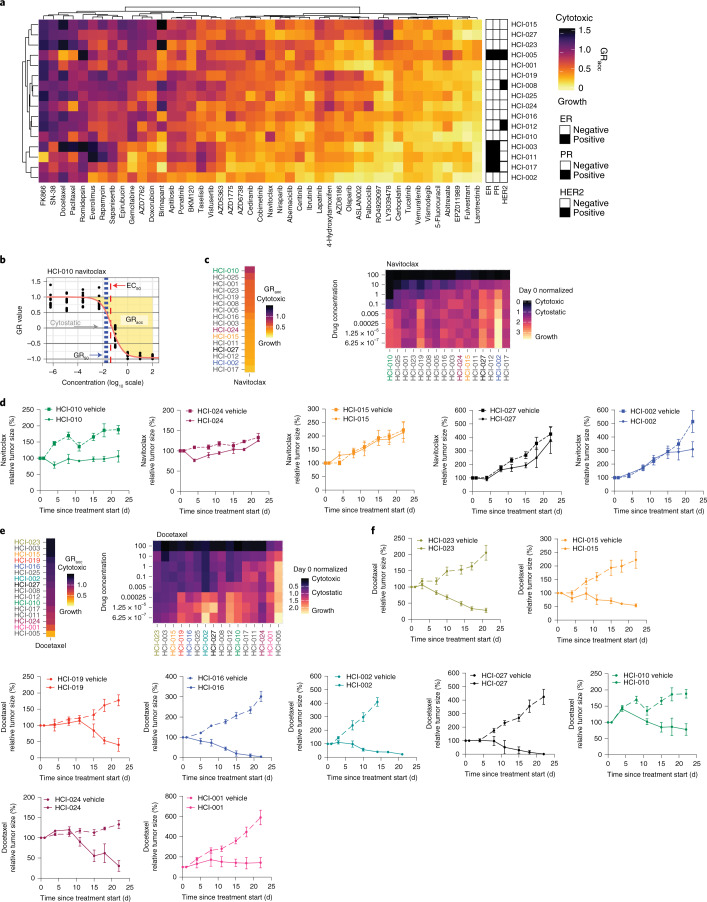
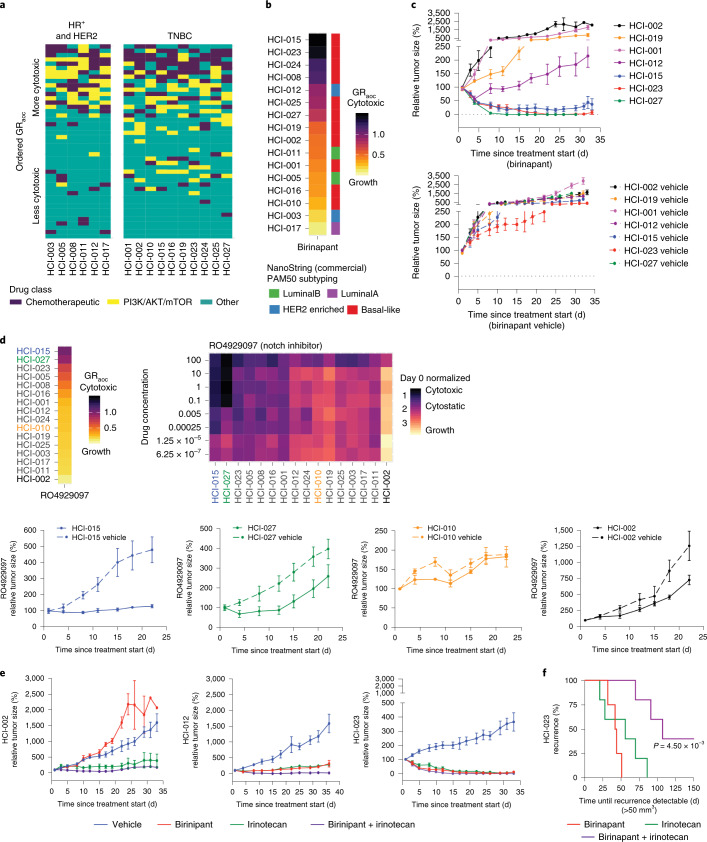
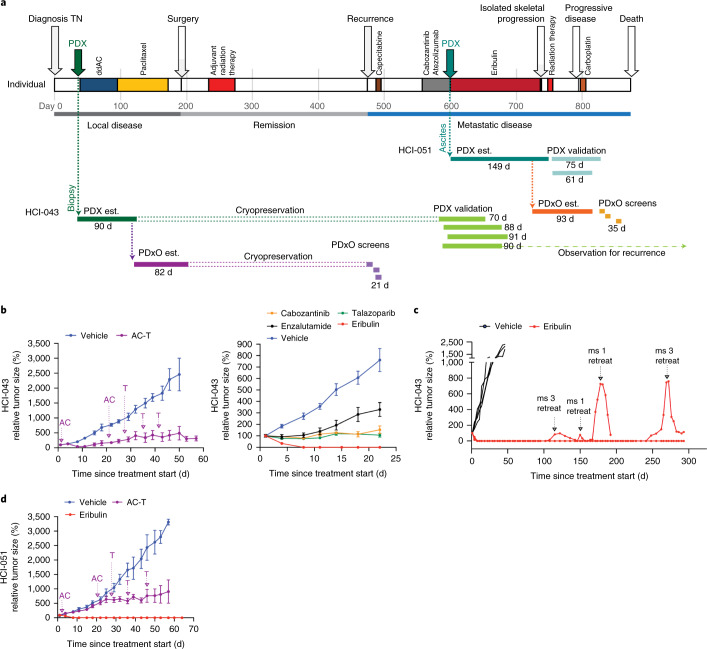
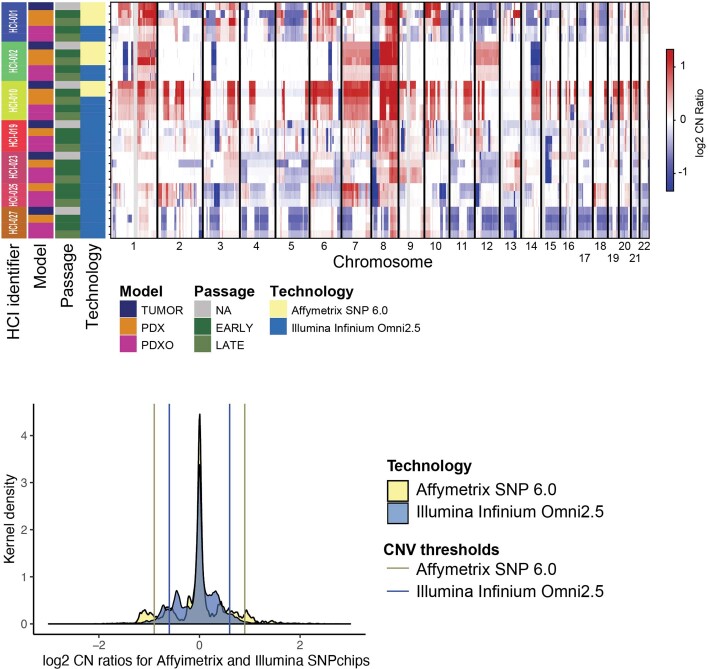
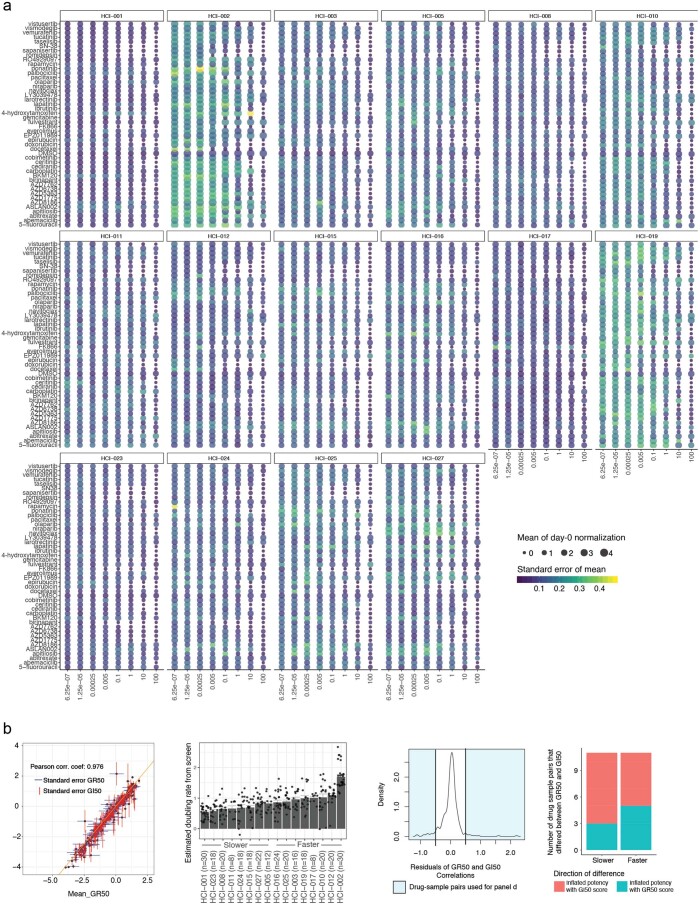
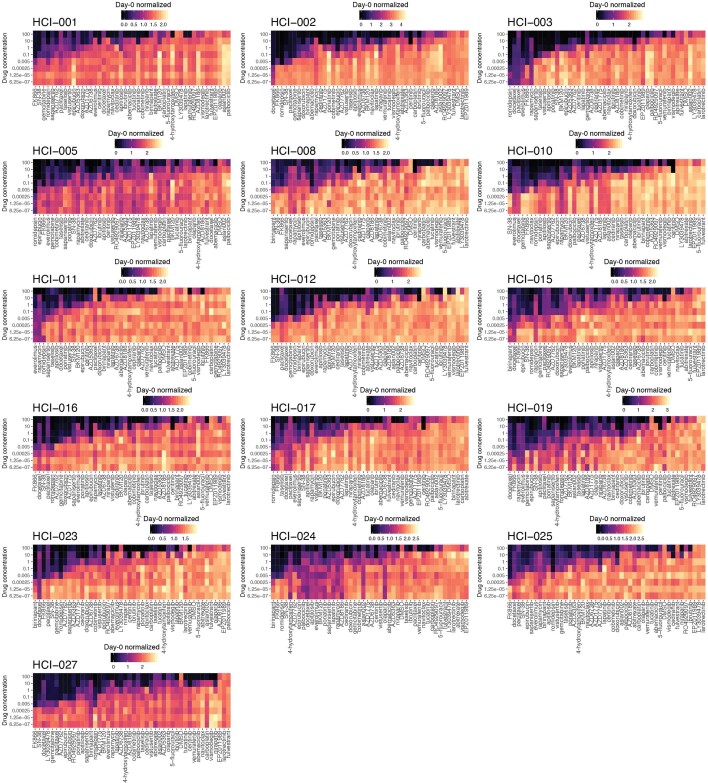
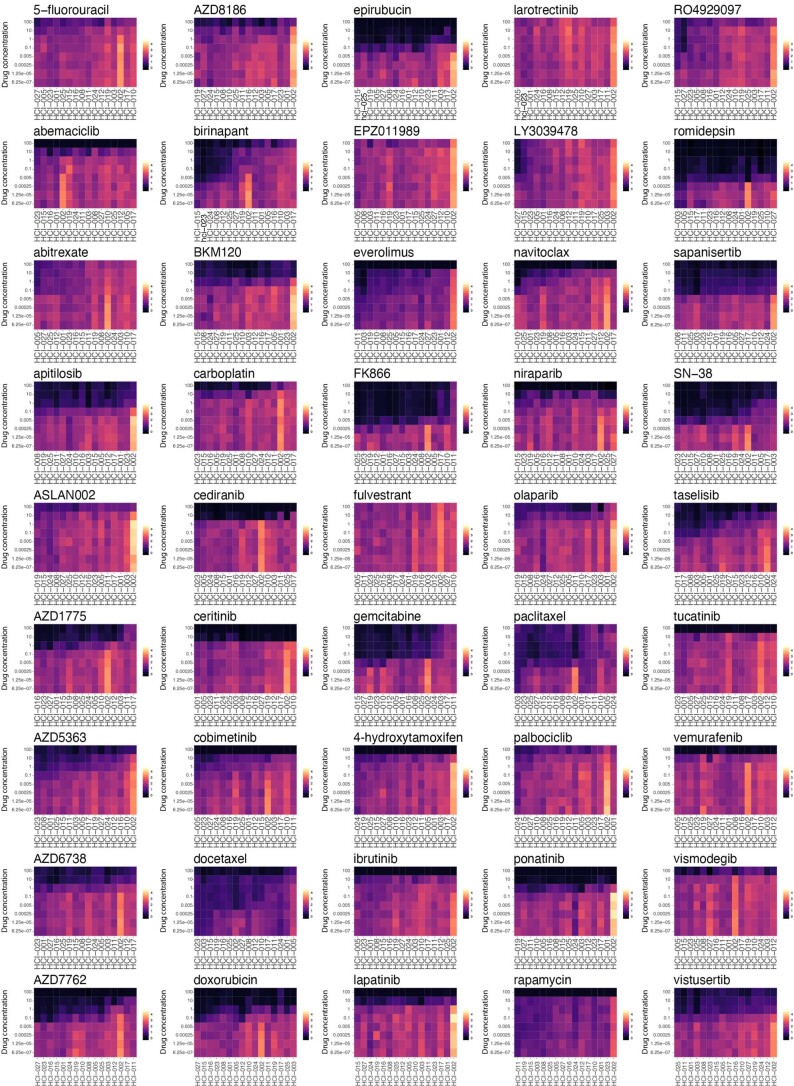
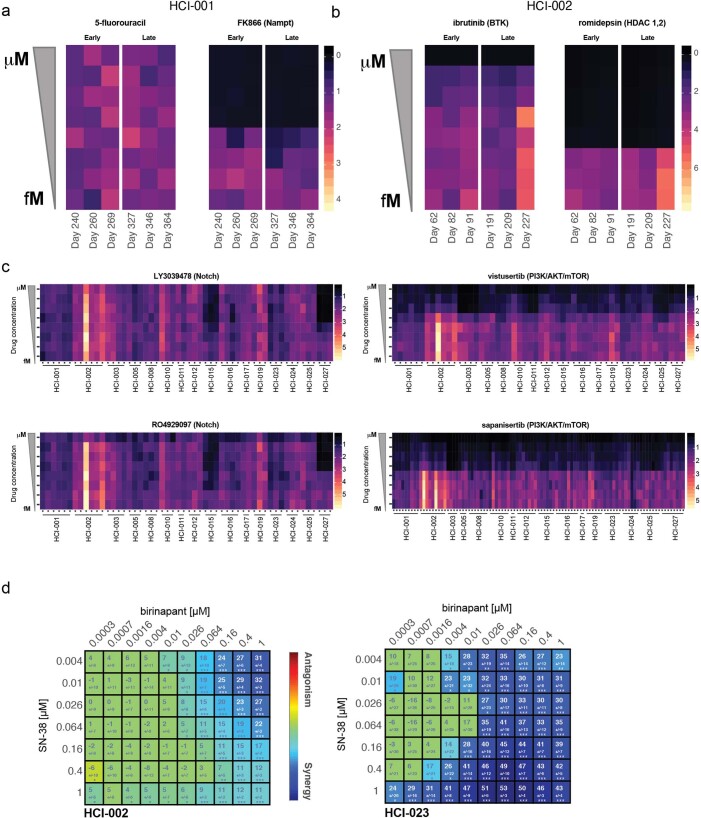
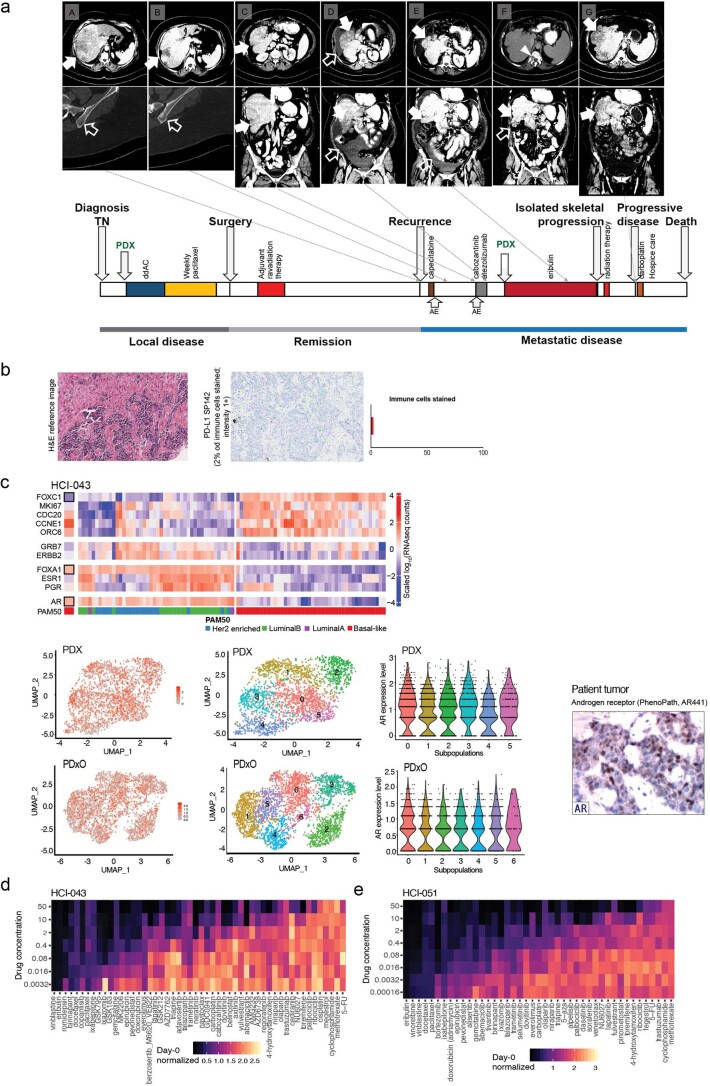
Models that recapitulate the complexity of human tumors are urgently needed to develop more effective cancer therapies. We report a bank of human patient-derived xenografts (PDXs) and matched organoid cultures from tumors that represent the greatest unmet need: endocrine-resistant, treatment-refractory and metastatic breast cancers. We leverage matched PDXs and PDX-derived organoids (PDxO) for drug screening that is feasible and cost-effective with in vivo validation. Moreover, we demonstrate the feasibility of using these models for precision oncology in real time with clinical care in a case of triple-negative breast cancer (TNBC) with early metastatic recurrence. Our results uncovered a Food and Drug Administration (FDA)-approved drug with high efficacy against the models. Treatment with this therapy resulted in a complete response for the individual and a progression-free survival (PFS) period more than three times longer than their previous therapies. This work provides valuable methods and resources for functional precision medicine and drug development for human breast cancer.


Conflict of interest statement

University of Utah may license the models described herein to for-profit companies, which may result in tangible property royalties to members of the Welm lab who developed the models (K.P.G., M.F., A.J.B., S.D.S., Z.C., Y.S.D., L.Z., E.C.-S., C.-H.Y., J.T., G.W., A.L.W. and B.E.W.). M.T.L. is a Manager in StemMed Holdings LLC, a limited partner in StemMed Ltd, and holds an equity stake in Tvardi Therapeutics. L.E.D. is a compensated employee of StemMed, Ltd. S.O. has received research support/reagents from AstraZeneca, Illumina, H3 Biomedicine and Blueprint Medicine. The other authors declare no conflicts.

Figures

Fig. 1
Fig. 1. Genomic characterization of breast cancer PDX models.
a, Top, oncoprint plot showing single-nucleotide variants and insertion–deletions (indels) for commonly mutated genes in cancer. Annotations for each model include hormone receptor (HR) status for ER and PR, HER2 status, pathology (invasive ductal carcinoma (IDC), mixed, phyllodes, invasive lobular carcinoma (ILC), inflammatory or metaplastic) and whether the sample was from the primary breast tissue or a metastatic site. Bottom, specific gene-level CN alterations are displayed. b, Unsupervised clustering of the PDX models was performed using root mean squared scaling of transcript abundance in the PAM50 gene set.
Fig. 2
Fig. 2. Optimization of PDxO culture conditions.
a, Live-cell area of entire wells (top) and brightfield images of individual organoids (bottom) representative of PDxO HCI-002 grown under 16 different conditions (experiment in c) 15 d after organoid preparation; scale bars, 500 μm (top) and 50 μm (bottom). b, Brightfield images representative of organoid growth over time in PDxO HCI-002 (from experiment in c). For day 3, the asterisk (*) identifies a bubble in the medium, which gradually disappears during culture. For day 12, the asterisks (**) identify a piece of debris, a common occurrence in the glass-bottom plates required to acquire images; scale bar, 500 μm; right, calcein AM stain to show live cells (green). c, Quantified live-cell area of HCI-002 PDxOs grown under 16 different culture conditions. Data are normalized to the control condition (well 1). One experiment was performed. Data are presented as mean ± s.e.m.; n = 3 biological replicates. Statistical comparisons to the control condition (well 1) were performed using an ordinary two-way analysis of variance (ANOVA) and uncorrected Fisher’s least significant different (LSD) test with single pooled variance. CHIR, CHIR-99021. d, Effect of various culture additives on cell viability 13 d after first dissociation for PDxOs HCI-001 and HCI-002. Data are presented as mean ± s.e.m.; n = 3 biological replicates (n = 2 biological replicates for HCI-001 Y-27632 + B27). Statistical comparisons to the control condition (+Y-27632) were performed within each line by ordinary two-way ANOVA and uncorrected Fisher’s LSD with single pooled variance. e, Effects of culture additives on cell viability for other TNBC PDxO lines, HCI-001 and HCI-015. Data are presented as mean ± s.e.m.; n = 3 biological replicates (n = 2 biological replicates for HCI-001 Y-27632 + A83-01). f, Comparison of doubling times during the first 60 d of culture to previously published organoid growth conditions; n = 2 biological replicates. Source data
Fig. 3
Fig. 3. Estrogen pathway integrity in ER+ PDxOs.
a, Expression of ESR1 and TFF1 in PDxOs HCI-003, HCI-011 and HCI-017 compared to PDX, PDxoX or MCF7 and T47D cells cultured in 2D or 3D for 6 d. Numbers represent total days in culture. Data are normalized to GAPDH and represent n = 4 technical replicates; Ct, threshold cycle. b, TFF1 expression in HCI-003, HCI-011 and HCI-017 PDxOs and 3D cultures of MCF7 cells stimulated with E2 for 8 h after 4 d in phenol red-free medium with charcoal-stripped FBS. Data are normalized to GAPDH and the no E2 condition. Data are presented as mean ± s.e.m.; n = 3 biological replicates. Statistical comparisons within each line were performed using an ordinary two-way ANOVA and uncorrected Fisher’s LSD with individual variances computed from each comparison. c, Live-cell area under the same conditions as b. Data are normalized to the no E2 condition and are presented as mean ± s.e.m.; n = 4 biological replicates. Statistical comparisons within each line were performed using an ordinary two-way ANOVA and uncorrected Fisher’s LSD with single pooled variance. d, Quantified ATP of HCI-011 treated as in b. Data are normalized to the no E2 condition. Data are presented as mean ± s.e.m.; n = 3 biological replicates. A statistical comparison was performed using a two-tailed unpaired t-test. e, Cytospin immunofluorescence (IF) staining of ER (green) and EpCAM (red) of PDxOs HCI-003, HCI-011 and HCI-017 without E2 stimulation; scale bar, 75 µm. Organoids were stained and imaged once. f, HCI-003, HCI-011 and HCI-017 PDxoX tumor response to 40 mg kg–1 or 200 mg kg–1 fulvestrant treatment. Mean tumor volume relative to tumor volume at treatment start was calculated (HCI-003: vehicle, n = 3 mice; fulvestrant (40 mg kg–1), n = 3 mice; fulvestrant (200 mg kg–1), n = 4 mice; HCI-011: vehicle, n = 4 mice; fulvestrant (40 mg kg–1), n = 5 mice; fulvestrant (200 mg kg–1), n = 5 mice; HCI-017: vehicle, n = 3 mice; fulvestrant (40 mg kg–1), n = 2 mice; fulvestrant (200 mg kg–1), n = 4 mice). Data are presented as mean ± s.e.m.; P values were determined by comparing area under growth curves up to 19 d (HCI-003), 24 d (HCI-011) and 47 d (HCI-017) using a two-sided t-test. g, Tumor growth rate was calculated from the data in f. Data are presented as mean ± s.e.m. Statistical comparisons within each line were performed using a one-way ANOVA and Tukey’s multiple comparison test with single pooled variance. h, PDxoX HCI-003 (left) and HCI-011 (right) with 200 mg kg–1 fulvestrant after off-treatment recurrence to select resistance. Individual tumors are shown, and arrows indicate the start of retreatment for each mouse. Source data
Fig. 4
Fig. 4. Characterization of established PDxOs.
a, Brightfield images of established PDxO lines to show characteristic morphology at maturity; scale bar, 50 μm. b, Culture doubling times for each established PDxO line over long-term culture. Each dot indicates a culture passage; n is indicated below the x axis; error bars represent ±s.e.m. c, Expression of PDxO characterization genes in HCI-001, HCI-002, HCI-010 and HCI-027 PDxOs at different culture time points. Data are normalized to GAPDH and represent technical replicates of n = 4; EMT, epithelial-to-mesenchymal transition. d, Expression of PDxO characterization genes at single time points for representative PDxOs, validating their human epithelial nature and subtype status, with additional markers to highlight diversity across different lines. Data are normalized to GAPDH and represent technical replicates of n = 4; PBMC, peripheral blood mononuclear cells; MSC, mesenchymal stem cells. Source data
Fig. 5
Fig. 5. Genomic landscape of PDxOs compared to PDXs and human tumors.
a, Correlation heat map illustrating genome-wide DNA methylation analysis for 11 sets of patient-derived models compared to commonly used breast cancer cell lines. The color scale indicates the Pearson correlation coefficient. b, Eleven sets of models were characterized at different time points (early and late) to assess molecular fidelity with the human tumors. The heat map is divided into four sections from top to bottom: annotations, exome sequencing variant detection, CN correlations from SNP array data and RNA-seq gene expression correlations. Mutation variants are shown with an oncoprint plot highlighting single-nucleotide variants and indels for commonly mutated genes in breast cancer. Quantitative CNV correlations are shown using a heat map of Spearman correlations for gene-level log2 CN ratios. Quantitative transcriptome correlations are shown using a heat map of Spearman correlations for gene-level log10-transformed RNA-Seq by Expectation-Maximization (RSEM) count estimates; NA, not applicable. c, Unsupervised clustering of the same models shown in b, with the PAM50 gene set to classify subtype.
Fig. 6
Fig. 6. PDxO drug screening shows concordance with in vivo data and identifies birinapant as a potential therapy for some TNBC tumors.
a, Unsupervised clustering of 16 PDxO models and 45 screened compounds. Color indicates GRaoc statistics (darker colors indicate cytotoxicity, and lighter colors indicate growth). Annotations indicate HR status. b, An illustration of dose–response curve statistics that can be calculated using the R package GRmetrics. The y axis displays growth rate-adjusted estimates from the CellTiter-Glo 3D (CTG-3D) cell viability assays. The x axis shows log fold change of eight-point dose concentrations. Each dot represents 1 of 12 replicates (3 biological replicates and 4 technical replicates each). Annotations include half-maximal effective concentration (EC50), GR50 (concentration at which the GR value is 0.5), cytostatic (concentration at which the model is neither growing nor shrinking) and GRaoc (the area over the dose–response curve that estimates both sensitivity and cytotoxicity). c, Ordered models based on GRaoc for navitoclax sensitivity. High values with darker colors suggest a cytotoxic response to the compound. Drug concentrations are micromolar units. The colors of the model identifiers correspond to in vivo data in d. The heat map displays drug response to navitoclax in PDxO screens. The coloration indicates CTG-3D cell viability assays in PDxO screens that were normalized to day 0 ranging from 0 (black, cytotoxic) to 3 (yellow, growth). Models are sorted by GRaoc estimate. d, Responses to navitoclax in vivo for the most sensitive model predicted by PDxO screening (HCI-010) and four others: HCI-024, HCI-015, HCI-002 and HCI-027. Data are shown as mean ± s.e.m. Treatment groups for all PDX lines are composed of n = 3 mice; vehicle groups for all PDX lines include n = 6 mice. e, Stacked heat map displays ordered GRaoc calculations for each model’s response to docetaxel from dark (cytotoxic) to light (growth). The colors of model identifiers correspond to in vivo modeling in f. The heat map displays drug response to docetaxel in PDxO screens. Drug concentrations are micromolar units. The coloration indicates CTG-3D cell viability assays in PDxO screens that were normalized to day 0 ranging from 0 (black, cytotoxic) to 2.5 (yellow, growth). Models are sorted by GRaoc estimate. f, Results of in vivo docetaxel treatment for HCI-023, HCI-015, HCI-019, HCI-016, HCI-002, HCI-027, HCI-010, HCI-024 and HCI-001. Data are shown as mean ± s.e.m. Treatment groups for all PDX lines include n = 3 mice; vehicle groups for all PDX lines include n = 6 mice. Source data
Fig. 7
Fig. 7. Growth rate-adjusted PDxO screening analysis ranks models in concordance with PDX response.
a, A tile plot displays sample-specific drug ranks colored by drug class: chemotherapeutic agents (dark purple), PI3K/AKT/mTOR-targeted agents (yellow) and all other drugs (teal). Samples are separated by HR+ and HER2+ tumors or TNBC. b, Stacked heat map rank of PDxO models for birinapant drug responses. Samples are sorted by GRaoc with the best responses on top. The PAM50 breast cancer subtype for each model is displayed to the right. c, In vivo drug treatment response to birinapant in various PDX models (top) with matching vehicle controls (bottom). Data are shown as mean ± s.e.m.; birinapant treatment groups: n = 5 mice for all PDX lines; vehicle groups: n = 5 mice for all PDX lines. d, Stacked heat map displays GRaoc calculations for each model’s response to the γ-secretase inhibitor RO4929097 from dark (cytotoxic) to light (growth). The color of the model identifiers corresponds to in vivo modeling within d. The heat map displays drug response to RO4929097 in PDxO screens. The coloration indicates CTG-3D cell viability assays in PDxO screens that were normalized to day 0 ranging from 0 (black, cytotoxic) to 2 (yellow, growth). Models are sorted by GRaoc. Drug concentrations are micromolar units. e, In vivo drug treatment response to birinapant, irinotecan or a combination in HCI-002 (left), HCI-012 (middle) and HCI-023 (right) PDX models. Data are shown as mean ± s.e.m.; treatment and vehicle groups: n = 5 mice for all PDX lines. f, Time to recurrence of HCI-023 PDX tumors following cessation of birinapant, irinotecan or combination treatment compared by a log-rank Mantel–Cox test; treatment groups: n = 5 mice for all PDX lines. Source data
Fig. 8
Fig. 8. PDxO screening can be performed in real time with clinical care.
a, Timeline of the individual HCI-043, including clinical history, patient-derived model establishment (PDX and PDxO est.), PDxO drug screens and in vivo validation of responses in PDX. Model development and drug screening/testing were done with both the pretreatment biopsy sample (HCI-043) and the metastatic ascites sample (HCI-051), with similar results. ddAC, dose-dense doxorubicin and cyclophosphamide. b, Treatment of the HCI-043 PDX with human-matched neoadjuvant therapy (doxorubicin + cyclophosphamide followed by paclitaxel (AC-T); left) or with drugs selected from the PDxO screen (right). Arrows indicate the sequencing of AC-T drug treatment. Data are shown as mean ± s.e.m.; left: AC-T treatment group, n = 5 mice; vehicle group, n = 4 mice; right: cabozantinib, n = 4 mice; talazoparib, n =4 mice; enzalutamide, n = 4 mice; eribulin, n = 5 mice; vehicle group, n = 8 mice. c, Follow-up of HCI-043 PDX mice after stopping treatment with eribulin following three doses. Two different mice (ms) exhibited recurrence off-treatment, but the tumors regressed after treatment was restarted. No resistant tumors were detected over the lifespan of the mice (293 d after initial treatment began). d, Treatment of HCI-051 PDX with AC-T, as in b. Data are shown as mean ± s.e.m.; treatment and vehicle groups, n = 5 mice for all PDX lines. Source data
Extended Data Fig. 1
Extended Data Fig. 1. PDX establishment.
(a) Detailed description of the PDX establishment pipeline (b) Side-by-side genomics comparison of WES and CNV are presented for HCI-028 and HCI-028LV (left) and HCI-031 and HCI-031OV (right). (c) HCI-018 PDX tumor growth in mice implanted with E2 pellets only versus mice that received E2 pellets followed by E2 supplementation in drinking water. Data are shown as mean ± s.e.m. n=5 mice per treatment group. (d-g) Establishment of estrogen-independent (EI) ER+ PDX sublines. Tumor growth of parental ER+ line under standard estrogen supplementation conditions (E2) versus in ovariectomized (OVX) mice with no E2 supplement. Data are shown as mean ± s.e.m. HCI-013 E2 group had 5 mice with two tumors each (n=10 tumors plotted in graph) and HCI-013 OVX group had 5 mice with one tumor each (n=5 tumors plotted in graph); all subsequent mice had 1 tumor each. HCI-032 E2 group had n=1 mouse, HCI-032 OVX group had n=4 mice; HCI-040 E2 group had n=5 mice, HCI-040 OVX group had n=5 mice; HCI-044 E2 group had n=4 mice, HCI-044 OVX group had n=3 mice. Growth of the established EI subline arising from the OVX condition, subsequently transplanted into OVX or intact mice with no E2 supplement. EI PDX lines are maintained in intact mice with no E2 supplement. For HCI-013 only, the tumor from the OVX condition in left panel was first expanded in culture for two weeks in phenol-red free medium with charcoal-stripped serum prior to implantation into OVX mice. Growth in intact mice is the subsequent passage. Data are shown as mean ± s.e.m. HCI-013EI OVX n=5 mice, HCI-013EI Intact n=3 mice per group; HCI-032EI OVX n=5 mice per group, HCI-032EI Intact n=5 mice per group; HCI-040EI OVX n=5 mice per group, HCI-040EI Intact n=5 mice per group; HCI-044EI OVX n=3 mice per group, HCI-044EI Intact n=3 mice per group. ‘P’ denotes passage number. Source data
Extended Data Fig. 2
Extended Data Fig. 2. ESR1 mutation analysis.
Droplet digital PCR detection of Y537S homozygous ESR1 mutation in HCI-044 PDX tumors (a) and Y537S low allele frequency tumors in HCI-018 PDX (b) and HCI-032 PDX (c). 2D scatter plots of ddPCR results showing fluorescent detection of individual droplets with either gDNA or cDNA. Blue and green dots represent droplets with WT or mutant ESR1 genotypes indicated on the right panel of each plot, respectively. Orange dots represent droplets containing both WT and mutant ESR1 DNA. Black dots represent droplets without DNA. Mutation allele frequencies are labelled accordingly.
Extended Data Fig. 3
Extended Data Fig. 3. Optimization of ER + and HER2 + PDxO culture.
(a) Growth response of HCI-011 PDxO to culture medium additives, quantified as live cell area. Mean ± s.e.m. All conditions are n=3 biological replicates except A83-02 + Y-27632 and Y-27632+CHIR (3 days) n=5 biological replicates; Y-27632, A83-01, CHIR (3 days), SB-202190 n=6 biological replicates. (b) Effect of other common breast cancer medium supplements on growth of HCI-011 PDxOs, quantified by Cell Titer Glo 3D (CTG-3D) assay to measure ATP content. Mean ± s.e.m., n=3 biological replicates. (c) Effect of other common breast cancer medium supplements on growth of HCI-011 PDxOs, quantified by CTG-3D. Mean ± s.e.m., n=3 biological replicates. Statistical comparisons to control condition (minus all (left) or +Y-276362 (right)) by ordinary two-way ANOVA, uncorrected Fisher’s LSD with single pooled variance (d) HCI-011 PDxO organoid size (radius) after addition of Y-27632, NAC and FGF2 to PDxO cultures. Each gray dot represents one organoid. Data are shown as mean and individual data points: control n=449 individual organoids, bFGF n=313 individual organoids, bFGF + NAC n=344 individual organoids. Statistical comparisons to control (+Y-27632) by ordinary two-way ANOVA, uncorrected Fisher’s LSD with single pooled variance. (e) Comparison of culture doubling time of HCI-011 and HCI-017 when established in our optimized ER + PDxO media or organoid media published by Sachs et al., 2018. Mean ± s.e.m. HCI-017 n=6 biological replicates, HCI-011 Sachs et al n=4 biological replicates, HCI-011 PDxO n=3 biological replicates. Statistical comparisons to control condition (Sachs et al., 2018) within each line by ordinary two-way ANOVA, uncorrected Fisher’s LSD individual variances computed from each comparison. (f) Immunohistochemistry of HER2 showing variable HER2 staining in PDxOs and their parental PDX tumor with HER2 + histories. HCI-005 (top) and HCI-008 (bottom) are shown. Each IHC staining has been performed once for each model. Scale bar corresponds to 50 um. (g) Effect of additional medium supplements on growth of HCI-005 PDxOs, quantified by CTG-3D assay (left) and live cell area (right). Mean ± s.e.m., n=3 biological replicates. Statistical comparisons to control condition (+Y-27632+NAC + FGF2) by ordinary two-way ANOVA, uncorrected Fisher’s LSD with single pooled variance. Source data
Extended Data Fig. 4
Extended Data Fig. 4. Patient-derived model growth rate and proliferation comparison.
PDxO xenograft (PDxoX) tumor volumes (a) and tumor growth rates (b) compared to parental PDX lines for HCI-001, HCI-002, HCI-010, HCI-025, and HCI-027. PDxOs were in culture for 51-64 days (PDxoX early) or 113-123 days (PDxoX late) prior to xenografting. Tumor volume shown as mean ± s.e.m. Tumor growth rates shown as mean ± s.e.m. HCI-001 parental n=5 mice, early n=5 mice, late n=4 mice; HCI-002 parental n=5 mice, early n=5 mice, late n=4 mice; HCI-010 parental n=1 mouse, early n=6 mice; HCI-025 parental n=5 mice, early n=5 mice, late n=4 mice; HCI-027 parental n=7 mice, early n=5 mice, late n=4 mice, late V2 n=4 mice, PDX parental P1 n=5 mice. Statistical comparisons to control (PDX parental) for growth rates by ordinary one-way ANOVA, Tukey’s multiple comparisons test with a single pooled variance. HCI-010 PDX only generated n=1 mouse, requiring use of two-tailed unpaired t test. (c) Quantification of Ki67+ nuclei of parental PDX, early (51-68 days) and late (113-127 days) PDxO cultures and early and late PDxoX. Ki67 staining was performed on one PDX tumor per HCI line, and n=3 individual sets of IHC stains were performed. Data are shown as mean ± s.e.m. and normalized to total hematoxylin+ nuclei count for each image. Statistical comparisons to control (PDX) for Ki67 quantification by ordinary one-way ANOVA, Tukey’s multiple comparisons test with a single pooled variance. Source data
Extended Data Fig. 5
Extended Data Fig. 5. CNV analysis.
CNVkit segmentented copy numbers plot113 illustrates log2 CN ratios for the indicated models. The annotations (left) display HCI-line, model, passage, technology (i.e., SNPchip platform). Segmented copy number data is presented as log2 CN ratios indication amplifications (red) and deletions (blue). (Lower) Graph showing density plot of log2 CN ratios are colored according to the sequencing platform. Vertical bars indicate the thresholds set to define discrete amplifications and deletions.
Extended Data Fig. 6
Extended Data Fig. 6. Drug screen quality control.
(a) Sixteen bubble plots display variability of the screening data across replicates. Plotted are the mean (size) and standard error of the mean (color) for each drug concentration (x-axis) and drug (y-axis) pair using day-0 normalized values. Lighter colors indicate the most variable measures. (b, left) Correlation plot showing mean GI50 scores versus GR50 scores as different data normalization techniques for sample-to-sample comparisons. Each point displays the mean log-transformed GR50 and mean log-transformed GI50 values across biological replicates (all replicates required GR50 and GI50 estimates) with extending whiskers (1 standard error) for drug-sample pairs. (b, mid left) Estimated growth rates from the screening data are shown as mean values (slower to faster growing models from left to right). Error bars indicate + /- s.e.m. Models are grouped into faster and slower growers and compared in panel d. Point indicates the estimated double rate of each biological replicate using log2 ratio of endpoint of DMSO treated organoids and day zero measurements. Number of samples is indicated on x-axis labels. (b, mid right) Density figure displays the residuals, i.e., the biggest differences from a perfect correlation. Shaded in light blue are the data with the biggest discrepancies between the two drug response metrics. The shaded area includes 32 drug-sample pairs that are analyzed in panel d. (b, right) Using the most discrepant samples from panel b, we display where GR50 or GI50 disproportionally inflate potency metrics in faster and slower growers. Here we show that GR50 and GI50 metrics do not inflate or deflate drug responses based on variable growth rates in these models (16 drug-sample pairs in faster, and 16 drug sample pairs in slower group). Stacked bars are colored by the direction of discrepancy, i.e., GR50 scores less than GI50 scores (teal) or GI50 scores were less than GR50 scores (red).
Extended Data Fig. 7
Extended Data Fig. 7. Drug screen data sorted by HCI line.
Sixteen heat maps, organized by model, illustrate individual drug responses to 45 compounds. Coloration of these heatmaps indicates CellTiter-Glo 3D cell viability assays that were normalized to day 0, ranging from 0 (black, cytotoxic) to 2 + (yellow, growth). Values at 1 are considered cytostatic. Color scaling is performed relative to each model. Drugs are sorted left to right from largest GRaoc to smallest, indicating decreasing drug efficacy in each model, respectively. Drug concentrations are micromolar units.
Extended Data Fig. 8
Extended Data Fig. 8. Drug screen data sorted by compound.
Forty-five tiled heatmaps, organized by drug, display day-zero normalized values at multiple concentrations for each drug (darker colors indicated cytotoxic responses while lighter colors indicate growth). Coloration scales are identical from figure to figure. Samples are sorted from left to right by AOC metrics (x-axis). Drug concentrations are micromolar units.
Extended Data Fig. 9
Extended Data Fig. 9. Longitudinal drug screens and synergy.
(a) Two compounds, 5-fluorouracil and FK866 were screened at eight-point dose response curves (y-axis) at different days in culture (x-axis). Individual replicates and dose responses from a CellTiter-Glo 3D cell viability assay were normalized to day 0 for the model HCI-001. Values range from 0 (black) to 4 (light-yellow), where zero indicates cytotoxic effects and yellow shows growth phenotypes. Values at 1 are considered cytostatic. (b) As in the previous panel two compounds, ibrutinib and romidepsin, were screened in model HCI-002 at different times in culture. Here, response values range from 0 (red) to 7 (light-yellow). Values at 1 are considered cytostatic. (c) Individual biological replicates for 16 models are shown for two different targeted therapies in the Notch pathway (LY3039478 and RO4929097), as well as two targeted therapies in the mTOR pathway (vistuserib and sapanisertib). Colored as previously described in panel (a). Response values range from 0 (black) to 5 (light-yellow). Values at 1 are considered cytostatic. (d) Synergy plot as a result of drug treatment of birinapant and SN-38 in HCI-002 (left) and HCI-023 PDxOs (right). Blue indicates synergy and red indicates antagonism. The number in the box represents the Lowe synergy score + /- standard deviation as provided by Combenefit software; Screen was performed in n=12 replicates as defined in methods section. Statistical differences are reported by the software as one sample t-test and *p < .05, **p < .001, ***p < .0001. Source data
Extended Data Fig. 10
Extended Data Fig. 10. Application of PDxO screening to precision oncology.
(a) Representative imaging data (upper panel) and a timeline representing the natural history of individual HCI-043’s breast cancer (lower panel) Events are as follows: A. Diagnosis of early recurrent disease metastatic to the liver (solid arrow). No skeletal metastases (empty arrow). B. No response to capecitabine; new onset skeletal metastases (empty arrow). C. Initiation of cabozantinib and atezolizumab; liver metastases still present (solid arrows). D. No response to cabozantinib and atezolizumab; progression of the hepatic metastases (solid arrow) and production of malignant ascites (empty arrows). E. After 3 cycles of the PDxO-informed eribulin treatment, the patient achieved a complete radiographic remission of the hepatic metastases (solid arrows). The malignant ascites also regressed somewhat (empty arrow). F. After 5 cycles on eribulin, there was complete remission of the malignant ascites (empty arrow) and continued complete remission of the hepatic metastases (solid arrow). However, new onset isolated metastasis in T12 vertebrae (arrowhead) required discontinuation of eribulin and treatment with radiation therapy. G. Recurrence of the hepatic metastases 2 months after withholding the eribulin (solid arrows). (b) H&E staining and PD-L1 staining of HCI-043 patient’s tumor. The tumor tested low but positive for PD-L1 on the basis of an FDA-approved commercially available test. Due to the nature of the test a scalebar is not available. (c) (upper panel) RNA-seq data showing expression of genes associated with the luminal androgen receptor (LAR) subtype in HCI-043 patient tumor. (lower panel) scRNA-seq data showing androgen receptor (AR) expression (red; left side) in all tumor cell clusters (middle) in HCI-043 PDX and PDxOs. Immunohistochemistry for the androgen receptor on the patient tumor was detected by a commercial vendor (PhenoPath; right side). (d-e) Dose response heatmaps showing results of drug screening on the pre-treatment breast tumor biopsy model HCI-043 (d) and the post-treatment metastatic ascites sample (e) from timepoint D on the timeline in panel a, HCI-051. Coloration of these heatmaps indicates CellTiter-Glo 3D cell viability assays that were normalized to day 0 ranging from black (cytotoxic) to yellow (growth), which have been scaled respectively. The drug order on both plots is sorted by GRaoc.

Comment in

Similar articles

Cited by

References

    1. Woo XY, et al. Conservation of copy number profiles during engraftment and passaging of patient-derived cancer xenografts. Nat. Genet. 2021;53:86–99. - PMC - PubMed
    1. Byrne AT, et al. Interrogating open issues in cancer medicine with patient-derived xenografts. Nat. Rev. Cancer. 2017;17:254–268. - PubMed
    1. Weeber F, Ooft SN, Dijkstra KK, Voest EE. Tumor organoids as a pre-clinical cancer model for drug discovery. Cell Chem. Biol. 2017;24:1092–1100. - PubMed
    1. Bleijs M, van de Wetering M, Clevers H, Drost J. Xenograft and organoid model systems in cancer research. EMBO J. 2019;38:e101654. - PMC - PubMed
    1. Kato S, et al. Real-world data from a molecular tumor board demonstrates improved outcomes with a precision N-of-One strategy. Nat. Commun. 2020;11:4965. - PMC - PubMed

Publication types