. 2022 Feb;169(2):026506.
doi: 10.1149/1945-7111/ac4d67. Epub 2022 Feb 1.

Different Electrochemical Behavior of Cationic Dopamine from Anionic Ascorbic Acid and DOPAC at CNT Yarn Microelectrodes

Affiliations

Different Electrochemical Behavior of Cationic Dopamine from Anionic Ascorbic Acid and DOPAC at CNT Yarn Microelectrodes

Zijun Shao et al. J Electrochem Soc. 2022 Feb.

Abstract

Carbon nanotube yarn microelectrodes (CNTYMEs) have micron-scale surface crevices that momentarily trap molecules. CNTYMEs improve selectivity among cationic catecholamines because secondary reactions are enhanced, but no anions have been studied. Here, we compared fast-scan cyclic voltammetry (FSCV) of dopamine and anionic interferents 3,4 dihydroxyphenylacetic acid (DOPAC) and L-ascorbic acid (AA) at CNTYMEs and carbon fiber microelectrodes (CFMEs). At CFMEs, dopamine current decreases with increasing FSCV repetition frequency at pH 7.4, whereas DOPAC and AA have increasing currents with increasing frequency, because of less repulsion at the negative holding potential. Both DOPAC and AA have side reactions after being oxidized, which are enhanced by trapping. At pH 4, the current increases for DOPAC and AA because they are not repelled. In addition, AA has a different oxidation pathway at pH 4, and an extra peak in the CV is enhanced by trapping effects at CNTYMEs. At pH 8.5, co-detection of dopamine in the presence of DOPAC and AA is enhanced at 100 Hz frequency because of differences in secondary peaks. Thus, the trapping effects at CNTYMEs affects anions differently than cations and secondary peaks can be used to identify dopamine in mixture of AA and DOPAC with FSCV.


Figures

Figure 1.
Figure 1.
SEM image of A) CFME and B) CNTYME.
Figure 2.
Figure 2.
Cyclic voltammograms at CFMEs of A) 1 μM dopamine, B) 20 μM DOPAC and C) 20 μM ascorbic acid at 10 Hz and 100 Hz. D) Normalized current trends of three analytes with FSCV repetition frequencies from 10 Hz to 100 Hz. n = 5 electrodes, error bars SEM.
Figure 3.
Figure 3.
Cyclic voltammograms at CNTYMEs of A) dopamine, B) DOPAC and C) ascorbic acid at 10 Hz and 100 Hz. D) Normalized primary peak current trends of three analytes with frequencies ranging from 10 Hz to 100 Hz. n = 5 electrodes, error bars SEM.
Figure 4.
Figure 4.
A) Simulated electric field with CNTYMEs in an electrochemical system at a holding potential of −0.4 V. The concentration profiles of B) neutral molecules, C) cations and D) anions. Red is a high concentration (bulk concentration was 1 μM) and blue is a low concentration. Analyte movements was driven by diffusion and migration in the electric field. The half 2D model of electrode was 50 μm* 6 μm, so the black electrode in the figure is 25 μm long. D = 10−9 m2/s, Cbulk = 1 μM, charge of species zc = +1, za = −1.
Figure 5.
Figure 5.
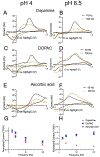
CFMEs at different pH. Left column is CVs at pH 4, and right column is at pH 8.5.Cyclic voltammogram comparisons of A & B) 1 μM dopamine, C & D) 20 μM DOPAC and E & F) 20 μM ascorbic acid at 10 Hz and 100 Hz. G, H) Normalized trends of primary peak currents with frequency.
Figure 6.
Figure 6.
Cyclic voltammograms of at CNTYMEs. Left column is CVs at pH 4, and right column is at pH 8.5. A & B) 1 μM dopamine, C & D) 20 μM DOPAC and E & F) 20 μM ascorbic acid at 10 Hz (black line) and 100 Hz (orange line). G, H) Normalized trends of primary peak currents with frequency.
Figure 7.
Figure 7.
Codetection of dopamine, DOPAC, and ascorbic acid at CNTYMEs at pH 8.5. A.) CVs of pristine 1 μM dopamine, B) CV of 20 μM DOPAC, and C.) CV of 20 μM ascorbic acid. D) Mixture of 1 μM dopamine and 20 μM DOPAC. E.) Mixture of 1 μM dopamine and 20 μM AA All the cyclic voltammograms were obtained at 100 Hz, pH 8.5.
Scheme 1.
Scheme 1.
Redox pathways of A) dopamine, B) DOPAC and C) ascorbic acid at physiological condition at pH 7.4, and D) ascorbic acid at pH 8.5.

References

    1. Basse-Tomusk A; Rebec GV Regional Distribution of Ascorbate and 3,4-Dihydroxyphenylacetic Acid (DOPAC) in Rat Striatum. Brain Res. 1991, 538 (1), 29–35. 10.1016/0006-8993(91)90372-3. - DOI - PubMed
    1. Deakin MR; Kovach PM; Stutts KJ; Wightman RM Heterogeneous Mechanisms of the Oxidation of Catechols and Ascorbic Acid at Carbon Electrodes. Anal. Chem 1986, 58 (7), 1474–1480. 10.1021/ac00298a046. - DOI - PubMed
    1. Huffman ML; Venton BJ Carbon-Fiber Microelectrodes for in Vivo Applications. Analyst 2009, 134 (1), 18–24. 10.1039/b807563h. - DOI - PMC - PubMed
    1. Ribeiro JA; Fernandes PMV; Pereira CM; Silva F Electrochemical Sensors and Biosensors for Determination of Catecholamine Neurotransmitters: A Review. Talanta 2016, 160, 653–679. 10.1016/j.talanta.2016.06.066. - DOI - PubMed
    1. Baur JE; Kristensen EW; May LJ; Wiedemann DJ; Wightman RM Fast-Scan Voltammetry of Biogenic Amines. Anal. Chem 1988, 60 (13), 1268–1272. - PubMed

LinkOut - more resources