

Molecular Dynamics Simulations to Explore the Structure and Rheological Properties of Normal and Hyperconcentrated Airway Mucus
- PMID: 35221375
- PMCID: PMC8871504
- DOI: 10.1111/sapm.12433
Molecular Dynamics Simulations to Explore the Structure and Rheological Properties of Normal and Hyperconcentrated Airway Mucus
Abstract
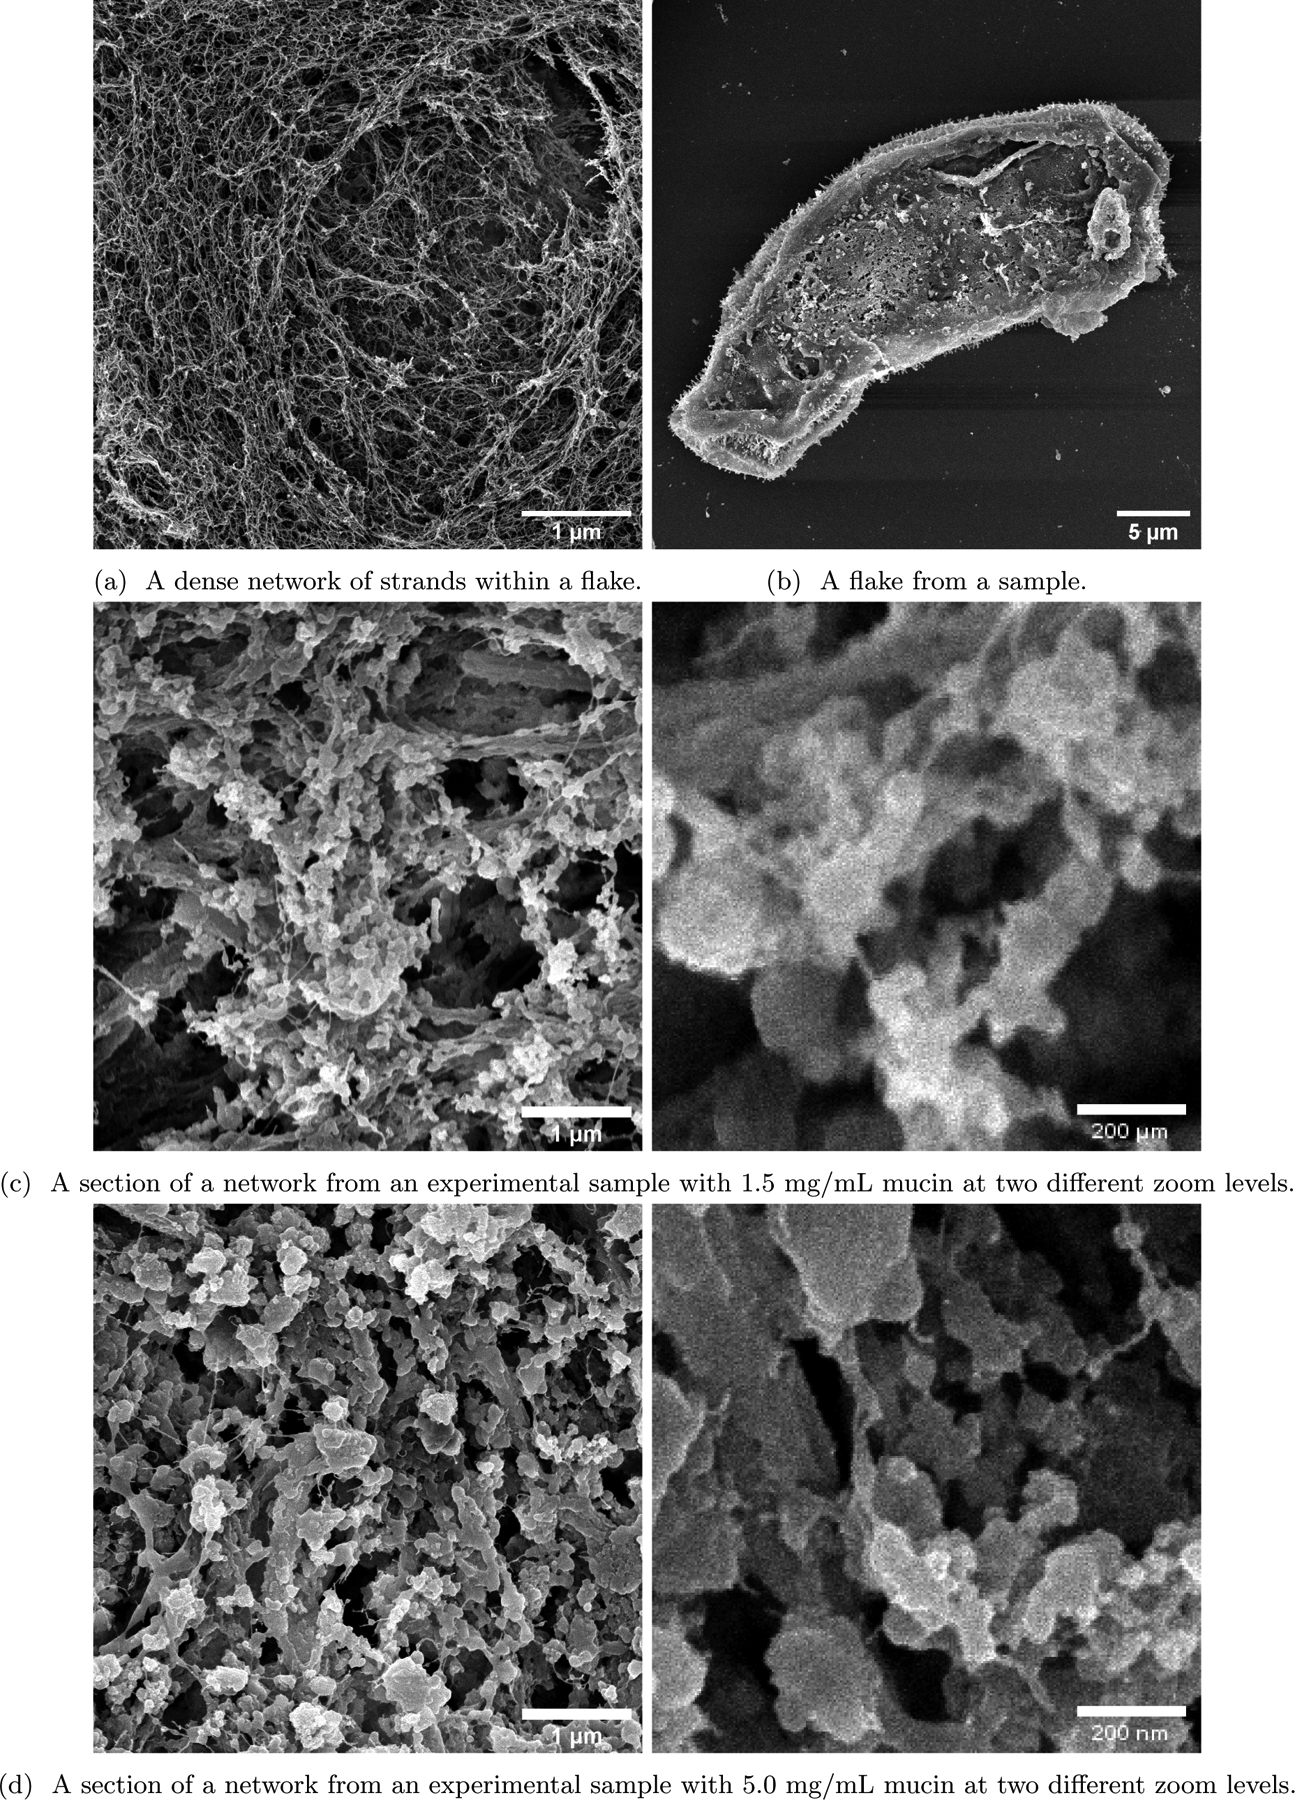
We develop the first molecular dynamics model of airway mucus based on the detailed physical properties and chemical structure of the predominant gel-forming mucin MUC5B. Our airway mucus model leverages the LAMMPS open-source code [https://lammps.sandia.gov], based on the statistical physics of polymers, from single molecules to networks. On top of the LAMMPS platform, the chemical structure of MUC5B is used to superimpose proximity-based, non-covalent, transient interactions within and between the specific domains of MUC5B polymers. We explore feasible ranges of hydrophobic and electrostatic interaction strengths between MUC5B domains with 9 nanometer spatial and 1 nanosecond temporal resolution. Our goal here is to propose and test a mechanistic hypothesis for a striking clinical observation with respect to airway mucus: a 10-fold increase in non-swellable, dense structures called flakes during progression of cystic fibrosis disease. Among the myriad possible effects that might promote self-organization of MUC5B networks into flake structures, we hypothesize and confirm that the clinically confirmed increase in mucin concentration, from 1.5 to 5 mg/mL, alone is sufficient to drive the structure changes observed with scanning electron microscopy images from experimental samples. We post-process the LAMMPS simulated datasets at 1.5 and 5 mg/mL, both to image the structure transition and compare with scanning electron micrographs and to show that the 3.33-fold increase in concentration induces closer proximity of interacting electrostatic and hydrophobic domains, thereby amplifying the proximity-based strength of the interactions.
Figures


References
-
- Bansil R and Turner BS: 2006, ‘Mucin structure, aggregation, physiological functions and biomedical applications’. Current Opinion in Colloid & Interface Science 11(2–3), 164–170.
-
- Bansil R and Turner BS: 2018, ‘The biology of mucus: Composition, synthesis and organization’. Advanced Drug Delivery Reviews 124, 3–15. - PubMed
-
- Berendsen H, Van Der Spoel D, and Van Drunen R: 1995, ‘GROMACS: A message-passing parallel molecular dynamics implementation’. Computer Physics Communications 91(1–3), 43–56.
-
- Bhaskar KR, Gong DH, Bansil R, Pajevic S, Hamilton JA, Turner BS, and LaMont JT: 1991, ‘Profound increase in viscosity and aggregation of pig gastric mucin at low pH’. American Journal of Physiology-Gastrointestinal and Liver Physiology 261(5), G827–G832. - PubMed
Grants and funding
LinkOut - more resources
Full Text Sources