. 2022 Feb 10:16:820127.
doi: 10.3389/fncel.2022.820127. eCollection 2022.

Protein Expression of the Microglial Marker Tmem119 Decreases in Association With Morphological Changes and Location in a Mouse Model of Traumatic Brain Injury

Affiliations

Protein Expression of the Microglial Marker Tmem119 Decreases in Association With Morphological Changes and Location in a Mouse Model of Traumatic Brain Injury

Domenico Mercurio et al. Front Cell Neurosci. .

Abstract

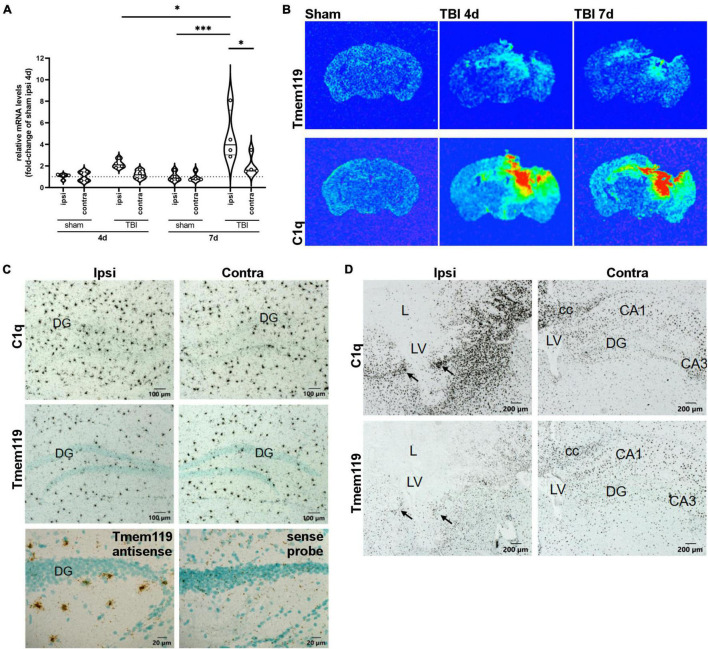
The activation of microglia and the infiltration of macrophages are hallmarks of neuroinflammation after acute brain injuries, including traumatic brain injury (TBI). The two myeloid populations share many features in the post-injury inflammatory response, thus, being antigenically indistinguishable. Recently Tmem119, a type I transmembrane protein specifically expressed by microglia under physiological conditions, was proposed as a tool to differentiate resident microglia from blood-borne macrophages, not expressing it. However, the validity of Tmem119 as a specific marker of resident microglia in the context of acute brain injury, where microglia are activated and macrophages are recruited, needs validation. Our purpose was to investigate Tmem119 expression and distribution in relation to the morphology of brain myeloid cells present in the injured area after TBI. Mice underwent sham surgery or TBI by controlled cortical impact (CCI). Brains from sham-operated, or TBI mice, were analyzed by in situ hybridization to identify the cells expressing Tmem119, and by Western blot and quantitative immunofluorescence to measure Tmem119 protein levels in the entire brain regions and single cells. The morphology of Iba1+ myeloid cells was analyzed at different times (4 and 7 days after TBI) and several distances from the contused edge in order to associate Tmem119 expression with morphological evolution of active microglia. In situ hybridization indicated an increased Tmem119 RNA along with increased microglial complement C1q activation in the contused area and surrounding regions. On the contrary, the biochemical evaluation showed a drop in Tmem119 protein levels in the same areas. The Tmem119 immunoreactivity decreased in Iba1+ myeloid cells found in the contused cortex at both time points, with the cells showing the hypertrophic ameboid morphology having no Tmem119 expression. The Tmem119 was present on ramifications of resident microglia and its presence was decreased as a consequence of microglial activation in cortical areas close to contusion. Based on the data, we conclude that the decrease of Tmem119 in reactive microglia may depend on the process of microglial activation, which involves the retracting of their branchings to acquire an ameboid shape. The Tmem119 immunoreactivity decreases in reactive microglia to similar levels than the blood-borne macrophages, thus, failing to discriminate the two myeloid populations after TBI.

Keywords: Tmem119; complement C1q; macrophage; microglia; neuroinflammation; traumatic brain injury.


Conflict of interest statement

The authors declare that the research was conducted in the absence of any commercial or financial relationships that could be construed as a potential conflict of interest.

Figures

FIGURE 1
FIGURE 1
Tmem119 gene expression at 4 or 7 days after sham surgery or TBI. (A) The RNA isolated from brain sections enabled comparison of Tmem119 expression levels ipsilaterally and contra-laterally to the lesion. Data are shown as violin plot with single replicates, a line at median and quartiles, and n = 4. Three-way ANOVA followed by Sidak’s multiple comparison test, ∗∗∗p < 0.001, p < 0.05. (B) Representative false color X-ray film images of coronal brain sections of TBI or sham mice after hybridization with 35S-Labeled RNA probes specific for Tmem119 and C1qa. Exposure times of X-ray films were 48 h for C1q, 70 h for Tmem119. (C) High magnifications of representative autoradiograms of sham mice at 4 days. Comparing ipsi to contralateral sides, no differences were observed in the scattered microglia-like distribution pattern of Tmem119 mRNA and C1qa mRNA expressing cells. Control staining with anti-sense probes produced specific Tmem119 ISH signals in microglia, but not in neurons or other cell types. In contrast, sense probes used as negative controls produced a background but no specific cellular staining. Scale bars 100 μm or 20 μm. (D) High magnifications of representative autoradiograms of TBI mice at 4 days. Numerous densely packed cells in the ipsilateral areas surrounding the lesion (L) exhibit strong ISH signals for both C1qa and Tmem119 (arrows). The ISH signals appeared to increase to a lesser extent also on the contralateral side. Scale bars 200 μm; cc, Corpus callosum; L, lesion area; LV, lateral ventricle; DG, dentate gyrus; and CA3, cornu ammonis region 3.
FIGURE 2
FIGURE 2
Brain protein levels of Tmem119 at 4 days after sham surgery or TBI. (A) Western blot showing Tmem119 protein (50 kDa) in three different brain regions ipsilateral to the lesion: cortex, hippocampus, and striatum. The GAPDH was used as a loading control. (B) Tmem119 protein levels decreased significantly after TBI selectively in the cortex. Data are shown as violin plot with single replicates, a line at median and quartiles, and n = 4. Unpaired t-test, **p < 0.01 vs. sham.
FIGURE 3
FIGURE 3
Tmem119 immunoreactivity in cortical areas with activated Iba1+ cells after TBI. (A) Representative large image showing Tmem119+ (green) and Iba1+ (red) cells in sham-operated and TBI mice at 4 or 7 days after injury. The Tmem119 immunoreactivity decreased after TBI and this was associated with a morphological change of myeloid cells indicative of their activation. Scale bars 500 μm in the large image, 100 μm in the magnified inserts. Inserts corresponding to white dashed boxes. (B) Anatomical location of the three different regions of interest (red boxes) used for subsequent Tmem119 and Iba1 quantifications. We acquired at the contusion edge and at regions located at 350 μm (intermediate) and 700 μm (distance) from it. Drawing of the section modified from the Parkinson’s atlas of the mouse brain. (C,D) Tmem119 levels in sham and TBI mice at 4 (C) and 7 (D) days after injury. Tmem119 immunoreactivity decreased after injury in all the areas of interest analyzed. Data are shown as violin plot with single replicates (cells), a line at median and quartiles, and n = 92–155 cells from three mice per group. Two-way ANOVA followed by Sidak’s multiple comparison test, ∗∗∗p < 0.01, ∗∗∗∗p < 0.0001. (E) Representative micro photograms showing Iba1+ cells at the three different areas of interests in sham and TBI mice at 4 and 7 days after injury. Iba1+ cells acquired an ameboid morphology when close to the contusion edge at both time points. Scale bars 20 μm. (F) The quantification of morphological parameters showed that Iba1+ cells had increased area and circularity, in particular, in the region near the contusion at 4 days. Data are shown as violin plot with single replicates (cells), line at median and quartiles, n = 92–155 cells from three mice per group. Two-way ANOVA followed by Sidak’s multiple comparison test, ∗∗∗∗p < 0.0001, ∗∗p < 0.01, and p < 0.05.
FIGURE 4
FIGURE 4
Stratification of Iba1+ cells based on their morphology and Tmem119 immunoreactivity after Iba1+ morphological stratification. (A) Distribution of Iba1+ cells based on area and circularity. We gated the cells based on the area (cut-off at 250 μm2) and circularity (cut-offs at 0.16). Cut-offs are indicated by the dotted lines. The relative proportions of Iba1+ in each gated population are indicated in the graph. (B,B’) The Tmem119 levels of each gated Iba1+ cell populations decreased significantly at 4 days after TBI compared to sham, with ameboid and cells having the lowest Tmem119 values of immunoreactivity (B). Representative micro photograms showing Iba1+ (red) and Tmem119+ (green) cells in the three regions of interest. The Tmem119 immunoreactivity was calculated within the Iba1+ outline (white) traced using an originally developed ImageJ algorithm (B’, scale bar 20 μm). (C,C’) The Tmem119 immunoreactivity of each gated Iba1+ cell populations decreased significantly at 7 days after TBI compared to sham (C). Representative micro photograms showing Iba1+ (red) and Tmem119+ (green) cells (C’, scale bar 20 μm). Data are shown as scatter dot plot, a line at mean, and n = 92–155 cells from three mice per group. Kruskal–Wallis test followed by Dunn’s multiple comparisons tests, ∗∗∗p < 0.001, ∗∗p < 0.01, and p < 0.05.
FIGURE 5
FIGURE 5
Subcellular localization of Tmem119. (A) Outline tracing for the differential analysis of Tmem119 in soma vs. ramifications of Iba1+ cells. Scale bar 20 μm. (B) Tmem119 immunoreactivity was higher in ramifications compared to the soma of Iba1+ cells at 4 and 7 days after sham surgery. Data are shown as violin plot with single replicates (cells), line at median and quartiles, n = 92–155 cells from three mice per group. Two-way ANOVA followed by Sidak’s multiple comparison test, ∗∗∗p < 0.001, ∗∗∗∗p < 0.0001. (C) We analyzed the subcellular localization of Tmem119 by super-resolved SIM. Tmem119 (green) appeared to be predominantly located on Iba1+ cell (red) ramifications, as clearly seen on the highly ramified cells present in sham mice. (D,E) In the contused cortex, at either 4 (D) and 7 (E) days after TBI, Tmem119 was still visible on myeloid cells ramifications of hypertrophic Iba1+ cells. Scale bars 10 μm in confocal images, 2 μm in SIM images. SIM images present z-stack orthogonal views and arrowheads indicating a few Tmem119 positive ramifications.

References

    1. Ajami B., Bennett J. L., Krieger C., McNagny K. M., Rossi F. M. V. (2011). Infiltrating monocytes trigger EAE progression, but do not contribute to the resident microglia pool. Nat. Neurosci. 14 1142–1149. 10.1038/nn.2887 - DOI - PubMed
    1. Ajami B., Bennett J. L., Krieger C., Tetzlaff W., Rossi F. M. V. (2007). Local self-renewal can sustain CNS microglia maintenance and function throughout adult life. Nat. Neurosci. 10 1538–1543. 10.1038/nn2014 - DOI - PubMed
    1. Anderson P. (2010). Post-transcriptional regulons coordinate the initiation and resolution of inflammation. Nat. Rev. Immunol. 10 24–35. 10.1038/nri2685 - DOI - PubMed
    1. Ball G., Demmerle J., Kaufmann R., Davis I., Dobbie I. M., Schermelleh L. (2015). SIMcheck: a toolbox for successful super-resolution structured illumination microscopy. Sci. Rep. 5:15915. - PMC - PubMed
    1. Bennett F. C., Bennett M. L., Yaqoob F., Mulinyawe S. B., Grant G. A., Hayden Gephart M., et al. (2018). A combination of ontogeny and CNS environment establishes microglial identity. Neuron 98 1170–1183.e8. 10.1016/j.neuron.2018.05.014 - DOI - PMC - PubMed

LinkOut - more resources