. 2022 Feb 10:13:789054.
doi: 10.3389/fnagi.2021.789054. eCollection 2021.

18F-APN-1607 Tau Positron Emission Tomography Imaging for Evaluating Disease Progression in Alzheimer's Disease

Affiliations

18F-APN-1607 Tau Positron Emission Tomography Imaging for Evaluating Disease Progression in Alzheimer's Disease

Xiaojun Xu et al. Front Aging Neurosci. .

Abstract

Purpose: 18F-APN-1607 is a novel tau positron emission tomography (PET) tracer characterized with high binding affinity for 3- and 4-repeat tau deposits. The aim was to analyze the spatial distribution of 18F-APN-1607 PET imaging in Alzheimer's disease (AD) subjects with different stages and to investigate the relationship between the change of tau deposition and overall disease progression.

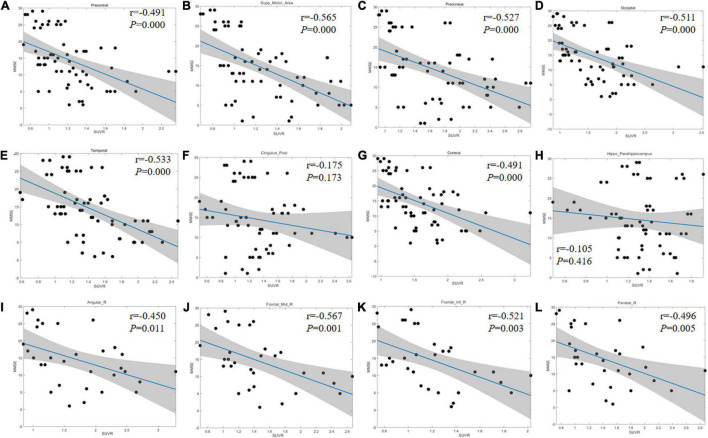
Methods: We retrospectively analyzed the 18F-APN-1607 PET imaging of 31 subjects with clinically and imaging defined as AD. According to the Mini-Mental State Examination (MMSE) score, patients were divided into three groups, namely, mild (≥21, n = 7), moderate (10-20, n = 16), and severe (≤9, n = 8). PET imaging was segmented to 70 regions of interest (ROIs) and extracted the standard uptake value (SUV) of each ROI. SUV ratio (SUVR) was calculated from the ratio of SUV in different brain regions to the cerebellar cortex. The regions were defined as positive and negative with unsupervised cluster analysis according to SUVR. The SUVRs of each region were compared among groups with the one-way ANOVA or Kruskal-Wallis H test. Furthermore, the correlations between MMSE score and regional SUVR were calculated with Pearson or Spearman correlation analysis.

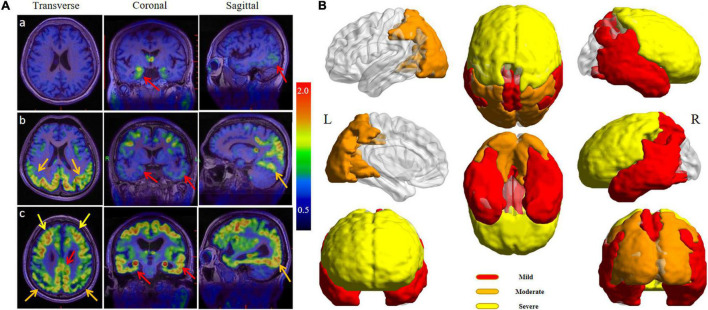
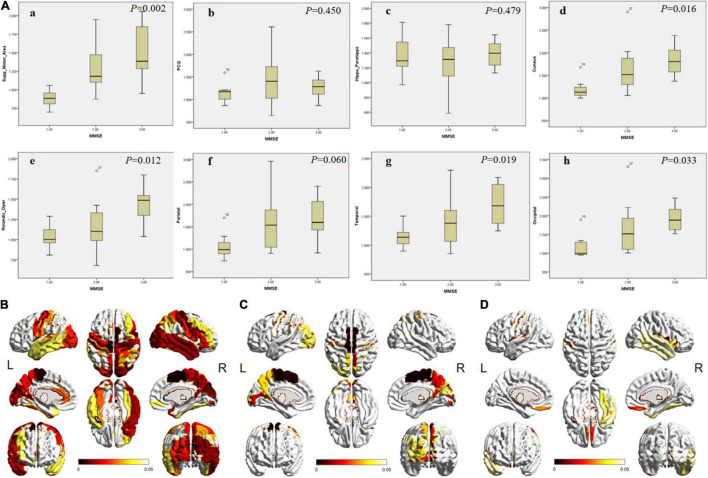
Results: There were no significant differences among groups in gender (χ2 = 3.814, P = 0.161), age of onset (P = 0.170), age (P = 0.109), and education level (P = 0.065). With the disease progression, the 18F-APN-1607 PET imaging showed the spread of tau deposition from the hippocampus, posterior cingulate gyrus (PCG), and lateral temporal cortex (LTC) to the parietal and occipital lobes, and finally to the frontal lobe. Between the mild and moderate groups, the main brain areas with significant differences in 18F-APN-1607 uptake were supplementary motor area (SMA), cuneus, precuneus, occipital lobule, paracentral lobule, right angular gyrus, and parietal, which could be used for early disease progression assessment (P < 0.05). There were significant differences in the frontal lobe, right temporal lobe, and fusiform gyrus between the moderate and severe groups, which might be suitable for the late-stage disease progression assessment (P < 0.05).

Conclusion: 18F-APN-1607 PET may serve as an effective imaging marker for visualizing the change pattern of tau protein deposition in AD patients, and its uptake level in certain brain regions is closely related to the severity of cognitive impairment. These indicate the potential of 18F-APN-1607 PET for the in vivo evaluation of the progression of AD.

Keywords: 18F-APN-1607; Alzheimer’s disease; positron emission tomography; progression; tau.


Conflict of interest statement

The authors declare that the research was conducted in the absence of any commercial or financial relationships that could be construed as a potential conflict of interest.

Figures

FIGURE 1
FIGURE 1
(A) 18F-APN-1607 PET/MR fusion images of three AD patients with varying degrees. (a) A 67-year-old woman complained of memory decline for 2 years (MMSE = 26, mild group), and the uptake of 18F-APN-1607 could be seen in the hippocampus and posterolateral temporal cortex (red arrows). (b) A 54-year-old man was with progressive memory loss for 5 years and aggravated for 2 years (MMSE = 18, moderate group), and the high uptake was expanded to the parietal and occipital lobes (orange arrows). (c) A 67-year-old man suffered from memory loss for 7 years and self-care disabled for 6 months (MMSE = 5, severe group), and high uptake had been spread to the whole brain including the frontal lobe (yellow arrows). (B) The full-view sketch map for expanding the tau deposits according to the 18F-APN-1607 PET. The deposition was started from the medial and lateral temporal lobes, posterior cingulate gyrus (PCG), and precuneus (red areas), then spread to the parietal and occipital cortex (orange areas), and finally affected the frontal lobe (yellow areas). L means left and R means right.
FIGURE 2
FIGURE 2
The differences of SUVR in specific brain areas among patients in different MMSE groups. (A) The box plot of the SUVR in specific brain areas [(a) SMA; (b) PCG; (c) hippocampus; (d) cuneus; (e) frontal; (f) parietal; (g) lateral temporal; and h, occipital cortex) in different groups. 1, 2, and 3 on the abscissa represent mild, moderate, and severe groups, respectively. The P-values among groups are shown in the upper right corner. (B–D) The full view of regions with significant differences in 18F-APN-1607 uptake. The color bar represents the P-value. (B) The overall difference among the three groups. (C) The difference between the mild and moderate groups. (D) The difference between the moderate and severe groups. SMA, supplementary motor area; PCG, posterior cingulate gyrus. L means left and R means right.
FIGURE 3
FIGURE 3
Linear regression results between MMSE score and regional SUVR. (A–H) Correlation coefficient graph of the bilateral precentral gyrus (A), SMA (B), precuneus (C), occipital lobe (D), lateral temporal lobe (E), PCG (F), cuneus (G), and hippocampus (H). (I–L) Correlation coefficient graph of the right side of angular gyrus (I), FGm (J), FGi (K), and parietal lobe (L). The gray area shows the 95% confidence interval area. The blue solid lines refer to the mean fitting curves. SMA, supplementary motor area; PCG, posterior cingulate gyrus; FGm, middle frontal gyrus; FGi, inferior frontal gyrus.

Similar articles

Cited by

References

    1. Abdullah L., Crawford F., Tsolaki M., Börjesson-Hanson A., Olde Rikkert M., Pasquier F., et al. (2020). The Influence of Baseline Alzheimer’s Disease Severity on Cognitive Decline and CSF Biomarkers in the NILVAD Trial. Front. Neurol. 11:149. 10.3389/fneur.2020.00149 - DOI - PMC - PubMed
    1. Baghel V., Tripathi M., Parida G., Gupta R., Yadav S., Kumar P., et al. (2019). In Vivo Assessment of Tau Deposition in Alzheimer Disease and Assessing Its Relationship to Regional Brain Glucose Metabolism and Cognition. Clin. Nucl. Med. 44 e597–e601. 10.1097/RLU.0000000000002791 - DOI - PubMed
    1. Braak H., Alafuzoff I., Arzberger T., Kretzschmar H., Del Tredici K. (2006). Staging of Alzheimer disease-associated neurofibrillary pathology using paraffin sections and immunocytochemistry. Acta Neuropathol. 112 389–404. 10.1007/s00401-006-0127-z - DOI - PMC - PubMed
    1. Braak H., Braak E. (1995). Staging of Alzheimer’s disease-related neurofibrillary changes. Neurobiol. Aging 16 271–284. 10.1016/0197-4580(95)00021-6 - DOI - PubMed
    1. Braak H., Del Tredici K. (2016). Potential Pathways of Abnormal Tau and α-Synuclein Dissemination in Sporadic Alzheimer’s and Parkinson’s Diseases. Cold Spring Harb. Perspect. Biol. 8:a023630. 10.1101/cshperspect.a023630 - DOI - PMC - PubMed