

Derivation of a Human In Vivo Benchmark Dose for Bisphenol A from ToxCast In Vitro Concentration Response Data Using a Computational Workflow for Probabilistic Quantitative In Vitro to In Vivo Extrapolation
- PMID: 35222005
- PMCID: PMC8874249
- DOI: 10.3389/fphar.2021.754408
Derivation of a Human In Vivo Benchmark Dose for Bisphenol A from ToxCast In Vitro Concentration Response Data Using a Computational Workflow for Probabilistic Quantitative In Vitro to In Vivo Extrapolation
Abstract
A computational workflow which integrates physiologically based kinetic (PBK) modelling; global sensitivity analysis (GSA), Approximate Bayesian Computation (ABC), Markov Chain Monte Carlo (MCMC) simulation and the Virtual Cell Based Assay (VCBA) for the estimation of the active, free in vitro concentration of chemical in the reaction medium was developed to facilitate quantitative in vitro to in vivo extrapolation (QIVIVE). The workflow was designed to estimate parameter and model uncertainty within a computationally efficient framework. The workflow was tested using a human PBK model for bisphenol A (BPA) and high throughput screening (HTS) in vitro concentration-response data, for estrogen and pregnane X receptor activation determined in human liver and kidney cell lines, from the ToxCast/Tox21 database. In vivo benchmark dose 10% lower confidence limits (BMDL10) for oral uptake of BPA (ng/kg BW/day) were calculated from the in vivo dose-responses and compared to the human equivalent dose (HED) BMDL10 for relative kidney weight change in the mouse derived by European Food Safety Authority (EFSA). Three from four in vivo BMDL10 values calculated in this study were similar to the EFSA values whereas the fourth was much smaller. The derivation of an uncertainty factor (UF) to accommodate the uncertainties associated with measurements using human cell lines in vitro, extrapolated to in vivo, could be useful for the derivation of Health Based Guidance Values (HBGV).
Keywords: BPA (bisphenol A); PBK; QIVIVE; in silico; in vitro.
Copyright © 2022 Loizou, McNally, Paini and Hogg.
Conflict of interest statement
The authors declare that the research was conducted in the absence of any commercial or financial relationships that could be construed as a potential conflict of interest.
Figures
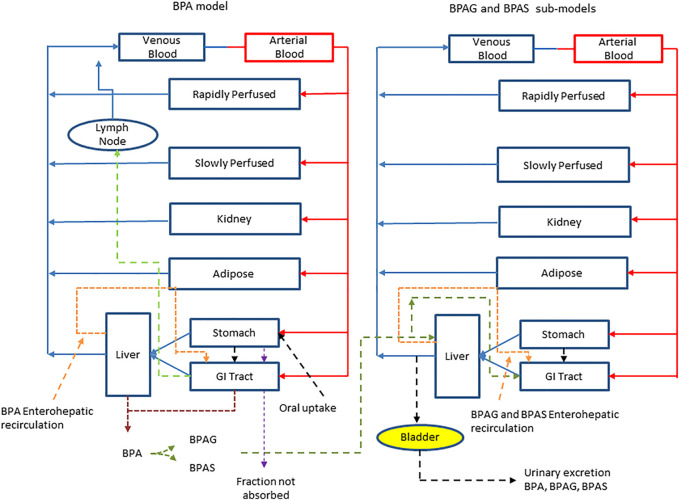
 ) which received a portion of the oral dose of BPA from the stomach and GI tract which entered the systemic circulation after bypassing the liver. The model described metabolism of BPA to BPAG and BPAS in the gut with subsequent uptake into the hepatic portal vein as well as hepatic metabolism of BPA to BPAG and BPAS. Enterohepatic recirculation of BPA, BPAG and BPAS was also included.
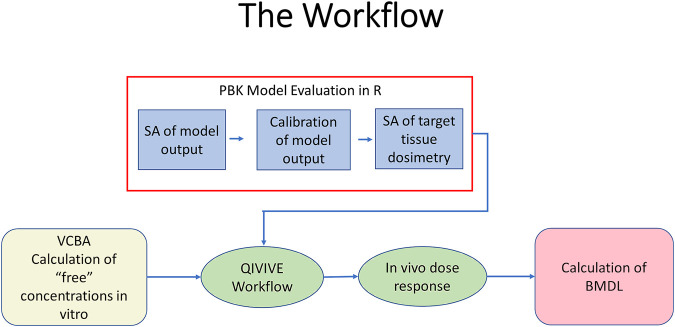
Similar articles
-
Derivation of a Human In Vivo Benchmark Dose for Perfluorooctanoic Acid From ToxCast In Vitro Concentration-Response Data Using a Computational Workflow for Probabilistic Quantitative In Vitro to In Vivo Extrapolation.Front Pharmacol. 2021 May 11;12:630457. doi: 10.3389/fphar.2021.630457. eCollection 2021. Front Pharmacol. 2021. PMID: 34045957 Free PMC article.
-
A Computational Workflow for Probabilistic Quantitative in Vitro to in Vivo Extrapolation.Front Pharmacol. 2018 May 18;9:508. doi: 10.3389/fphar.2018.00508. eCollection 2018. Front Pharmacol. 2018. PMID: 29867507 Free PMC article.
-
Towards a generic physiologically based kinetic model to predict in vivo uterotrophic responses in rats by reverse dosimetry of in vitro estrogenicity data.Arch Toxicol. 2018 Mar;92(3):1075-1088. doi: 10.1007/s00204-017-2140-5. Epub 2017 Dec 12. Arch Toxicol. 2018. PMID: 29234833 Free PMC article.
-
Derivation of a bisphenol A oral reference dose (RfD) and drinking-water equivalent concentration.J Toxicol Environ Health B Crit Rev. 2008 Feb;11(2):69-146. doi: 10.1080/10937400701724303. J Toxicol Environ Health B Crit Rev. 2008. PMID: 18188738 Review.
-
Next generation physiologically based kinetic (NG-PBK) models in support of regulatory decision making.Comput Toxicol. 2019 Feb;9:61-72. doi: 10.1016/j.comtox.2018.11.002. Comput Toxicol. 2019. PMID: 31008414 Free PMC article. Review.
Cited by
-
A novel method to derive a human safety limit for PFOA by gene expression profiling and modelling.Front Toxicol. 2024 Mar 21;6:1368320. doi: 10.3389/ftox.2024.1368320. eCollection 2024. Front Toxicol. 2024. PMID: 38577564 Free PMC article.
-
Advancing PFAS risk assessment: Integrative approaches using agent-based modelling and physiologically-based kinetic for environmental and health safety.Comput Struct Biotechnol J. 2024 Jul 1;23:2763-2778. doi: 10.1016/j.csbj.2024.06.036. eCollection 2024 Dec. Comput Struct Biotechnol J. 2024. PMID: 39050784 Free PMC article.
-
The Relationship between Typical Environmental Endocrine Disruptors and Kidney Disease.Toxics. 2022 Dec 29;11(1):32. doi: 10.3390/toxics11010032. Toxics. 2022. PMID: 36668758 Free PMC article. Review.
-
Development, testing, parameterisation, and calibration of a human PBPK model for the plasticiser, di-(2-ethylhexyl) terephthalate (DEHTP) using in silico, in vitro and human biomonitoring data.Front Pharmacol. 2023 Feb 20;14:1140852. doi: 10.3389/fphar.2023.1140852. eCollection 2023. Front Pharmacol. 2023. PMID: 36891271 Free PMC article.
References
LinkOut - more resources
Full Text Sources