

Antibiotic Disruption of the Gut Microbiota Enhances the Murine Hepatic Dysfunction Associated With a High-Salt Diet
- PMID: 35222044
- PMCID: PMC8881101
- DOI: 10.3389/fphar.2022.829686
Antibiotic Disruption of the Gut Microbiota Enhances the Murine Hepatic Dysfunction Associated With a High-Salt Diet
Abstract
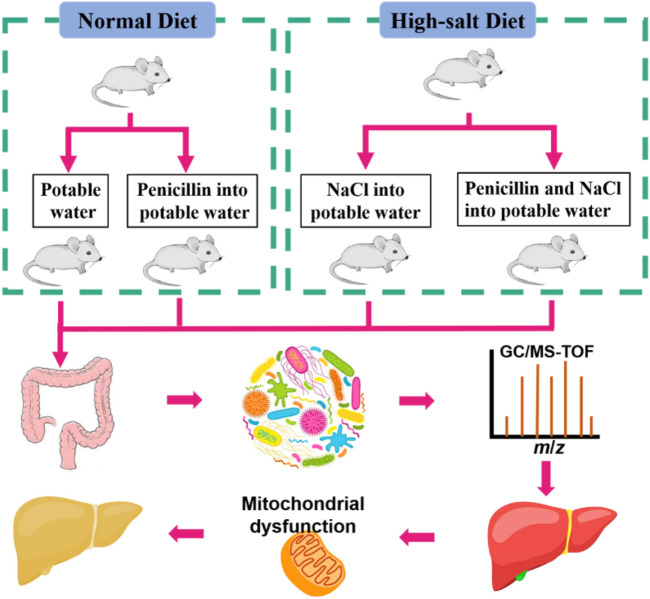
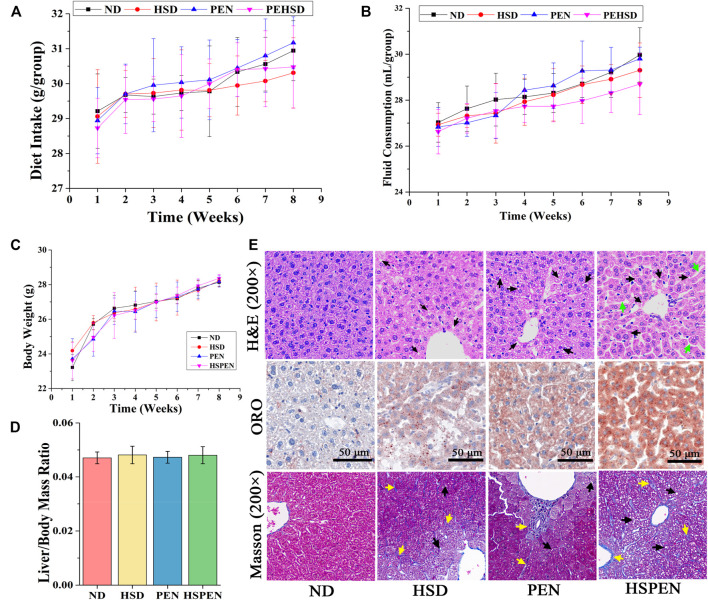
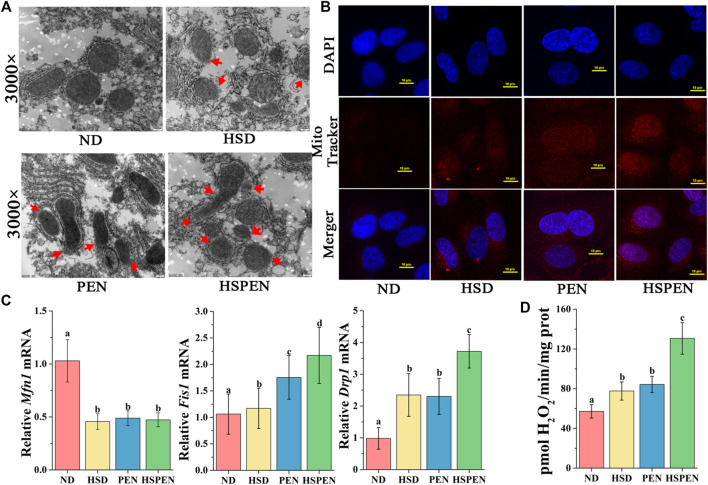
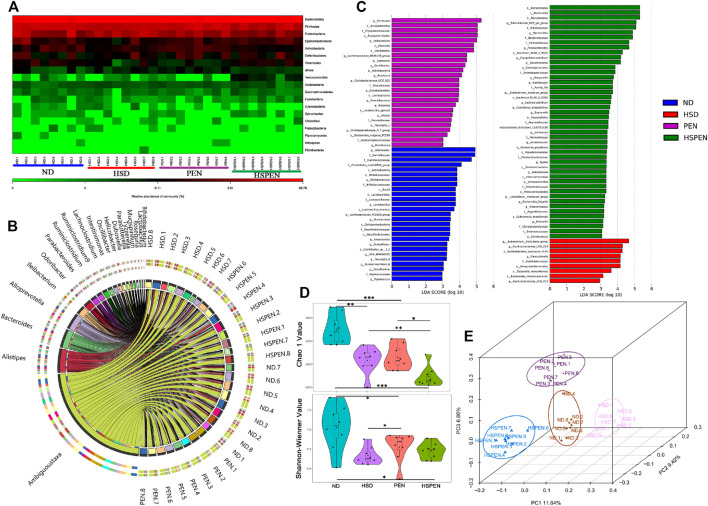
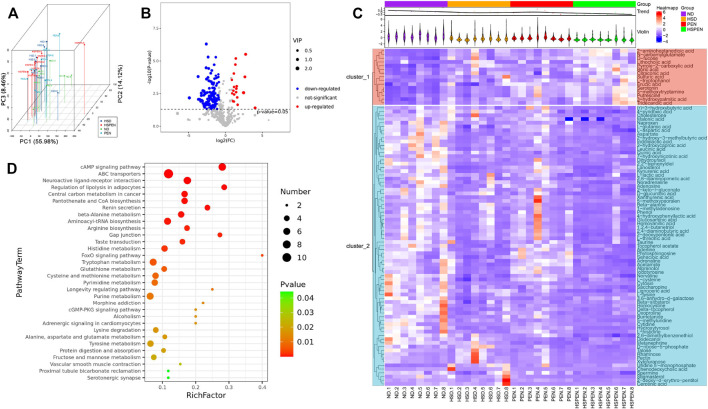
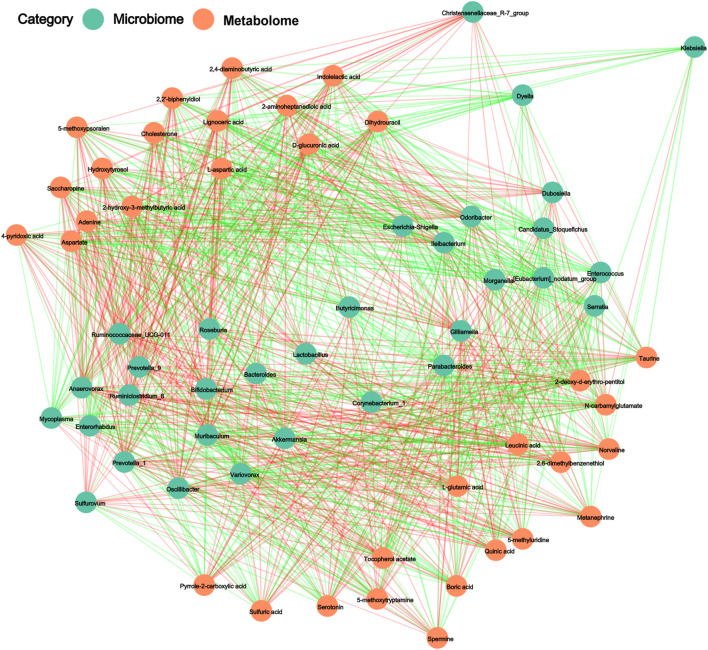
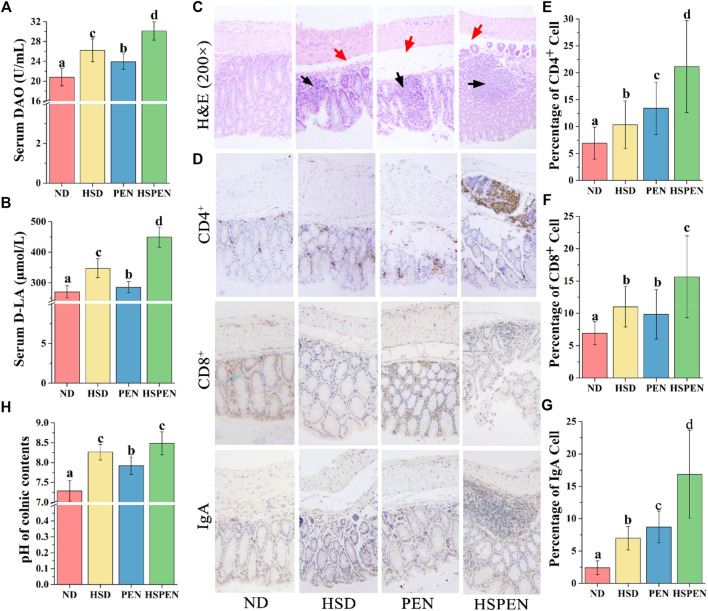
Epidemiological and experimental evidence indicates that antibiotic exposure is related to metabolic malfunctions, such as obesity and non-alcoholic fatty liver disease (NAFLD). Liver impairment and hypertrophy of adipose cells are related to high salt consumption. This research aims to investigated the physiological mechanism of a high salt diet (HSD) enhanced antibiotic-induced hepatic injury and mitochondrial abnormalities in mice. The mice were fed a HSD with or without penicillin G (PEN) for 8 weeks and the gut metabolome, untargeted faecal metabolomics, and intestinal function were evaluated. The results revealed that HSD, PEN and their combination (HSPEN) significantly changed the gut microbial community. HSPEN mice exhibited more opportunistic pathogens (such as Klebsiella and Morganella) and reduced probiotic species (including Bifidobacterium and Lactobacillus). The main variations in the faecal metabolites of the HSPEN group were identified, including those connected with entero-hepatic circulation (including bile acids), tryptophan metabolism (i.e., indole derivatives) and lipid metabolism (e.g., erucic acid). Furthermore, increased intestinal permeability and immunologic response caused greater hepatic damage in the HSPEN group compared to the other groups. These findings may have important implications for public health.
Keywords: antibiotic exposure; gut microbiome; hepatic steatosis; high-salt diet; mitochondrial function.
Copyright © 2022 Zhang, Li, Cui and Chen.
Conflict of interest statement
The authors declare that the research was conducted in the absence of any commercial or financial relationships that could be construed as a potential conflict of interest.
Figures
Similar articles
-
Modulation of the fecal microbiome and metabolome by resistant dextrin ameliorates hepatic steatosis and mitochondrial abnormalities in mice.Food Funct. 2021 May 21;12(10):4504-4518. doi: 10.1039/d1fo00249j. Epub 2021 Apr 22. Food Funct. 2021. PMID: 33885128
-
Combination of Chronic Alcohol Consumption and High-Salt Intake Elicits Gut Microbial Alterations and Liver Steatosis in Mice.J Agric Food Chem. 2020 Feb 12;68(6):1750-1759. doi: 10.1021/acs.jafc.9b07368. Epub 2020 Feb 3. J Agric Food Chem. 2020. PMID: 31971384
-
Ileal Bile Acid Transporter Inhibitor Improves Hepatic Steatosis by Ameliorating Gut Microbiota Dysbiosis in NAFLD Model Mice.mBio. 2021 Aug 31;12(4):e0115521. doi: 10.1128/mBio.01155-21. Epub 2021 Jul 6. mBio. 2021. PMID: 34225483 Free PMC article.
-
The Gut Microbiota and Its Metabolites, Novel Targets for Treating and Preventing Non-Alcoholic Fatty Liver Disease.Mol Nutr Food Res. 2020 Sep;64(17):e2000375. doi: 10.1002/mnfr.202000375. Epub 2020 Aug 10. Mol Nutr Food Res. 2020. PMID: 32738185 Review.
-
Gut Microbiota Metabolites in NAFLD Pathogenesis and Therapeutic Implications.Int J Mol Sci. 2020 Jul 23;21(15):5214. doi: 10.3390/ijms21155214. Int J Mol Sci. 2020. PMID: 32717871 Free PMC article. Review.
Cited by
-
Revealing the Pathogenesis of Salt-Sensitive Hypertension in Dahl Salt-Sensitive Rats through Integrated Multi-Omics Analysis.Metabolites. 2022 Nov 7;12(11):1076. doi: 10.3390/metabo12111076. Metabolites. 2022. PMID: 36355159 Free PMC article.
-
Paracellular permeability and tight junction regulation in gut health and disease.Nat Rev Gastroenterol Hepatol. 2023 Jul;20(7):417-432. doi: 10.1038/s41575-023-00766-3. Epub 2023 Apr 25. Nat Rev Gastroenterol Hepatol. 2023. PMID: 37186118 Free PMC article. Review.
-
Metagenomic Changes of Gut Microbiota following Treatment of Helicobacter pylori Infection with a Simplified Low-Dose Quadruple Therapy with Bismuth or Lactobacillus reuteri.Nutrients. 2022 Jul 6;14(14):2789. doi: 10.3390/nu14142789. Nutrients. 2022. PMID: 35889746 Free PMC article. Clinical Trial.
-
Bile Acid Metabolism Analysis Provides Insights into Vascular Endothelial Injury in Salt-Sensitive Hypertensive Rats.Metabolites. 2024 Aug 16;14(8):452. doi: 10.3390/metabo14080452. Metabolites. 2024. PMID: 39195548 Free PMC article.
References
LinkOut - more resources
Full Text Sources