. 2022 Feb 11:13:812968.
doi: 10.3389/fphys.2022.812968. eCollection 2022.

Methodology for Cross-Talk Elimination in Simultaneous Voltage and Calcium Optical Mapping Measurements With Semasbestic Wavelengths

Affiliations

Methodology for Cross-Talk Elimination in Simultaneous Voltage and Calcium Optical Mapping Measurements With Semasbestic Wavelengths

Ilija Uzelac et al. Front Physiol. .

Abstract

Most cardiac arrhythmias at the whole heart level result from alteration of cell membrane ionic channels and intracellular calcium concentration ([Ca2+] i ) cycling with emerging spatiotemporal behavior through tissue-level coupling. For example, dynamically induced spatial dispersion of action potential duration, QT prolongation, and alternans are clinical markers for arrhythmia susceptibility in regular and heart-failure patients that originate due to changes of the transmembrane voltage (V m) and [Ca2+] i . We present an optical-mapping methodology that permits simultaneous measurements of the V m - [Ca2+] i signals using a single-camera without cross-talk, allowing quantitative characterization of favorable/adverse cell and tissue dynamical effects occurring from remodeling and/or drugs in heart failure. We demonstrate theoretically and experimentally in six different species the existence of a family of excitation wavelengths, we termed semasbestic, that give no change in signal for one dye, and thus can be used to record signals from another dye, guaranteeing zero cross-talk.

Keywords: alternans; fluorescent dyes; intracellular free calcium concentration; isosbestic point; optical mapping; semasbestic wavelength; transmembrane voltage.


Conflict of interest statement

IU is the owner of Aleksa Tech Inc., a manufacturer of power sources for LED illumination in optical mapping measurements. The remaining authors declare that the research was conducted in the absence of any commercial or financial relationships that could be construed as a potential conflict of interest.

Figures

Figure 1
Figure 1
Mechanisms of measurement with an electrochromic Vm dye. (A) The Gaussian absorption (blue) and emission curves (red) are good fits for a given electrochromic Vm dye for illustration purposes, with solid lines for polarized membrane and leftward shifted dotted lines for maximally depolarized membrane by a propagating AP. For excitation at the isosbestic point and for a given LPF on the camera side passing only part of the emission spectra, as illustrated with the solid (black) vertical lines, ΔF/F is always negative. ΔF/F = 0 can only be achieved if the entire emission spectrum is obtained (solid blue vertical line), thereby not dependent on the optical setup, the λLPF value. Excitation left of the isosbestic point results in an amplitude increase of the emission spectra due to absorption coefficient increase with the shift of the absorption spectra. Depending on the filter λLPF, overall ΔF/F sign can be negative or positive, and in between, there is a particular λLPF such that positive change cancels the negative change resulting in ΔF/F = 0, for specific λExc, termed semasbestic wavelength. (B) Theoretically calculated map of ΔF/F magnitude values as a function of λExc and λLPF, showing the transition from positive to negative ΔF/F, and continuous line of semasbestic wavelengths, ΔF/F = 0 isochrone line, for each λExc - λLPF pair. (C) Illustration of the experimental setup. (D) APs from optical mapping measurements on isolated rabbit heart near a semasbestic wavelength. A 10 nm wide BP excitation filter was used of 540 nm nominal center wavelength along different LPFs on the camera's side. Due to low ΔF/F values SNR is low. However, ensemble averaging (stacking) increases SNR without filtering in post-processing. (E) Quadratic fit curves from ΔF/F simulated values (B), for four different LPFs of the same λLPF values as LPF used in ΔF/F measurements on isolated hearts. (F) Quadratic fit curves from ΔF/F magnitude values for four different LPFs. Optical mapping recordings were performed on isolated rabbit heart for across a wide range of excitation wavelengths, from 500 to 660 nm. Zero crossings correspond to the semasbestic wavelengths. All λLPF values of LPFs are experimentally measured.
Figure 2
Figure 2
The semasbestic wavelengths across all experiments for JPW-6003 Vm dye. (A) Box plots are a statistical representation of semasbestic wavelength averaged for each species. The ends of each box are the upper and lower quartiles, with the median marked as a horizontal line inside the box. The whiskers lines represent the upper and lower extremity. The P-values represent results of one-way ANOVA analysis with and without the isosbestic points from isolated pig hearts experiments. (B) The mean values and uncertainties of experimentally obtained semasbestic points across all species for different LFPs used on the camera. (C) A linear curve fit relating the range of semasbestic wavelengths corresponding to different λLPF. (D) Sensitivity analysis near the isosbestic wavelength for different LPFs. Experimentally obtained ΔF/F magnitude values were averaged across all species for the same LPF-BP filter pairs. Excitation wavelengths for up to 10 nm off the semasbestic wavelength result in less than 0.5% in the fractional change of the Vm signal.
Figure 3
Figure 3
Single-camera dual Vm measurements. The Vm dye was excited with alternating excitation bands, using a 660/10 excitation BP filter in even frames. Odd frames were acquired using off-the-shelf excitation BP filters selected to closely match the semasbestic points (λSem) corresponding to the λLPF of the four LPFs. λExc wavelengths are effective excitation wavelengths of the BP filters. Their nominal center wavelengths are listed in Supplementary Figure 3. λExcnom = 525 nm is the nominal center wavelength of 20 nm wide (OD6) BP filter (Semrock). Shown optical action potential signals are obtained using the stacking procedure from a single pixel, averaging at least 400 periods without any filtering. The stacking resolves small Vm signal changes buried under the noise level, which could be interpreted as no change in Vm signal in the odd frames otherwise. The cross-talk, the presence of Vm signal due to the differences between the filters effective excitation wavelength and corresponding semasbestic points is less than 0.25% for most LPF. The sensitivity to the difference is the lowest for λLPF = 740.0 nm, resulting in ΔF/F amplitude of less than 0.25% using excitation wavelength of more than 5 nm different from the ideal semasbestic point.
Figure 4
Figure 4
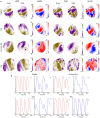
Single-camera dual VmCa measurements in isolated hearts of different species. (A) Arrhythmic effects under dynamic pacing, shown as spatial dispersion of APD and CaD across tissue for different species for even and odd beats. The spatial dispersion indicates an increased susceptibility to arrhythmia. APD values are obtained from 50% signal rise in amplitude till 50% AP repolarization. Numbers to the right indicate 3rd and 97th percentile APD values expressed in milliseconds. CaD values are obtained as the integral from 50% rise in amplitude till 50% decrease. Blue-red patterns show variations in APD and CaD (ΔAPD, ΔCaD) between even and odd beats (discordant alternans), showing regions alternating out of phase and separated with the nodal lines (white lines). Spatially discordant alternans are the counterpart of T-wave ECG alternans, a well-known marker for arrhythmia susceptibility. Although all species do develop arrhythmia under dynamic pacing, the electrophysiology across species is very different. Spatially discordant alternans are the most pronounced in rabbits, while pig hearts show very little APD and CaD dispersion, with insignificant differences between even and odd beats. (B) Vm and Ca representative AP signals showing temporal alternans for different species.
Figure 5
Figure 5
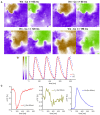
Simultaneous single-camera-based measurements of Vm and Ca signals in isolated cell culture monolayers of neonatal rats. (A) Time-snapshots of Vm - Ca dynamic at different time points illustrating the presence of anchored spiral wave and spatial loss of correlation between propagating Vm wavefront from Ca dynamics. (B) Normalized Vm and Ca signals obtained from processed raw recordings showing Ca signal lagging in time. (C) Representative unfiltered Vm and Ca signal traces with no filtering expressed as a relative change. In cell culture monolayers, Ca signals have significantly higher SNR than Vm signals originating only from the dye bound to the cell membrane. The amount of cross-talk and the presence of Vm signal in Ca signal with excitation at near the semasbestic point (Exc550) results is a small yet negligible cross-talk compared to the amplitudes of the signals.

Similar articles

Cited by

References

    1. Ahmed Z., Connor J. (1979). Measurement of calcium influx under voltage clamp in molluscan neurones using the metallochromic dye arsenazo III. J. Physiol. 286, 61–82. 10.1113/jphysiol.1979.sp012607 - DOI - PMC - PubMed
    1. Aistrup G. L., Balke C. W., Wasserstrom J. A. (2011). Arrhythmia triggers in heart failure: the smoking gun of [Ca2+]i dysregulation. Heart Rhythm 8, 1804–1808. 10.1016/j.hrthm.2011.06.012 - DOI - PubMed
    1. Bachtel A. D., Gray R. A., Stohlman J. M., Bourgeois E. B., Pollard A. E., Rogers J. M. (2011). A novel approach to dual excitation ratiometric optical mapping of cardiac action potentials with di-4-anepps using pulsed led excitation. IEEE Trans. Biomed. Eng. 58, 2120–2126. 10.1109/TBME.2011.2148719 - DOI - PMC - PubMed
    1. Baker B. J., Kosmidis E. K., Vucinic D., Falk C. X., Cohen L. B., Djurisic M., et al. . (2005). Imaging brain activity with voltage-and calcium-sensitive dyes. Cell. Mol. Neurobiol. 25, 245–282. 10.1007/s10571-005-3059-6 - DOI - PMC - PubMed
    1. Balijepalli R. C., Kamp T. J. (2008). Caveolae, ion channels and cardiac arrhythmias. Prog. Biophys. Mol. Biol. 98, 149–160. 10.1016/j.pbiomolbio.2009.01.012 - DOI - PMC - PubMed