. 2022 Feb 9:12:812391.
doi: 10.3389/fmicb.2021.812391. eCollection 2021.

Antiretroviral Imprints and Genomic Plasticity of HIV-1 pol in Non-clade B: Implications for Treatment

Affiliations

Antiretroviral Imprints and Genomic Plasticity of HIV-1 pol in Non-clade B: Implications for Treatment

Jude S Bimela et al. Front Microbiol. .

Abstract

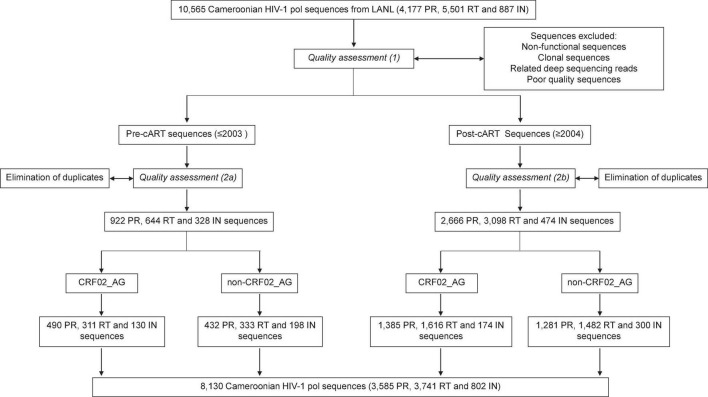
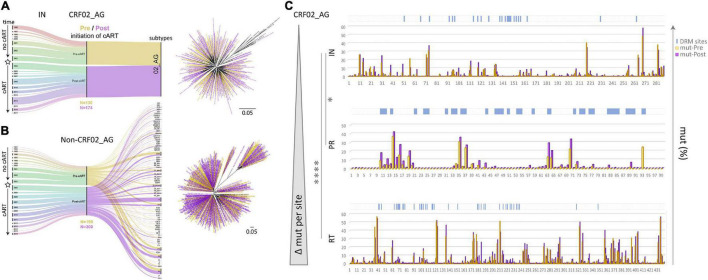
Combinational antiretroviral therapy (cART) is the most effective tool to prevent and control HIV-1 infection without an effective vaccine. However, HIV-1 drug resistance mutations (DRMs) and naturally occurring polymorphisms (NOPs) can abrogate cART efficacy. Here, we aimed to characterize the HIV-1 pol mutation landscape in Cameroon, where highly diverse HIV clades circulate, and identify novel treatment-associated mutations that can potentially affect cART efficacy. More than 8,000 functional Cameroonian HIV-1 pol sequences from 1987 to 2020 were studied for DRMs and NOPs. Site-specific amino acid frequencies and quaternary structural features were determined and compared between periods before (≤2003) and after (2004-2020) regional implementation of cART. cART usage in Cameroon induced deep mutation imprints in reverse transcriptase (RT) and to a lower extent in protease (PR) and integrase (IN), according to their relative usage. In the predominant circulating recombinant form (CRF) 02_AG (CRF02_AG), 27 canonical DRMs and 29 NOPs significantly increased or decreased in RT during cART scale-up, whereas in IN, no DRM and only seven NOPs significantly changed. The profound genomic imprints and higher prevalence of DRMs in RT compared to PR and IN mirror the dominant use of reverse transcriptase inhibitors (RTIs) in sub-Saharan Africa and the predominantly integrase strand transfer inhibitor (InSTI)-naïve study population. Our results support the potential of InSTIs for antiretroviral treatment in Cameroon; however, close surveillance of IN mutations will be required to identify emerging resistance patterns, as observed in RT and PR. Population-wide genomic analyses help reveal the presence of selective pressures and viral adaptation processes to guide strategies to bypass resistance and reinstate effective treatment.

Keywords: CRF02_AG; HIV-1 polymerase (pol); antiretroviral imprints; genomic plasticity; naturally occurring polymorphisms (NOPs); non-clade B drug resistance mutations (DRMs); reverse transcriptase inhibitors (RTI) versus integrase strand transfer inhibitors (INSTI); treatment intensification in Cameroon.


Conflict of interest statement

The authors declare that the research was conducted in the absence of any commercial or financial relationships that could be construed as a potential conflict of interest. The funders had no role in the design or conduct of the study.

Figures

FIGURE 1
FIGURE 1
Study flow diagram. Summary of sequence filtering and quality assessment of Cameroonian RT, PR, and IN sequences.
FIGURE 2
FIGURE 2
HIV-1 lineage distribution in Cameroon according to HIV-1 pol IN sequences from 1991 until 2020. Stream graph of lineage distribution of Cameroonian HIV-1 pol IN sequences (y-axis). All available IN full-length sequences (HxB2 position bp 4,230–5,093, n = 802) from the LANL database are shown, as of November 3rd, 2020, after excluding non-functional, poor-quality, duplicate, and clonal sequences. HIV-1 subtypes, recombinant forms, and groups are color-coded according to the legend to the right, and the most prevalent lineages are also annotated in the graph. The star and dashed line indicate the year when combinational antiretroviral treatment was implemented in Cameroon.
FIGURE 3
FIGURE 3
Data segregation, phylogenetic analysis, and comparison of drug resistance mutations and naturally occurring polymorphisms in Cameroonian HIV-1 pol IN, PR, and RT sequences before and after regional implementation of cART. (A,B) HIV-1 IN sequences from Cameroonian HIV-1-infected individuals (as in Figure 2) were segregated into CRF02_AG (A) and non-CRF02_AG data sets (B). The data set composition by sampling year and lineage/subtype is summarized in alluvial diagrams. Asterisks indicate the subcategorization of sequences collected pre- and post-implementation of cART in Cameroon (2004) along the timeline; sequences are colored yellow (Pre) and purple (Post), respectively. Pre and Post sample numbers are indicated below the plots. Phylogenetic placement of Pre and Post sequences is shown in maximum-likelihood RAxML trees with the same yellow/purple color code. The scale indicates a 5% genetic distance. (C) Comparison of site-specific frequencies of mutations (mut) including naturally occurring polymorphisms (NOP) in Cameroonian HIV-1 pol IN, PR, and RT sequences before and after regional implementation of cART. CRF02_AG consensus sequences (derived from the pre-cART data sets) served as references to summarize all amino acid mutations per site. Their relative frequencies (%) are compared side-by-side for Pre and Post data sets in bar graphs. Locations of canonical DRMs (according to the Stanford drug resistance database, November 2020) are indicated with blue ticks on top of the charts. The bar charts are sorted from top to bottom according to increasing mutational difference from Pre to Post per site. Stars indicate statistical differences in a Kruskal Wallis test with Dunn’s multiplicity correction (* < 0.05, **** < 0.0001).
FIGURE 4
FIGURE 4
Canonical drug resistance mutations of HIV-1 RT and IN sequences from Cameroon before and after regional implementation of cART. (A,B) Comparison of site-specific frequencies at canonical drug resistance mutation (mut) sites in Cameroonian HIV-1 pol RT (left) and IN sequences (right) before (yellow, Pre) and after (purple, Post) regional implementation of cART. CRF02_AG consensus sequences (derived from pre-cART data sets) served as references to call mut variants per site. The dominant (consensus) amino acid is indicated for each site, followed by the position in RT. X indicates any mutation/minority variant. Below the bar chart, weblogos of amino acid occurrences per site are shown for both Pre and Post data sets. Sites at which DRM frequencies increased by more than 10% from pre- to post-cART period are boxed. (C,D) Same selection of all canonical DRM sites in RT and IN [as in (A,B), referring to blue annotations in Figure 3]. On the y-axis, the difference in mut percentage (Δ mut) between Post and Pre is indicated for each site, with increasing mut frequencies from Pre to Post shown as positive values (dark gray bars) and decreasing frequencies shown as negative values (light gray bars). The mirror bar chart below indicates all amino acid (aa) changes according to the bottom’s aa color code. The 4-row color strips on top indicate differences between CRF02_AG consensus sequences and HxB2 (green), sites of canonical drug resistance mut (DRM) sites (blue), and statistically significant differences between Pre and Post in Fisher Exact tests (P values) and false discovery rates (FDR, q values), according to the legend to the right.
FIGURE 5
FIGURE 5
The emergence of treatment-associated mutations in RT, but not in IN of Cameroonian HIV-1 CRF02_AG sequences during years of cART scale-up. (A,B) Comparison of site-specific frequencies in HIV-1 pol RT (left) and IN sequences (right) before (yellow, Pre) and after (purple, Post) regional implementation of cART. All sites are shown that have not been linked with canonical drug resistance and that exhibit changes in mutation (mut) frequencies from to Pre to Post yielding P values < 0.05 [see also (C,D)]. CRF02_AG consensus sequences (derived from pre-cART data sets) served as references to call mut variants per site. The dominant (consensus) amino acid is indicated for each site, followed by the position in RT. X indicates any mutation/minority variant. Below the bar chart, weblogos of amino acid occurrences per site are indicated from both Pre and Post data sets. Sites at which mutation frequencies increased by more than 10% from the pre- to post-cART period are boxed. (C,D) Same selection of RT and IN sites as in (A,B). On the y-axis, the difference in mut percentage (Δ mut) between Post and Pre is indicated for each site, with increasing mut frequencies from Pre to Post shown as positive values (dark gray bars) and decreasing frequencies shown as negative values (light gray bars). The mirror bar chart below indicates all amino acid (aa) changes according to the aa color code at the bottom. The 4-row color strips on top indicate differences between CRF02_AG consensus sequences and HxB2 (green), sites of canonical drug resistance mut (DRM) sites (blue), and statistically significant differences between Pre and Post in Fisher Exact tests (P values) and false discovery rates (FDR, q values), according to the legend to the right.
FIGURE 6
FIGURE 6
Linked emergence of mutations in CRF02_AG pol RT and PR. Chord diagram illustrating the network of linear correlations among mutations in RT and PR that changed significantly (increase or decrease) from the period before (pre-cART) to after (post-cART) implementation of combinational antiretroviral treatment in Cameroon (2004). The bar plot on the outer track displays the mutation frequencies of the mutations in the respective period. Pairwise correlations are shown as chords between connected variables, i.e., mutations, in the center of the plot. Chords are color-coded according to the magnitude of the correlation coefficient (r); chord width inversely corresponds to the P-value. Two-tailed Spearman rank tests were performed and P values were adjusted for multiple comparisons using the Benjamini-Hochberg method. Among the full set of linear correlations (see Supplementary Figure 8), only significant links/chords are shown, and mutations without a significant link (P < 0.05) to another mutation were removed.
FIGURE 7
FIGURE 7
Structural and statistical analysis of emerging mutations in Non-CRF02_AG. (A) Sites of significantly increasing or decreasing (P Fisher < 0.05) treatment-associated mutations in RT (left) and PR (right) are projected onto RT and PR structures. Calculations of site-specific mutation increases/decreases in Non-CRF02_AG between pre- and post-cART periods are shown below. Detailed views of the drug-binding regions with annotated aa sites are shown in boxes to the right. Treatment-associated mutation residues are displayed as magenta or gray spheres, according to a significant increase or decrease from pre- to post-cART, respectively (P < 0.05). (B) Calculation of site-specific mutation differences in Non-CRF02_AG for canonical DRM sites. Bars are displayed in blue or gray according to a significant increase or decrease from pre- to post-cART, respectively (P < 0.05). (C) Calculation of site-specific mutation differences in Non-CRF02_AG for the IN region, both for canonical DRM sites (left) and emerging treatment-associated mutations (right). The 4-row color strips indicate differences between CRF02_AG consensus sequences and HXB2 (green), sites of canonical drug resistance mut (DRM) sites (blue), and statistically significant mutation differences between pre- and post-cART periods in Fisher Exact tests (P values) and false discovery rates (FDR, q values), according to the legend to the right.
FIGURE 8
FIGURE 8
Structural and time-series analysis of DRMs and emerging treatment-associated mutations in CRF02_AG pol RT. (A) Sites of significantly increasing canonical drug resistance mutations (DRMs) (left) and emerging treatment-associated mutations (right), as identified in Figures 4, 5, are projected onto a complex RT structure. Detailed views of the drug-binding regions with annotated aa sites are shown in boxes to the right, and an orange oval highlights the active center. The RT models were generated using crystal structures of RT with DNA and the NRTI AZT-TP (PDB 3V4I) and RT with DNA and the NNRTI nevirapine (PDB 3V81). The nevirapine (blue) and AZT-TP (orange) molecules were placed together for illustration purposes (using structural overlay in Chimera). DRM residues are displayed as blue or gray spheres, according to a significant increase or decrease from pre- to post-cART periods, respectively (P < 0.05, according to Figure 4). Accordingly, treatment-associated mutation residues are displayed as magenta or gray spheres, according to a significant increase or decrease from pre- to post-cART, respectively (P < 0.05, according to Figure 5). (B) The effect of selected canonical DRMs (most prevalent in Cameroon and/or highest mutational scoring) and all significantly emerging CRF02_AG treatment-associated mutations on three different published RT protein structures were analyzed with the Cartesian ddg application (Rosetta). ddG values > 1 and < 1 are characteristic for destabilizing and stabilizing mutations, respectively. Mutations are listed from left to right according to increasing destabilizing effects. (C) Time-series analysis of significantly increasing mutations in HIV-1 CRF02_AG pol RT during cART scale-up in Cameroon. Streamgraphs in silhouette mode display mutations among the studied sequence on the y-axis along the timeline on the x-axis. The gray-green color indicates the absence of mutations (and the presence of the dominant aa residue). According to the legend to the right, other colors indicate the presence of mutations/minority variants. The RT aa site and its dominant/consensus aa are indicated to the left of each streamgraph. Shown is a selection of two canonical drug resistance mutation sites (left) and two emerging treatment-associated mutation sites (right) with a significant increase in mutations over time. Asterisks and dashed lines mark the time point of cART implementation in Cameroon.

References

    1. Abagyan R., Totrov M., Kuznetsov D. (1994). ICM - a new method for protein modeling and design - applications to docking and structure prediction from the distorted native conformation. J. Comput. Chem. 15:488.
    1. Aghokeng A. F., Kouanfack C., Laurent C., Ebong E., Atem-Tambe A., Butel C., et al. (2011). Scale-up of antiretroviral treatment in sub-Saharan Africa is accompanied by increasing HIV-1 drug resistance mutations in drug-naive patients. AIDS 25 2183–2188. 10.1097/QAD.0b013e32834bbbe9 - DOI - PubMed
    1. Barouch-Bentov R., Sauer K. (2011). Mechanisms of drug resistance in kinases. Expert Opin. Investig. Drugs 20 153–208. - PMC - PubMed
    1. Bertoni M., Kiefer F., Biasini M., Bordoli L., Schwede T. (2017). Modeling protein quaternary structure of homo- and hetero-oligomers beyond binary interactions by homology. Sci. Rep. 7:10480. 10.1038/s41598-017-09654-8 - DOI - PMC - PubMed
    1. Bourgeois A., Laurent C., Mougnutou R., Nkoué N., Lactuock B., Ciaffi L., et al. (2005). Field assessment of generic antiretroviral drugs: a prospective cohort study in Cameroon. Antiviral Ther. 10 335–341. - PubMed