. 2022 Feb 10:13:784528.
doi: 10.3389/fimmu.2022.784528. eCollection 2022.

Anti-Mouse CD83 Monoclonal Antibody Targeting Mature Dendritic Cells Provides Protection Against Collagen Induced Arthritis

Affiliations

Anti-Mouse CD83 Monoclonal Antibody Targeting Mature Dendritic Cells Provides Protection Against Collagen Induced Arthritis

Pablo A Silveira et al. Front Immunol. .

Abstract

Antibodies targeting the activation marker CD83 can achieve immune suppression by targeting antigen-presenting mature dendritic cells (DC). This study investigated the immunosuppressive mechanisms of anti-CD83 antibody treatment in mice and tested its efficacy in a model of autoimmune rheumatoid arthritis. A rat anti-mouse CD83 IgG2a monoclonal antibody, DCR-5, was developed and functionally tested in mixed leukocyte reactions, demonstrating depletion of CD83+ conventional (c)DC, induction of regulatory DC (DCreg), and suppression of allogeneic T cell proliferation. DCR-5 injection into mice caused partial splenic cDC depletion for 2-4 days (mostly CD8+ and CD83+ cDC affected) with a concomitant increase in DCreg and regulatory T cells (Treg). Mice with collagen induced arthritis (CIA) treated with 2 or 6 mg/kg DCR-5 at baseline and every three days thereafter until euthanasia at day 36 exhibited significantly reduced arthritic paw scores and joint pathology compared to isotype control or untreated mice. While both doses reduced anti-collagen antibodies, only 6 mg/kg achieved significance. Treatment with 10 mg/kg DCR-5 was ineffective. Immunohistological staining of spleens at the end of CIA model with CD11c, CD83, and FoxP3 showed greater DC depletion and Treg induction in 6 mg/kg compared to 10 mg/kg DCR-5 treated mice. In conclusion, DCR-5 conferred protection from arthritis by targeting CD83, resulting in selective depletion of mature cDC and subsequent increases in DCreg and Treg. This highlights the potential for anti-CD83 antibodies as a targeted therapy for autoimmune diseases.

Keywords: CD83; antigen presentation; collagen induced arthritis (CIA); dendritic cells; monoclonal antibody; mouse; regulatory T cells.


Conflict of interest statement

PS, XJ, T-HL, AR and FK work for the Dendritic Cell Research laboratory which received sponsored research funding from Kira Biotech to undertake work quoted in this paper. HR derived a salary from Kira Biotech and has equity in the company. DB is a Director of Kira Biotech Pty Ltd. and has equity in the company. GC is a Non-Executive Director of Kira Biotech Pty Ltd. and Dendrocyte Pty Ltd. which has equity in Kira Biotech Pty Ltd. GC is Group Leader of the Dendritic Cell Research laboratory which received sponsored research funding to undertake work quoted in this paper. W-HH and H-TC declare no conflicts of interest.

Figures

Figure 1
Figure 1
Binding properties of rat anti-mouse CD83 antibodies DCR-5 and DCR-3. (A) Comparison of binding of DCR-5, DCR-3 and Michel-19 anti-CD83 antibody clones (1:10 serial dilutions starting at 100 µg/ml) to plates coated with recombinant mouse CD83-His by ELISA. Dashed line marks the absorbance in the no antibody control. Binding of 20 µg/ml Michel-19, DCR-3 or DCR-5 antibody (or respective isotype controls) was compared on the surface of (B) gated cDC and B cells (see Supplementary Figure 1A for gating strategy) in WT and CD83KO splenocytes cultured overnight with 1 µg/ml LPS or; (C) gated FoxP3-CD25- (naïve) and CD25+ (activated) CD8+ T cell cells and FoxP3CD25 (naïve), FoxP3CD25+ (activated) and FoxP3+CD25+ (Treg) CD4+ T cell subsets cultured with or without overnight stimulation with CD3/CD28 microbeads. Primary antibodies were detected using an anti-rat IgG (Fc-specific)-AF488 antibody via flow cytometry. Percentage of CD83+ cells in CD3/28 stimulated cultures shown. No CD8+CD25+ T cells detected in unstimulated cultures. (D) Binding of sub-saturating concentrations of FITC conjugated Michel-19 or DCR-3 to LPS stimulated A20 cells by flow cytometry was compared with and without initial blockade with saturating concentrations of purified Michel-19, DCR3 or DCR-5. Degree of blocking was calculated as percentage reduction in MFI with 0% indicating no blocking (MFI equivalent to anti-CD83 FITC antibody alone) and 100% indicating full blocking (MFI equivalent to binding of isotype-FITC antibody).
Figure 2
Figure 2
DCR-5 depletes and alters DC phenotype in vitro. (A–D) B6 and BALB/c splenocytes were cocultured overnight in MLR at a 1:1 ratio with the indicated concentrations of DCR-5 or isotype control. Levels of DC and B cells per well were determined by flow cytometry. (A) Representative plots showing total DC and B cells in specified groups and (B) mean levels of total, B6 (H-2Kd) and BALB/c (H-2Kd+) derived cells from triplicate wells. Statistical comparisons to no antibody group by 2-way ANOVA. (C) Mean percentage of DC in 12 wells from 3 experiments treated with no antibody or 10 µg/ml DCR-5, DCR-3 or isotype controls. Statistical comparisons by 2-way ANOVA. *p < 0.05, **p < 0.01, ***p < 0.001 and ****p < 0.0001. (D) One of three representative plots of designated surface and intracellular DCreg markers expressed by total DC after overnight MLR culture with 20 µg/ml DCR-5 or isotype control.
Figure 3
Figure 3
DCR-5 prevents T cell proliferation in vitro. BALB/c and CTV-labeled B6 splenocytes were cocultured for 84 h in MLR at a 1:1 ratio with 20 µg/ml DCR-5, DCR-3, isotype controls or no antibody. Proliferation of gated CD3+CD4+ or CD8+ B6 T cells was determined by CTV dilution. (A) Representative histograms showing % divided CD4+ and CD8+ T cells in indicated groups. (B) Mean levels of division in triplicate wells. Statistical comparison was determined using 2-way ANOVA. (C) Summary of five MLR experiments where T cell proliferation is represented as % of no antibody control. Statistical comparison was determined using a paired T-test. (D) CD4+ T cell proliferation and (E) cytokines in supernatant of B6 × BALB/c MLR treated with the indicated DCR-5 concentrations or 40 µg/ml isotype control after 84 h (n = 3). Cytokine data is shown as fold change compared to mean of no antibody control (dashed line). (F) Percentage of total cells, CD3+CD4+FoxP3 (Tcon) CD3+CD4+FoxP3+ (Treg) T cells and CD11c+ IAIE+ (DC) that stained IL-10+ by intracellular flow cytometry staining after 48 h culture of B6 × BALB/c MLR with 20 µg/ml DCR-5, isotype control or no antibody. Statistical comparison to isotype control was assessed by one-way ANOVA. *p < 0.05, **p < 0.01, ***p < 0.001 and ****p < 0.0001.
Figure 4
Figure 4
In vivo treatment of mice with DCR-5 results in depletion of DC. B6 mice treated with a single i.p. injection of increasing doses of DCR-5 mAb or 250 µg rat IgG2a isotype control were analyzed 48 h later for DC depletion and Treg induction by flow cytometry. (A) Flow cytometry plots showing splenic DC populations in untreated, 250 µg DCR-5 and 250 µg isotype control treated mice. The Lin+/IAIE+ gate shown contains >98% CD45R+ B cells ( Supplementary Figure 1A ). Graphs showing (B) frequency and (C) total numbers of DC populations in spleens of mice of all treatment groups. P <0.001 variance for treatment, 2-way ANOVA. (D) Combined data from four experiments showing frequency of DC populations in B6 mice treated with 250 µg DCR-5 or isotype control. Statistical comparison was determined using T-tests. *p < 0.05, ***p < 0.001 and ****p < 0.0001.
Figure 5
Figure 5
Phenotype of CD80hiCD86hi DC population induced by DCR-5 in vivo. Flow cytometric expression of additional markers (histograms on right) on the populations gated in the left plots including the CD80hi/CD86hi cDC subset induced after 48 h i.p. treatment with 250 µg DCR-5 antibody (red oval gate) compared to remaining CD80±/CD86± splenic cDC in DCR-5 (black rectangular gate) or isotype control (blue rectangular gate) treated mice.
Figure 6
Figure 6
In vivo treatment of mice with DCR-5 results in induction of Treg. B6 mice treated with a single i.p. injection of increasing doses of DCR-5 mAb or 250 µg rat IgG2a isotype control were analysed 48 h later for T cell subsets by flow cytometry. (A) Flow cytometry plots in one experiment showing T cell populations in spleens of untreated, 250 µg DCR-5 and isotype control mice. Total numbers of splenic (B) CD4+ T cells, (C) CD8+ T cells and (D) Tregs and (E) Treg as a percentage of CD4+ T cells in mice treated with increasing DCR-5 doses. No significant difference for CD4 or CD8 T cell numbers and p <0.0001 for Tregs numbers and proportion in combined DCR-5 versus isotype treated or untreated mice (one-way ANOVA). (F) Combined data from five experiments showing increase in Treg (as percentage of CD4+ T cells) in mice treated with 150–250 µg DCR-5 or isotype control. Statistical comparison was determined using a T-test. ****p < 0.0001. (G) Treg suppression assay showing proliferation of CFSE labeled CD45.1+CD4+ Tcon purified from B6.Ptprca mouse spleens cocultured with anti-CD3/28 beads and the indicated ratios of CD4+CD25+ Tregs isolated from spleens of B6 mice after 48h treatment with 150 µg DCR-5 or isotype control i.p. All groups (n = 3) compared to Tcon only group by one-way ANOVA. *p < 0.05 and **p < 0.01. Correlation of (H) total cDC vs. CD80hi/86hi cDC, (I) total cDC vs. Treg and (J) CD80hi/86hi cDC vs. Treg frequencies in spleens of DCR-5 treated mice. All correlations were p <0.0001 (Pearson correlation coefficient). Non-linear regression exponential curve fits shown.
Figure 7
Figure 7
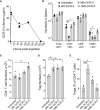
Longevity of in vivo DCR-5 effects on DC and Treg. B6 mice were treated with a single i.p. injection of 150 µg of DCR-5 mAb. At the indicated timepoints post-injection, analysis of (A) DCR-5 concentration in serum by ELISA and total numbers of splenic (B) DC populations, (C) CD4+ T cells, (D) Treg and (E) Treg as a percentage of CD4+ T cells by flow cytometry was performed. Statistical comparison to untreated group was determined using one way ANOVA. *p < 0.05, **p < 0.01 and ***p < 0.001.
Figure 8
Figure 8
DCR-5 binding to FL-DC population induces DCReg. (A) Flow cytometry plots showing gating of cultured B6 FL-DC cDC and pDC subsets after overnight culture with 20 µg/ml DCR-5, isotype control or no treatment and (B) histograms comparing their expression of maturation markers. (C) Representative histograms and (D) graph displaying flow cytometric intracellular expression (MFI) of IDO1 in FL-DC cDC subsets treated as above (n = 3). (E) Concentration of IL-10 in supernatants (n = 3) of FL-DC cultured for 48 h with 20 µg/ml DCR-5, isotype control or no antibody in the absence or presence of LPS stimulation. Dotted line shows limit of detection. (F) Representative contour plots and (G) graph (n = 3) of H-2Kd+CD4+CD25+FoxP3+ Treg generated from purified naïve BALB/c splenic T cells cultured at an 8:1 ratio for 3 days with washed B6 FL-DC after overnight treatment with DCR-5, isotype control or no treatment. (H) Graphs comparing CD25+ FoxP3 T cells and (I) proliferated CFSE labeled CD4+ T cells in the same experiment. All groups compared by one-way ANOVA. ****p < 0.0001.
Figure 9
Figure 9
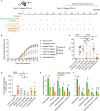
Assessment of DCR-5 efficacy in CIA model. (A) Schema of CIA model and treatment regimes in five cohorts of 12 DBA/1 female mice. An additional four mice were not immunized with type II collagen in CFA as a naïve control cohort. (B) Mean arthritis clinical score per paw over time and (C) area under the curve (AUC) for each individual mouse (lines mark mean). Statistically significant differences at individual timepoints (in parentheses) and AUC were performed using one-way ANOVA. Significantly different timepoints outlined in parentheses. (D) Anti-collagen antibodies in serum at end of experiment were determined by ELISA. Statistical comparison of samples was determined by one-way ANOVA. (E) Mean paw and (F) knee score for each histopathology parameter in 6 mg/kg DCR-5 group versus the isotype control treated group at sacrifice. Statistical comparison of samples was determined by Mann–Whitney test. *p < 0.05, **p < 0.01 and ****p < 0.0001.
Figure 10
Figure 10
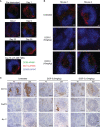
DCR-5 treatment decreases CD11c staining and increases FoxP3 staining in spleens of CIA mice. (A, B) Immunofluorescence histology of splenic follicles showing CD83 detected with biotinylated Michel-19 clone together with CD11c and B220 marking DC and B cells, respectively. (A) Shows representative ×20 images from one of two DBA/1 mice euthanized pre-immunization or on the indicated days post-immunization of collagen. A control stain omitting the anti-CD83 primary antibody but including the Streptavidin-AF488 secondary is shown. Scale bars mark 50 µm. (B) Shows representative ×20 images of splenic follicles from two of four mice from untreated, 6 mg/kg or 10 mg/kg DCR-5 treated groups described in Figure 9 . Scale bars mark 50 µm (C) Immunohistochemistry of adjacent spleen sections stained with biotinylated CD11c, FoxP3 antibodies or secondary streptavidin-HRP only. Representative ×4 image and marked inset at ×20 from one of four mice in untreated, 6 and 10 mg/kg DCR-5 treated groups are shown. Scale bars mark 500 and 50 µm in ×4 and ×20 photographs, respectively.
Figure 11
Figure 11
Schematic of mechanisms of anti-CD83 mAb mediated immune suppression leading to protection from arthritis.

Similar articles

Cited by

References

    1. Durai V, Murphy KM. Functions of Murine Dendritic Cells. Immunity (2016) 45(4):719–36. doi: 10.1016/j.immuni.2016.10.010 - DOI - PMC - PubMed
    1. Waisman A, Lukas D, Clausen BE, Yogev N. Dendritic Cells as Gatekeepers of Tolerance. Semin Immunopathol (2017) 39(2):153–63. doi: 10.1007/s00281-016-0583-z - DOI - PubMed
    1. Thomson AW, Ezzelarab MB. Regulatory Dendritic Cells: Profiling, Targeting, and Therapeutic Application. Curr Opin Organ Transplant (2018) 23(5):538–45. doi: 10.1097/MOT.0000000000000565 - DOI - PMC - PubMed
    1. Ness S, Lin S, Gordon JR. Regulatory Dendritic Cells, T Cell Tolerance, and Dendritic Cell Therapy for Immunologic Disease. Front Immunol (2021) 12:633436. doi: 10.3389/fimmu.2021.633436 - DOI - PMC - PubMed
    1. Raich-Regue D, Glancy M, Thomson AW. Regulatory Dendritic Cell Therapy: From Rodents to Clinical Application. Immunol Lett (2014) 161(2):216–21. doi: 10.1016/j.imlet.2013.11.016 - DOI - PMC - PubMed

Publication types

Substances