

Serum Eicosanoids Metabolomics Profile in a Mouse Model of Renal Cell Carcinoma: Predicting the Antitumor Efficacy of Anlotinib
- PMID: 35222406
- PMCID: PMC8863591
- DOI: 10.3389/fimmu.2022.824607
Serum Eicosanoids Metabolomics Profile in a Mouse Model of Renal Cell Carcinoma: Predicting the Antitumor Efficacy of Anlotinib
Abstract
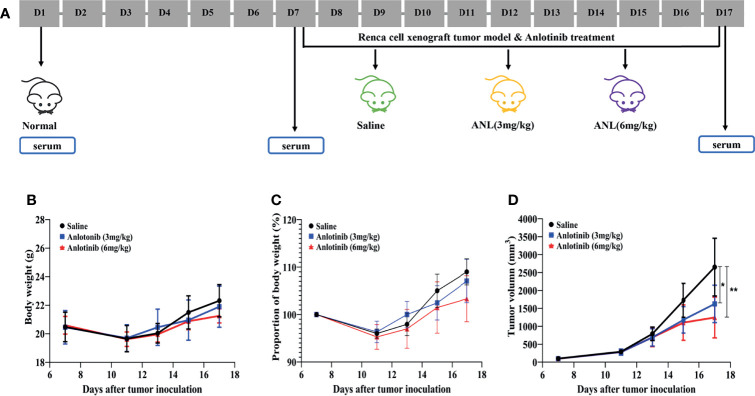
Anlotinib (ANL) shows promising efficacy in patients with renal cell cancer (RCC). Here, for the first time, a serum eicosanoid metabolomics profile and pharmacodynamics in Renca syngeneic mice treated with ANL was performed and integrated using our previous HPLC-MS/MS method and multivariate statistical analysis. The tumor growth inhibition rates of ANL were 39% and 52% at low (3 mg/kg) and high (6 mg/kg) dose levels, without obvious toxicity. A total of 15 disturbed metabolites were observed between the normal group and the model group, and the intrinsic metabolic phenotype alterations had occurred due to the treatment of ANL. A total of eight potential metabolites from the refined partial least squares (PLS) model were considered as potential predictive biomarkers for the efficacy of ANL, and the DHA held the most outstanding sensitivity and specificity with an area under the receiver operating characteristic curve of 0.88. Collectively, the results of this exploratory study not only provide a powerful reference for understanding eicosanoid metabolic reprogramming of ANL but also offer an innovative perspective for the development of therapeutic targets and strategies, the discovery of predictive biomarkers, and the determination of effective tumor monitoring approaches.
Keywords: anlotinib; eicosanoids; metabolomics; pharmacodynamics; renal cell carcinoma.
Copyright © 2022 Du, Xuan, Hu, An and Liu.
Conflict of interest statement
The authors declare that the research was conducted in the absence of any commercial or financial relationships that could be construed as a potential conflict of interest.
Figures


Similar articles
-
Simultaneous quantitative determination of arachidonic acid and cascade metabolites in rat serum by UPLC-MS/MS: application for longitudinal metabolomics of anlotinib.Analyst. 2020 Jul 21;145(14):4972-4981. doi: 10.1039/d0an00867b. Epub 2020 Jun 9. Analyst. 2020. PMID: 32515434
-
Spectrum evaluation-assisted eicosanoid metabolomics for global eicosanoid profiling in human vascular endothelial cells.Clin Exp Pharmacol Physiol. 2018 Jan;45(1):98-108. doi: 10.1111/1440-1681.12825. Epub 2017 Sep 18. Clin Exp Pharmacol Physiol. 2018. PMID: 28755503
-
Predictive model for recurrence of renal cell carcinoma by comparing pre- and postoperative urinary metabolite concentrations.Cancer Sci. 2022 Jan;113(1):182-194. doi: 10.1111/cas.15180. Epub 2021 Nov 10. Cancer Sci. 2022. PMID: 34710258 Free PMC article.
-
Role of metabolomics-derived biomarkers to identify renal cell carcinoma: a comprehensive perspective of the past ten years and advancements.Expert Rev Mol Diagn. 2020 Jan;20(1):5-18. doi: 10.1080/14737159.2020.1704259. Epub 2019 Dec 16. Expert Rev Mol Diagn. 2020. PMID: 31825678 Review.
-
Metabolomics in renal cell carcinoma: From biomarker identification to pathomechanism insights.Arch Biochem Biophys. 2020 Nov 30;695:108623. doi: 10.1016/j.abb.2020.108623. Epub 2020 Oct 8. Arch Biochem Biophys. 2020. PMID: 33039388 Review.
Cited by
-
Off-label use of anlotinib in malignancies' treatment: efficacy and management of adverse reactions.Pharmacol Rep. 2025 Apr;77(2):392-408. doi: 10.1007/s43440-025-00700-1. Epub 2025 Feb 3. Pharmacol Rep. 2025. PMID: 39899257 Free PMC article. Review.
References
MeSH terms
Substances
LinkOut - more resources
Full Text Sources
Medical