. 2022 Feb 9:13:832645.
doi: 10.3389/fimmu.2022.832645. eCollection 2022.

Armored BCMA CAR T Cells Eliminate Multiple Myeloma and Are Resistant to the Suppressive Effects of TGF-β

Affiliations

Armored BCMA CAR T Cells Eliminate Multiple Myeloma and Are Resistant to the Suppressive Effects of TGF-β

Leah M Alabanza et al. Front Immunol. .

Abstract

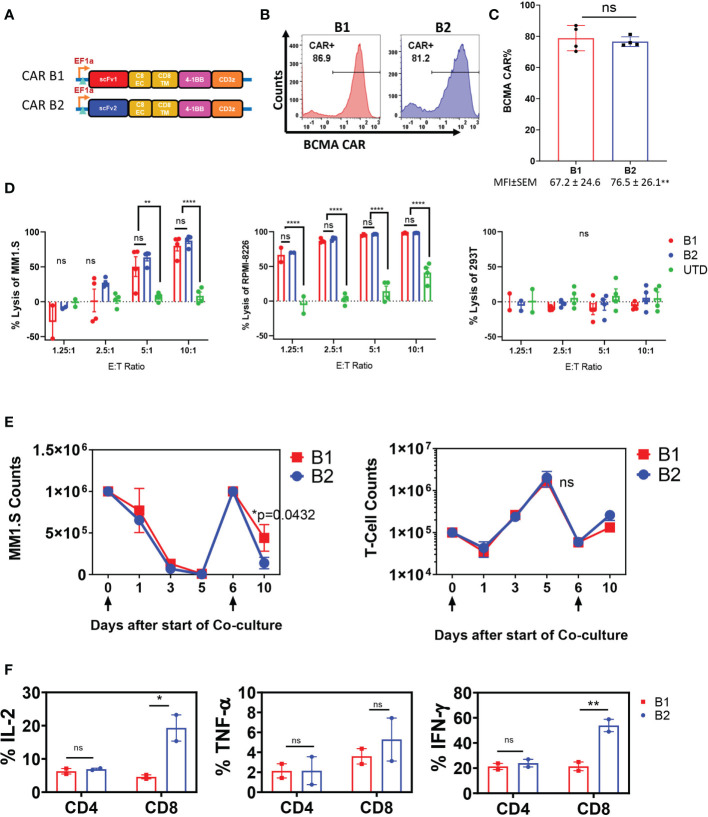
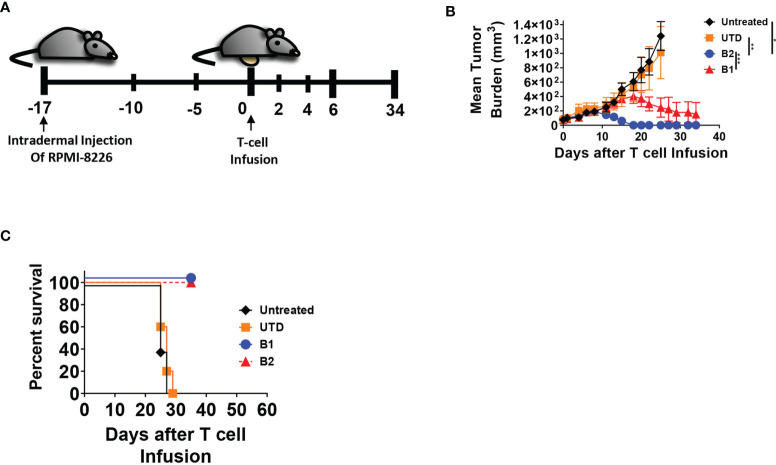
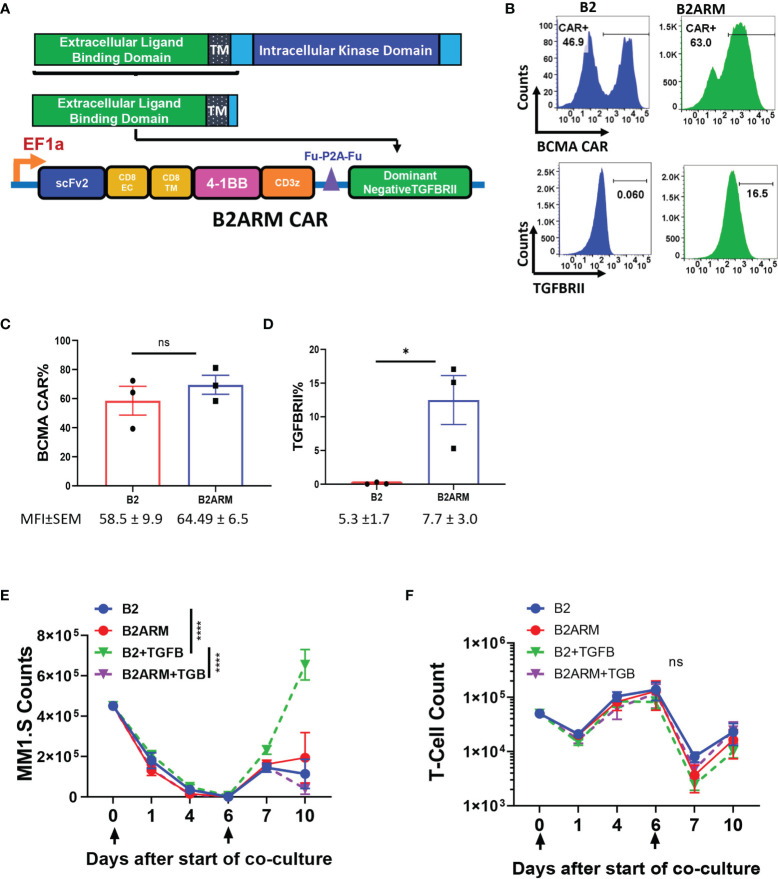
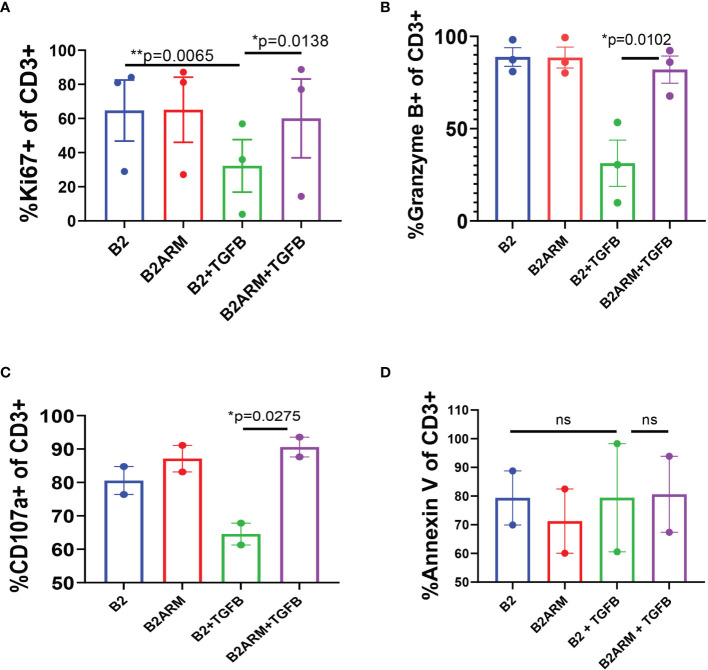
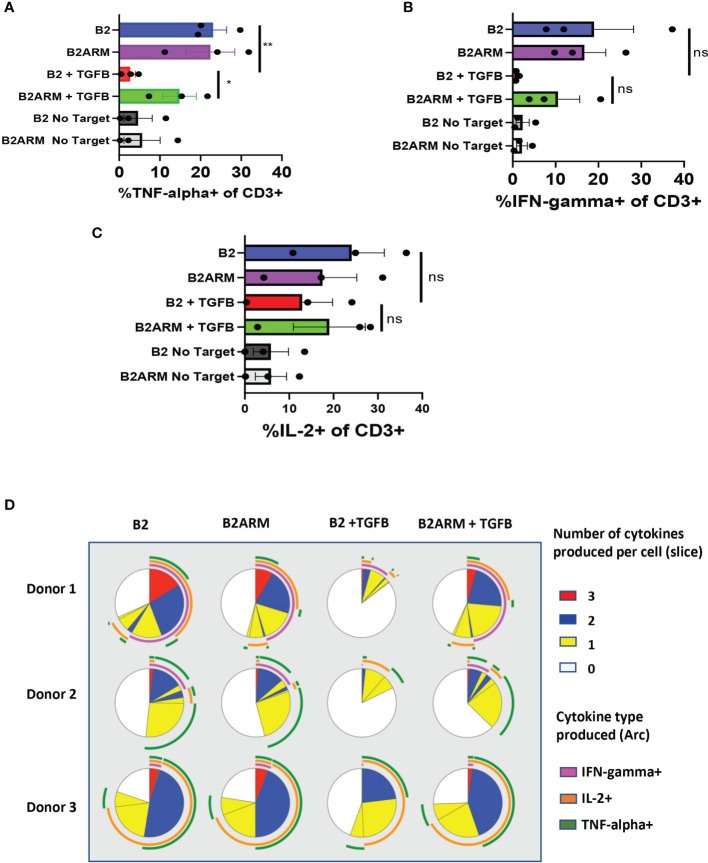
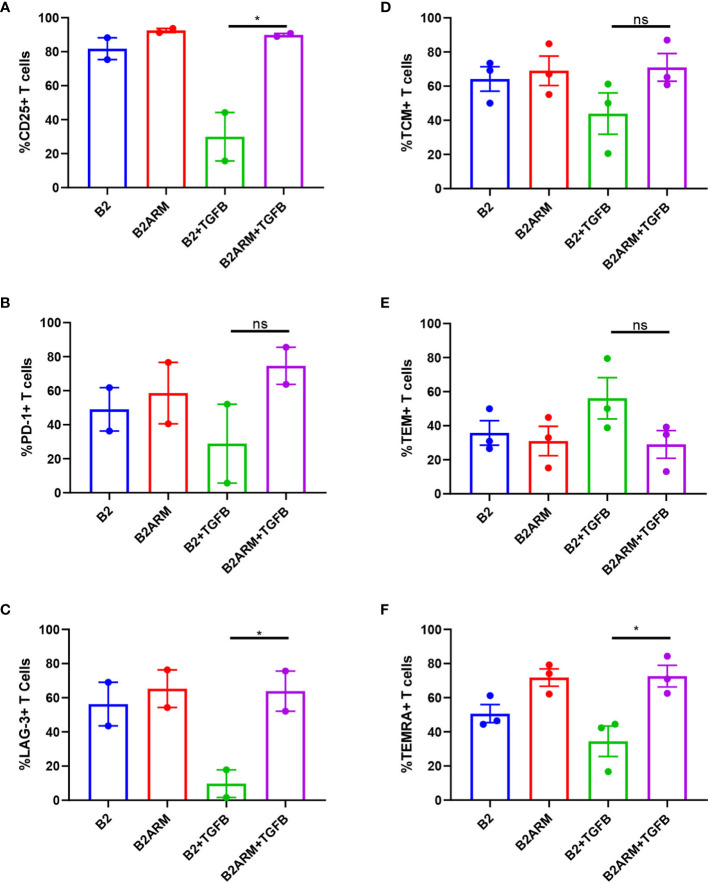
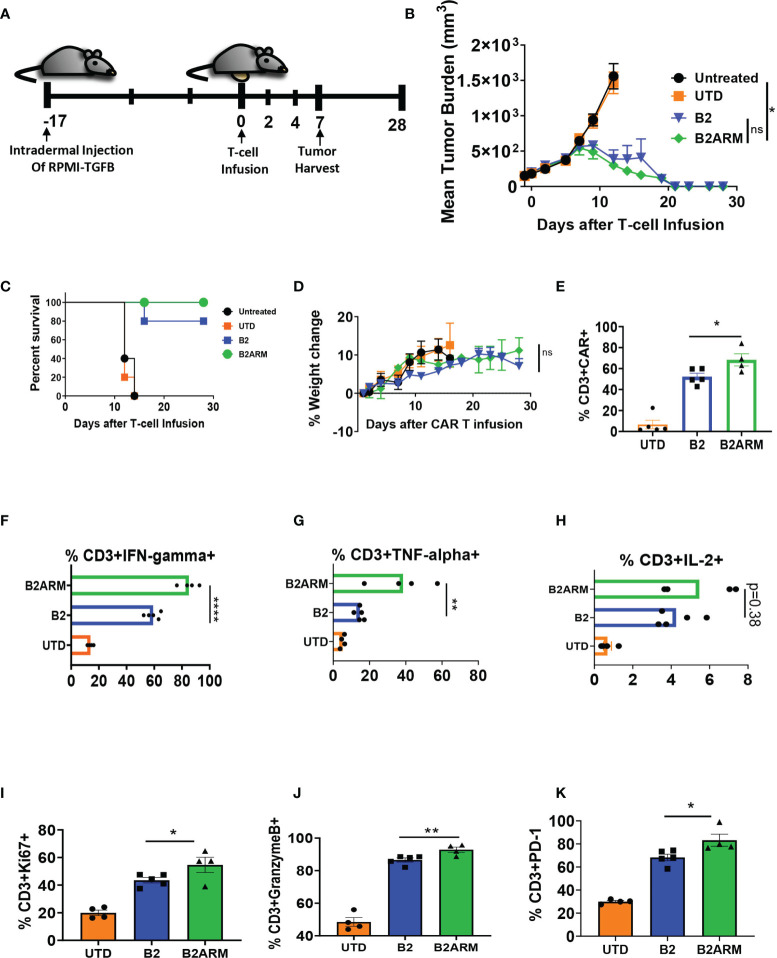
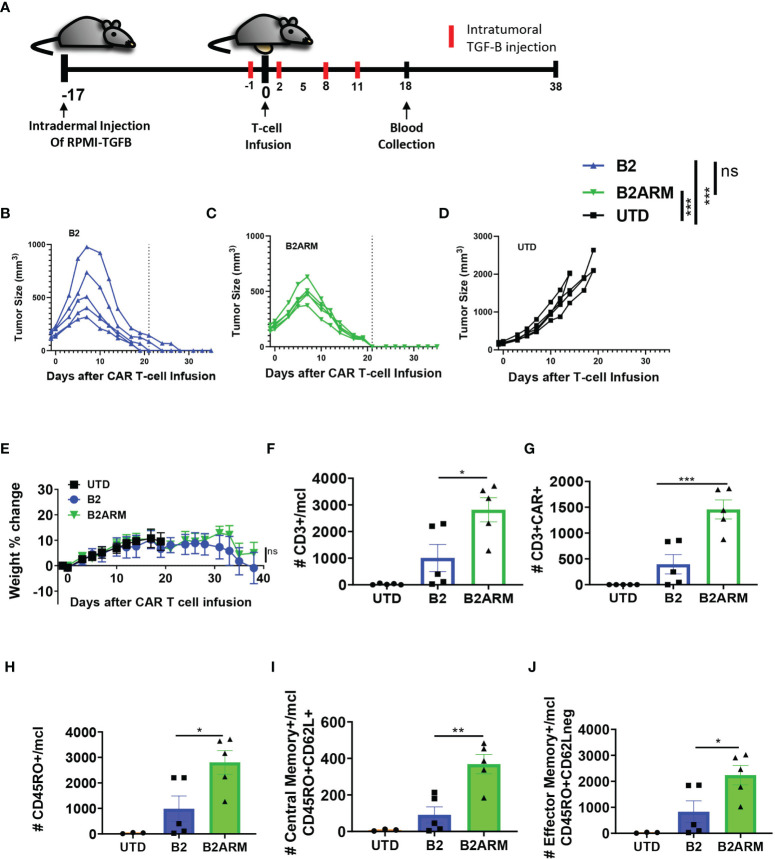
CAR T-cell therapies targeting the B-cell maturation antigen eliminate tumors in relapsed/refractory multiple myeloma patients, however durable remissions remain difficult to attain. Transforming growth factor beta (TGF-β) is a multifunctional cytokine abundantly expressed in the multiple myeloma bone marrow niche, where it promotes an immunosuppressive tumor microenvironment. We hypothesized that BCMA CAR T-cells armored to resist the suppressive effects of TGF-β will provide an advantage in treating multiple myeloma. The armored B2ARM CAR T cells, co-expressing BCMA targeting CAR with TGF-β dominant-negative receptor II, were generated by lentiviral transduction of primary human CD4+ and CD8+ T cells. The B2ARM CAR T cells eliminated MM.1S multiple myeloma targets in long-term cytotoxicity assays, even under TGF-β-high conditions, whereas cytotoxic function of the non-armored B2 CAR -T cells was inhibited by TGF-β. Concordantly, after long-term exposure to targets in the presence of TGF-β, the B2ARM CAR T cells were enriched for Granzyme B, CD107a, Ki67 and polyfunctional cells T-cells (double or triple-positive for IFN-γ, IL-2 and/or TNF-α), as determined by flow cytometry. In addition, the B2ARM CAR T-cells, but not the conventional B2 CAR T-cells, resisted the TGF-β-mediated suppression of activation (CD25), exhaustion (PD-1, LAG3), and differentiation to T effectors (CD45RA+ CD45RO-CD62L-). In NSG mice bearing RPMI-8226 tumors overexpressing TGF-β, the B2ARM CAR mediated 100% tumor rejection and survival, superior infiltration of tumors on day 7 post CAR T treatment (%CD3+CAR+), and greater expression of IFN-γ, TNF-α, Ki67, Granzyme B, and PD-1, as compared to tumor-infiltrating non-armored B2 CAR T-cells. In NSG RPMI-8226 xenograft model in which tumors were additionally supplemented with TGF-β injections on days -1 through 11 of CAR T treatment, the B2ARM CAR T cells rejected tumors faster than the non-armored B2 CARs, and showed greater numbers of CD3+ and CD3+CAR+, central memory (CD45RO+CD62L+) and effector memory (CD45RO+CD62L-) T cells in the peripheral blood 18 days after treatment. In summary, the armored B2ARM CAR T cells mediate superior persistence, proliferation, multi-functionality, effector differentiation and anti-tumor function in pre-clinical models of multiple myeloma, while abrogating TGF-β-mediated suppression.

Keywords: CAR T cells; TGF - β1; cell therapy; lentiviral (LV) vector; multiple myeloma.


Conflict of interest statement

DS, LA, YX, ZZ, BV, DW, PH, PD are employees of Lentigen Technology, a Miltenyi Biotec Company. BW is an employee of Miltenyi Biotec. The remaining authors declare that the research was conducted in the absence of any commercial or financial relationships that could be construed as a potential conflict of interest.

Figures

Figure 1
Figure 1
Characterization of B1 and B2 CAR functionality in vitro. (A) CARs B1 and B2 are comprised of fully human scFv linked to the human CD8 extracellular and transmembrane domains, followed by the 4-1BB co-stimulatory domain, and the CD3ζ activation domain. (B) Representative flow diagrams of CAR T expression from one donor. (C) Mean ± SEM CAR expression from four transduction experiments performed on T cells from different healthy donors are plotted as bars, and the corresponding mean fluorescence intensity values (MFI) are noted below each bar. Statistical significance was determined by Student t-test, ns- non-significant. Transduction at MOI 10 for B2 and MOI 40 for B1 was used in order to achieve similar CAR expression. (D) Overnight killing assay on BCMA-positive MM lines MM.1S and RPMI-8226, and BCMA-negative line 293T. The cytotoxic capacity of B1 and B2 CAR T-cells were determined by co-culturing the CAR T-cells with target cells for 18-20 hours at the ETT ratios shown. The percent cytotoxicity was determined based on the luciferase activity of the remaining target cells in the co-culture after incubation with the CAR T-cells. Mean +/- SEM of four separate experiments with T cells from different donors, each performed in triplicate, are shown. Statistical significance was determined by two way ANOVA with Tukey’s multiple comparisons post-hoc test; ns-non significant, **p<0.01, ****p<0.001. (E) Long-term co-incubation study with BCMA CAR T cells and MM.1S-GFP target cells. Data are presented as mean+/- SEM of CAR T cells from two separate donors tested in long-term co-incubation experiments. Target cells at ETT ratio of 0.1 were added on days 0 and 6, as indicated by arrows below the x-axis. The absolute counts of T cells and target cells were assessed by flow cytometry at the indicated time points by quantifying the number of CD3+ cells and GFP+ cells, respectively. Statistical significance was determined by two way ANOVA with Tukey’s multiple comparisons post-hoc test. (F) Elaboration of cytokines IL-2, TNF-α, and IFN-γ by CAR T cells on day 11 of the long-term co-culture experiment was determined by intracellular staining of in CD3+ cells and flow cytometric analysis. Data represent mean +/-SEM of two separate long-term experiments, using CAR T cells from different healthy donors. Statistical significance was determined by two way ANOVA with Sidak’s multiple comparisons post-hoc test; *p<0.05, **p<0.01, ns, non-significant.
Figure 2
Figure 2
B2 CAR T-cells are more potent in eradicating tumors in vivo compared to B1 CAR. (A) In the in vivo tumor model, 8 x 10⁶ RPMI-8226 cells were intradermally injected on the abdomen of NSG mice (all groups n = 8, except untreated, n = 5) and allowed to engraft for 17 days before the intravenous injection of T-cells. Five million CAR T-positive -cells was infused per mouse, normalized based on CAR expression, or equivalent amount of non-transduced T cells (UTD), or left untreated. Mice were monitored for (B) tumor growth and (C) survival. Statistical significance was determined by paired Student t-test for the indicated groups, *p<0.05, **p<0.01, ***p<0.001.
Figure 3
Figure 3
The B2ARM T-cells with the truncated TGFBRII dominant negative receptor are resistant to the suppressive effects of TGF-β. (A) To create the armored B2ARM BCMA CAR, the sequence of the extracellular and transmembrane domains of TGFBRII, excluding the intracellular kinase domain, was cloned in frame downstream of the B2 CAR construct. (B) T-cells were transduced with lentiviral vectors containing either the B2 CAR construct at MOI 10, or the B2ARM construct at MOI 80, in order to compensate for the lower transduction efficiency of the armored B2ARM CAR construct, which is larger. The cell surface expression of the BCMA CAR (upper panel) and TGFBRII (lower panel) was assessed by flow cytometry. One representative donor is shown. (C) Pooled results from transduction experiments with B2 and B2ARM constructs showing the expression of (C) the CAR and (D) the TGFBRII armor in T cells from three separate donors, mean ± SEM. *p<0.05, Student t-test, ns, non-significant. Mean ± SEM of mean fluorescence intensity (MFI) values for each experimental group are shown below the figures. In the long term co-culture experiment, CAR T-cells were co-incubated with the target cells, MM.1S-GFP, at an ETT ratio of 0.1, and the culture was treated with 10ng/ml of TGF-beta or remained untreated. When less than 15% of target cells remained on day 6, the co-culture was extended for a second round by adding the co-culture cells from the previous round to fresh target cells. The absolute counts of (E) T-cells and (F) target cells at different time points during the long-term co-culture was assessed by quantifying the number of CD3+ and GFP+ cells via flow cytometry using absolute counting beads. Data represent mean ± SEM of separate long term experiments performed in T cells from three different donors. Statistical analysis was performed by two way ANOVA with Tukey’s multiple comparisons test, ****p<0.0001.
Figure 4
Figure 4
The armored B2ARM CAR maintains normal proliferative and degranulation capacity following long-term exposure to TGF-β, in contract to the non-armored CAR B2. Long-term co-cultures with target cells, MM.1S-GFP was achieved by repeatedly restimulating the co-cultured CAR T cells with target cells at ETT ratio of 0.1. Percentage expression of proliferation marker Ki67 (A), degranulation markers granzyme B and CD107a (B, C), respectively, as well as the apoptotic marker annexin V (D), by CAR T cells were evaluated by flow cytometry at the end of the long-term co-cultures (days 8-10). Total CD3+ cells were acquired by flow cytometry for analysis. Results represent mean ± SEM from 2 or 3 separate donors. Statistical significance was determined by one way ANOVA with Tukey’s post-hoc test.*p<0.05, **p<0.01, ns-non-specific.
Figure 5
Figure 5
The B2ARM CAR attenuates the suppression of cytokine responses and maintains polyfunctionality after prolonged exposure to TGF-β. Cytokine production in CD3+ cells was determined by intracellular staining and flow cytometry analysis on day 8-10 after the start of co-culture with MM.1S cells for (A) TNF-α, (B) IFN-γ, and (C) IL-2. Co-cultured cells were incubated at 37°C degrees for 5 hours in the presence of brefeldin (A) N=3 separate donors, mean ± SEM. *p<0.05, **p<0.01. (D) Combinatorial gating function in Flow Jo software and SPICE analysis were utilized to determine the ability of individual cells to produce multiple cytokines during long-term co-culture with MM.1S cells. Results from T cells from three separate donors are shown in rows. Each pie chart represents one treatment group. Slices within the chart represent fractions of the total T cell population organized based on the number of cytokines, which T cells contained in that fraction produced in response to treatment (white-0, yellow-1, blue-2, red-3). Arcs on the outside of the pie chart signify which cytokine(s) were produced by T cells denoted within the corresponding slice of the pie chart (magenta-IFN-γ, green-TNF-α, orange-IL2), ns-non-specific.
Figure 6
Figure 6
The activation and differentiation capacity of the B2ARM CAR T-cells is not inhibited by TGF-β. Cell surface expression of (A) CD25, (B) PD-1, (C) LAG-3 on CD3+ cells co-cultured with MM.1S were assessed by flow cytometry on day 8 during the second round of co-culture with MM.1S cells in the presence or absence of TGF-β. The percentages of central memory (D), effector memory (E), and TEMRA (F) T-cell subsets were determined by the expression of CD62L on CD3+CD45RO+ and CD3+CD45RA cells. Mean values±SEM of 2 to 3 donors from different experiments are shown. Statistically significance was determined Student t-test. *p<0.05, ns-non-specific.
Figure 7
Figure 7
The B2ARM CAR with exhibits superior efficacy in vivo. (A) NSG mice were intradermally injected on the abdomen with 8 x 10⁶ RPMI-8226 cells with overexpressed TGF-β (n = 10 in all groups except untreated, n = 5). On day 17 after tumor injection, 5 x 10⁶ CAR+ T-cells were intravenously injected. The differences in CAR expression levels were normalized by adjusting the total number of infused T-cells. On day 7 after T-cell infusion, 5 mice from each group (except the untreated group) were sacrificed for tumor harvest, while the rest were monitored for (B) tumor progression, (C) survival, and (D) weight change. (E) the percentage of CD3+CAR+ T cells in the tumor homogenates was determined by flow cytometry following tumor harvest. Tumor homogenates were incubated at 37°C for 5 hours in the presence of brefeldin A, and (F) IFN-γ, (G) TNF-α, and (H) IL-2 cytokine production in CD3+ cells was determined by intracellular staining and flow cytometry analysis. Statistical significance was determined by one way ANOVA with Tukey’s post-hoc test, *p<0.05, **p<0.01, ****p<0.0001. The percentage of Ki67, (I), Granzyme B, (J), and PD-1, (K) expression in CD3+ cells from TIL populations was determined by intracellular or surface staining and flow cytometry in tumor homogenates following tumor harvest. Statistical significance was determined by Student t-test, *p<0.05, **p<0.01, ns, non-specific.
Figure 8
Figure 8
The armored B2ARM CAR demonstrates high anti-tumor efficacy and increased memory T-cell persistence in vivo. (A) NSG mice were intradermally injected on the abdomen with 8 x10⁶ RPMI-8226 cells with overexpressed TGF-β (n = 5 per group). 2 x 10⁶ CAR+ T-cells were intravenously injected on day 17 after tumor implantation. On the day prior to T-cell infusion (day 16 after tumor implantation), 0.2 ug/ml of TGF-β were intratumorally injected. The exogenous TGF-β treatment was done every 3 days thereafter for a total of 5 injections. The differences in CAR expression levels were normalized by adjusting the total number of infused T-cells. Tumor progression (B–D) and changes in weight (E) were monitored after T-cell infusion. Dotted line denotes the complete resolution of tumors in the armored CAR T group on day 21, to facilitate comparison between treatments. Changes in tumor size were analyzed by one way ANOVA with Dunnett’s multiple comparisons test, ***p<0.001, ns, non-significant. On day 18 after T cell infusion, the absolute counts of (F) CD3+ cells, (G) CD3+CAR+ and (H) CD45RO+ (I) CD45RO+CD62L+, and (J) CD45RO+CD62L- cells in the peripheral blood of the mice were determined by counting beads and flow cytometric analysis. Statistical significance was determined by one way ANOVA with Tukey’s multiple comparisons test *p<0.05, **p<0.01.

Similar articles

Cited by

References

    1. Yu B, Jiang T, Liu D. BCMA-Targeted Immunotherapy for Multiple Myeloma. J Hematol Oncol (2020) 13(1):125. doi: 10.1186/s13045-020-00962-7 - DOI - PMC - PubMed
    1. Gagelmann N, Ayuk F, Atanackovic D, Kroger N. B Cell Maturation Antigen-Specific Chimeric Antigen Receptor T Cells for Relapsed or Refractory Multiple Myeloma: A Meta-Analysis. Eur J Haematol (2020) 104(4):318–27. doi: 10.1111/ejh.13380 - DOI - PubMed
    1. Braunlin M, Belani R, Buchanan J, Wheeling T, Kim C. Trends in the Multiple Myeloma Treatment Landscape and Survival: A U.S. Analysis Using 2011-2019 Oncology Clinic Electronic Health Record Data. Leukemia Lymphoma 62;2:377–86. doi: 10.1080/10428194.2020.1827253 - DOI - PubMed
    1. Garcia-Guerrero E, Sierro-Martinez B, Perez-Simon JA. Overcoming Chimeric Antigen Receptor (CAR) Modified T-Cell Therapy Limitations in Multiple Myeloma. Front Immunol (2020) 11:1128. doi: 10.3389/fimmu.2020.01128 - DOI - PMC - PubMed
    1. Brudno JN, Maric I, Hartman SD, Rose JJ, Wang M, Lam N, et al. . T Cells Genetically Modified to Express an Anti-B-Cell Maturation Antigen Chimeric Antigen Receptor Cause Remissions of Poor-Prognosis Relapsed Multiple Myeloma. J Clin Oncol (2018) 36(22):2267–80. doi: 10.1200/JCO.2018.77.8084 - DOI - PMC - PubMed