

Docosahexaenoic acid improves altered mineralization proteins, the decreased quality of hydroxyapatite crystals and suppresses oxidative stress induced by high glucose
- PMID: 35222712
- PMCID: PMC8815046
- DOI: 10.3892/etm.2022.11160
Docosahexaenoic acid improves altered mineralization proteins, the decreased quality of hydroxyapatite crystals and suppresses oxidative stress induced by high glucose
Abstract
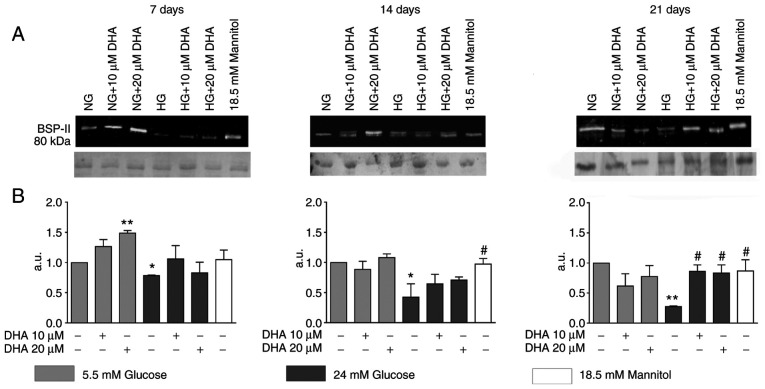
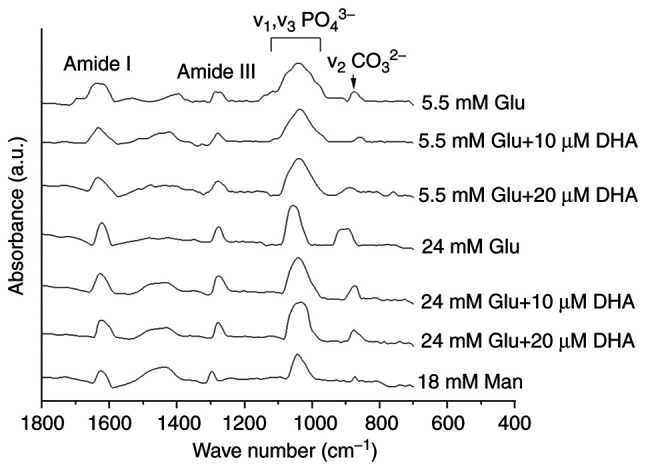
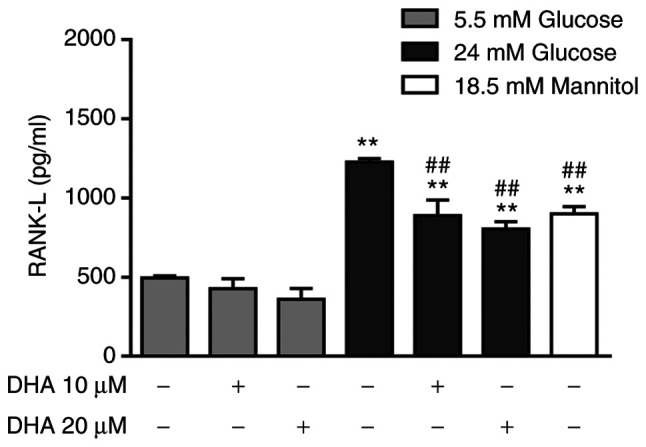
Patients with type 2 diabetes mellitus (DM2) experience an increased risk of fractures and a variety of bone pathologies, such as osteoporosis. The suggested mechanisms of increased fracture risk in DM2 include chronic hyperglycaemia, which provokes oxidative stress, alters bone matrix, and decreases the quality of hydroxyapatite crystals. Docosahexaenoic acid (DHA), an omega-3 fatty acid, can increase bone formation, reduce bone loss, and it possesses antioxidant/anti-inflammatory properties. The present study aimed to determine the effect of DHA on altered osteoblast mineralisation and increased reactive oxygen species (ROS) induced by high glucose concentrations. A human osteoblast cell line was treated with 5.5 mM glucose (NG) or 24 mM glucose (HG), alone or in combination with 10 or 20 µM DHA. The collagen type 1 (Col1) scaffold, the expression of osteocalcin (OCN) and bone sialoprotein type-II (BSP-II), the alkaline phosphatase (ALP) specific activity, the mineral quality, the production of ROS and the mRNA expression of nuclear factor erythroid 2-related factor-2 (NRF2) were analysed. Osteoblasts cultured in HG and treated with either DHA concentration displayed an improved distribution of the Col1 scaffold, increased OCN and BSP-II expression, increased NRF2 mRNA, decreased ALP activity, carbonate substitution and reduced ROS production compared with osteoblasts cultured in HG alone. DHA counteracts the adverse effects of HG on bone mineral matrix quality and reduces oxidative stress, possibly by increasing the expression of NRF2.
Keywords: bone mineral matrix; bone quality; diabetic osteopathy; docosahexaenoic acid; omega 3.
Copyright: © Cifuentes-Mendiola et al.
Conflict of interest statement
The authors declare that they have no competing interests.
Figures


Similar articles
-
The extracellular matrix of human bone marrow adipocytes and glucose concentration differentially alter mineralization quality without impairing osteoblastogenesis.Bone Rep. 2022 Sep 20;17:101622. doi: 10.1016/j.bonr.2022.101622. eCollection 2022 Dec. Bone Rep. 2022. PMID: 36187598 Free PMC article.
-
Cytoprotective effect of Fufang Lurong Jiangu capsule against hydrogen peroxide-induced oxidative stress in bone marrow stromal cell-derived osteoblasts through the Nrf2/HO-1 signaling pathway.Biomed Pharmacother. 2020 Jan;121:109676. doi: 10.1016/j.biopha.2019.109676. Epub 2019 Nov 25. Biomed Pharmacother. 2020. PMID: 31810119
-
MiR-449 overexpression inhibits osteogenic differentiation of bone marrow mesenchymal stem cells via suppressing Sirt1/Fra-1 pathway in high glucose and free fatty acids microenvironment.Biochem Biophys Res Commun. 2018 Jan 29;496(1):120-126. doi: 10.1016/j.bbrc.2018.01.009. Epub 2018 Jan 3. Biochem Biophys Res Commun. 2018. PMID: 29305863
-
Docosahexaenoic Acid Induces Expression of NAD(P)H: Quinone Oxidoreductase and Heme Oxygenase-1 through Activation of Nrf2 in Cerulein-Stimulated Pancreatic Acinar Cells.Antioxidants (Basel). 2020 Nov 4;9(11):1084. doi: 10.3390/antiox9111084. Antioxidants (Basel). 2020. PMID: 33158207 Free PMC article.
-
Bone morphogenetic protein-2 restores mineralization in glucocorticoid-inhibited MC3T3-E1 osteoblast cultures.J Bone Miner Res. 2003 Jul;18(7):1186-97. doi: 10.1359/jbmr.2003.18.7.1186. J Bone Miner Res. 2003. PMID: 12854828
Cited by
-
Single nucleotide polymorphism rs854560 in paraoxonase-1 regulates the cytodifferentiation of human periodontal ligament cells.Front Dent Med. 2024 Sep 20;5:1449482. doi: 10.3389/fdmed.2024.1449482. eCollection 2024. Front Dent Med. 2024. PMID: 39917667 Free PMC article.
-
The extracellular matrix of human bone marrow adipocytes and glucose concentration differentially alter mineralization quality without impairing osteoblastogenesis.Bone Rep. 2022 Sep 20;17:101622. doi: 10.1016/j.bonr.2022.101622. eCollection 2022 Dec. Bone Rep. 2022. PMID: 36187598 Free PMC article.
-
Unraveling the Omega-3 Puzzle: Navigating Challenges and Innovations for Bone Health and Healthy Aging.Mar Drugs. 2024 Sep 28;22(10):446. doi: 10.3390/md22100446. Mar Drugs. 2024. PMID: 39452854 Free PMC article. Review.
-
Causal link between docosahexaenoic acid and osteoporosis: A 2-sample Mendelian randomization study.Medicine (Baltimore). 2024 Aug 9;103(32):e38893. doi: 10.1097/MD.0000000000038893. Medicine (Baltimore). 2024. PMID: 39121292 Free PMC article.
-
Biomaterials Designed to Modulate Reactive Oxygen Species for Enhanced Bone Regeneration in Diabetic Conditions.J Funct Biomater. 2024 Aug 8;15(8):220. doi: 10.3390/jfb15080220. J Funct Biomater. 2024. PMID: 39194658 Free PMC article. Review.
References
-
- International Diabetes Federation: IDF diabetes atlas eighth edition, 2017.
LinkOut - more resources
Full Text Sources