. 2022 Feb 18:2022:5044046.
doi: 10.1155/2022/5044046. eCollection 2022.

Angiotensin II Induces Cardiac Edema and Hypertrophic Remodeling through Lymphatic-Dependent Mechanisms

Affiliations

Angiotensin II Induces Cardiac Edema and Hypertrophic Remodeling through Lymphatic-Dependent Mechanisms

Jie Bai et al. Oxid Med Cell Longev. .

Abstract

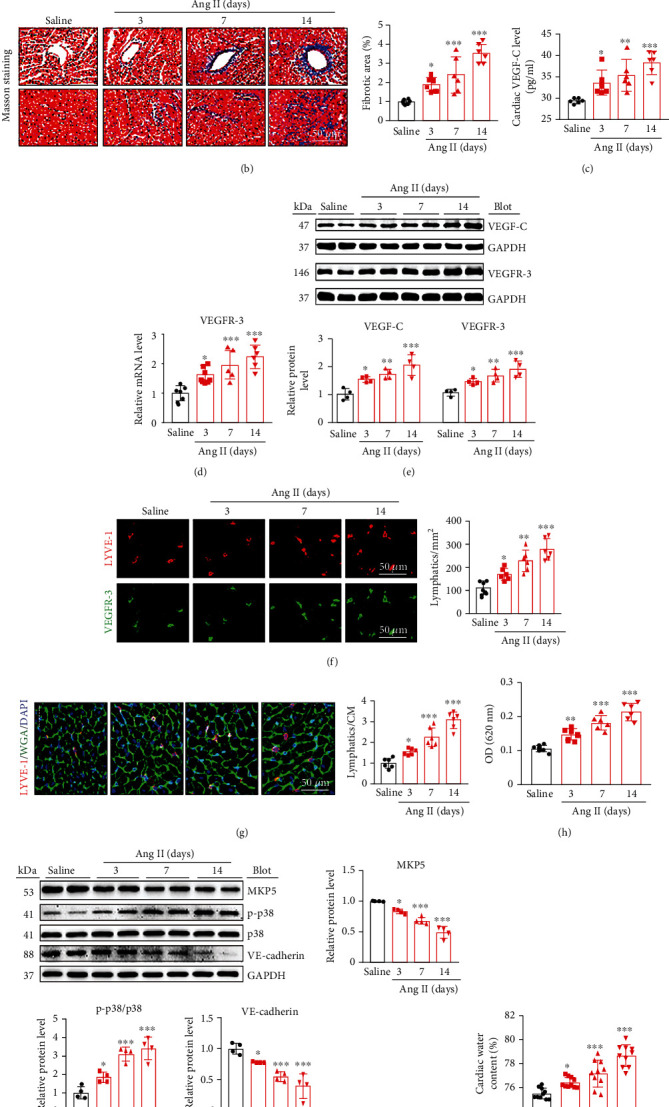
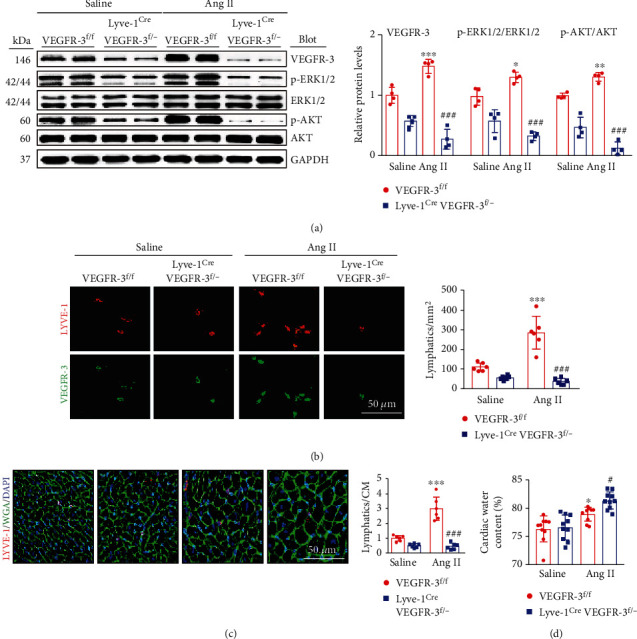
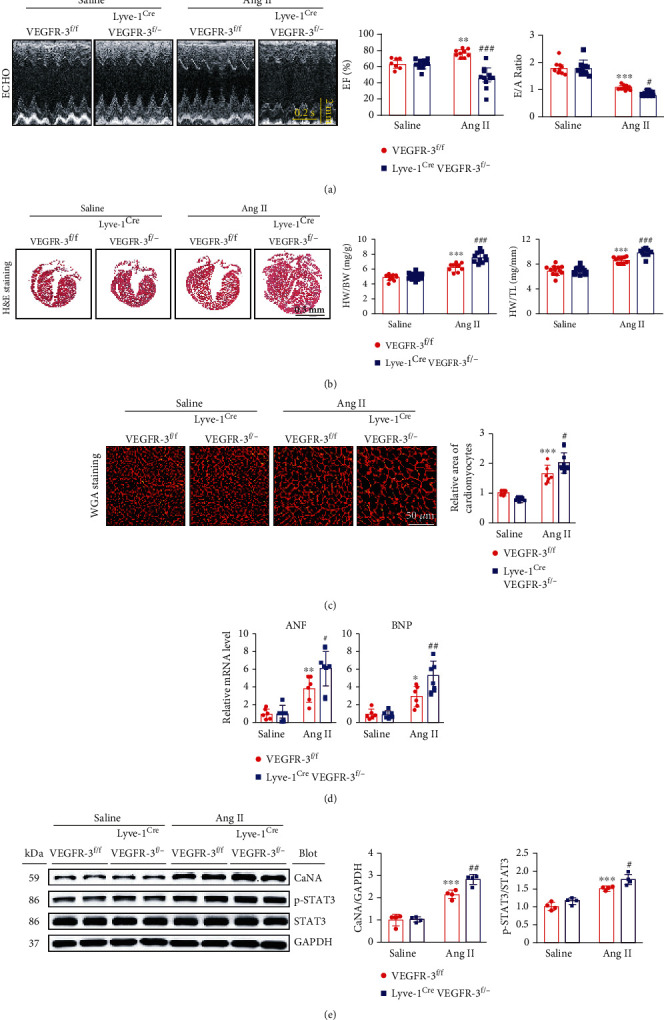
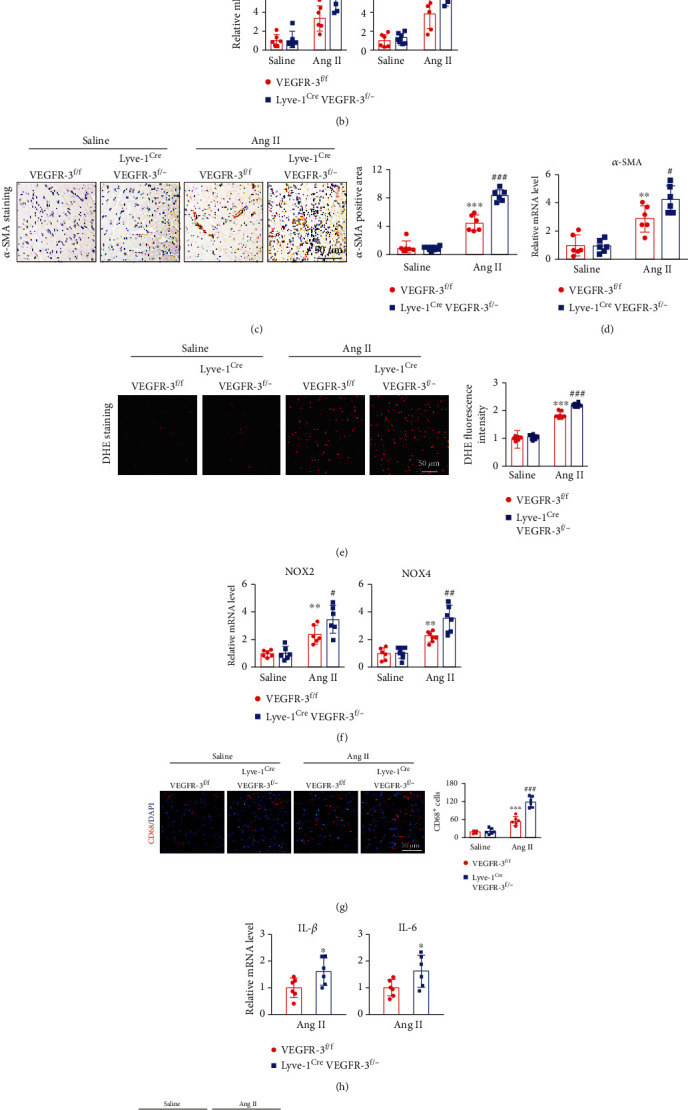
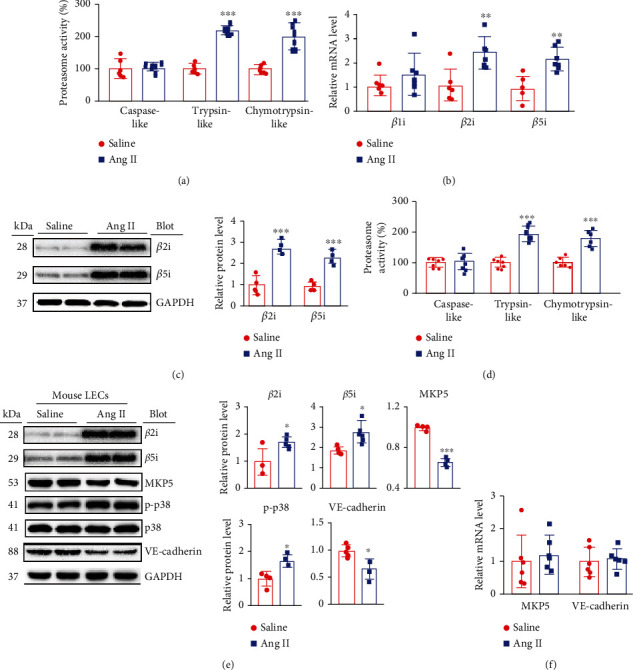
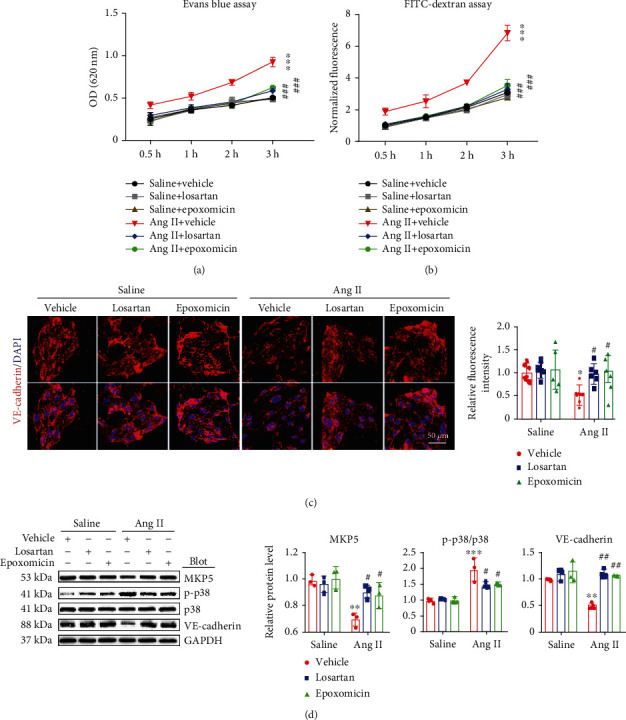
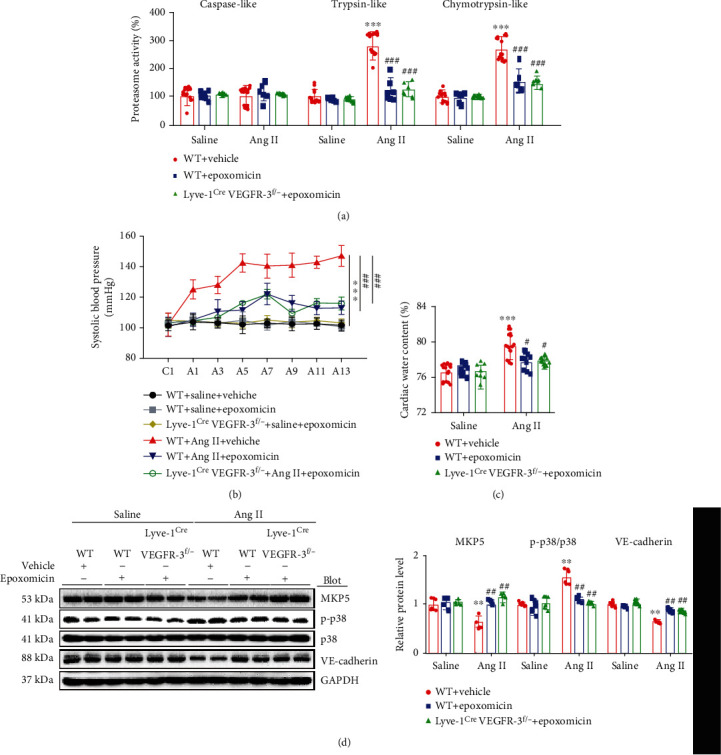
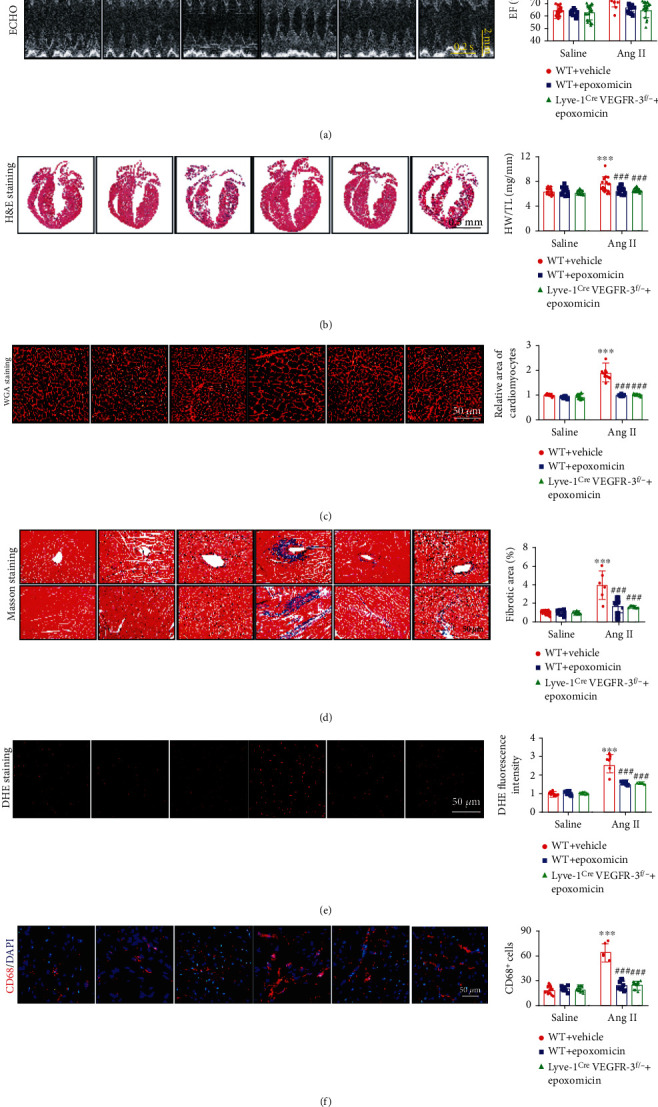
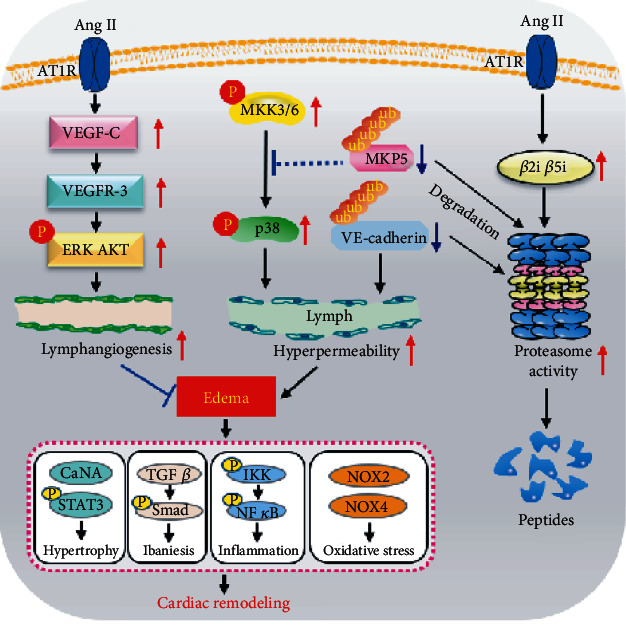
Cardiac lymphatic vessel growth (lymphangiogenesis) and integrity play an essential role in maintaining tissue fluid balance. Inhibition of lymphatic lymphangiogenesis is involved in cardiac edema and cardiac remodeling after ischemic injury or pressure overload. However, whether lymphatic vessel integrity is disrupted during angiotensin II- (Ang II-) induced cardiac remodeling remains to be investigated. In this study, cardiac remodeling models were established by Ang II (1000 ng/kg/min) in VEGFR-3 knockdown (Lyve-1Cre VEGFR-3f/-) and wild-type (VEGFR-3f/f) littermates. Our results indicated that Ang II infusion not only induced cardiac lymphangiogenesis and upregulation of VEGF-C and VEGFR-3 expression in the time-dependent manner but also enhanced proteasome activity, MKP5 and VE-cadherin degradation, p38 MAPK activation, and lymphatic vessel hyperpermeability. Moreover, VEGFR-3 knockdown significantly inhibited cardiac lymphangiogenesis in mice, resulting in exacerbation of tissue edema, hypertrophy, fibrosis superoxide production, inflammation, and heart failure (HF). Conversely, administration of epoxomicin (a selective proteasome inhibitor) markedly mitigated Ang II-induced cardiac edema, remodeling, and dysfunction; upregulated MKP5 and VE-cadherin expression; inactivated p38 MAPK; and reduced lymphatic vessel hyperpermeability in WT mice, indicating that inhibition of proteasome activity is required to maintain lymphatic endothelial cell (LEC) integrity. Our results show that both cardiac lymphangiogenesis and lymphatic barrier hyperpermeability are implicated in Ang II-induced adaptive hypertrophic remodeling and dysfunction. Proteasome-mediated hyperpermeability of LEC junctions plays a predominant role in the development of cardiac remodeling. Selective stimulation of lymphangiogenesis or inhibition of proteasome activity may be a potential therapeutic option for treating hypertension-induced cardiac remodeling.


Conflict of interest statement

The authors declare that they have no conflicts of interest.

Figures

Figure 1
Figure 1
Dynamic changes in cardiac hypertrophy, fibrosis, lymphangiogenesis, lymphatic permeability, and water content in Ang II-infused mice. WT mice were infused with Ang II (1000 ng/kg/min) or saline for 3, 7, and 14 days. (a) H&E staining (left) and the HW/TL ratio (right, n = 6). (b) Masson staining (left) and quantitative analysis of the extent of myocardial fibrosis (%) (right, n = 6). (c) Measurement of mouse serum VEGF-C concentrations (n = 6). (d) qPCR analysis of cardiac VEGFR-3 mRNA expression (n = 6). (e) Immunoblot analysis of cardiac VEGF-C and VEGFR-3 levels (left) and quantification (right, n = 4). (f) Immunostaining with antibodies against LYVE-1 (red) and VEGFR-3 (green) (left) and quantification of cardiac lymphatics (right, n = 6). (g) Cardiac staining with an LYVE-1 antibody (red), WGA (green), and DAPI (blue) (left), and the ratio of cardiac lymphatics to CMs (right, n = 6). (h) Evaluation of permeability in vivo 16 hours after footpad injection of Evans blue (0.67 mg/mL) into the popliteal lymph nodes (n = 6). (i) Immunoblot analysis of cardiac MKP5, p-p38, p38, VE-cadherin, and GAPDH levels and quantification of the levels of these proteins (n = 4). (j) Quantitative analysis of cardiac edema (n = 10). The data are presented as the mean ± SD; n represents the number of animals in each group. Statistical differences were determined by one-way ANOVA; p < 0.05, ∗∗p < 0.01, and ∗∗∗p < 0.001 versus the saline group.
Figure 2
Figure 2
VEGFR-3 knockdown suppresses Ang II-induced cardiac lymphangiogenesis. VEGFR-3f/f and Lyve-1Cre VEGFR-3f/− mice were treated with saline or Ang II (1000 ng/kg/min) for 14 days. (a) Immunoblot analysis of cardiac VEGFR-3, p-ERK1/2, ERK1/2, p-AKT, and AKT levels (left) and quantification (right, n = 4). (b) Cardiac staining with LYVE-1 (red) and VEGFR-3 (green) antibodies (left) and quantification of cardiac lymphatics (right, n = 6). (c) Cardiac staining with an LYVE-1 antibody (red), WGA (green), and DAPI (blue) (left) and quantification of the ratio of cardiac lymphatics to CM (right, n = 6). (d) Quantitative analysis of cardiac edema (n = 10). The data are presented as the mean ± SD; n represents the number of animals in each group. Statistical differences were determined by two-way ANOVA; p < 0.05, ∗∗p < 0.01, and ∗∗∗p < 0.001 versus the VEGFR-3f/f+saline group; #p < 0.05 and ###p < 0.001 versus the VEGFR-3f/f+Ang II group.
Figure 3
Figure 3
VEGFR-3 knockdown aggravates Ang II-induced cardiac dysfunction and hypertrophy in mice. VEGFR-3f/f and Lyve-1Cre VEGFR-3f/− mice were infused with saline or Ang II (1000 ng/kg/min) for 14 days. (a) Echocardiography of the heart (left), left ventricular (LV) EF%, and the E/A ratio (right, n = 10). (b) Cardiac H&E staining (left) and the HW/BW and HW/TL ratio (right, n = 10). (c) Cardiac WGA staining (left) and quantitative analysis (right, n = 6). (d) qPCR analysis of cardiac ANF and BNP levels (n = 6). (e) Immunoblot analysis of cardiac CaNA, p-STAT3, and STAT3 levels (left) and quantification (right, n = 4). The data are presented as the mean ± SD; n represents the number of animals in each group. Statistical differences were determined by two-way ANOVA; p < 0.05, ∗∗p < 0.01, and ∗∗∗p < 0.001 versus the VEGFR-3f/f+saline group; #p < 0.05, ##p < 0.01, and ###p < 0.001 versus the VEGFR-3f/f+Ang II group.
Figure 4
Figure 4
VEGFR-3 knockdown accelerates Ang II-induced cardiac fibrosis, oxidative stress, and inflammation in mice. VEGFR-3f/f and Lyve-1Cre VEGFR-3f/− mice were infused with saline or Ang II (1000 ng/kg/min) for 14 days. (a) Cardiac Masson staining (left) and quantitative analysis of the fibrotic area (%) (right, n = 6). (b) qPCR analyses of myocardial collagen I and collagen III levels (n = 6). (c) Cardiac α-SMA immunohistochemical staining (left) and quantitative analysis of the positive area (right, n = 6). (d) qPCR analyses of myocardial α-SMA levels (n = 6). (e) Cardiac DHE fluorescence staining (left) and quantitative analysis of relative fluorescence intensity (right, n = 6). (f) qPCR analyses of myocardial NOX2 and NOX4 levels (n = 6). (g) CD68 (red) and DAPI (blue) fluorescence staining of heart sections (left) and quantification of CD68+ macrophages (right, n = 6). (h) qPCR analyses of myocardial IL-1β and IL-6 levels (n = 6). (i) Immunoblot analysis of cardiac TGF-β1, p-Smad2/3, Smad2/3, NOX2, NOX4, p-P65, and P65 levels (left) and quantification (right, n = 4). The data are presented as the mean ± SD; n represents the number of animals in each group. Statistical differences were determined by two-way ANOVA; p < 0.05, ∗∗p < 0.01, and ∗∗∗p < 0.001 versus the VEGFR-3f/f+saline group; #p < 0.05, ##p < 0.01, and ###p < 0.001 versus the VEGFR-3f/f+Ang II group.
Figure 5
Figure 5
Ang II increases proteasome activity and immunoproteasome catalytic subunit levels in mice and cultured LECs. (a) The proteasome activity (%) of caspase-like, trypsin-like, and chymotrypsin-like proteins in the heart (n = 6). (b) qPCR analyses of myocardial β1i, β2i, and β5i levels (n = 6). (c) Immunoblot analysis of β2i and β5i levels (left) and quantification (right, n = 4). (d) LECs were stimulated with saline or Ang II (100 nM) for 24 hours. The proteasome activity (%) of caspase-like, trypsin-like, and chymotrypsin-like proteins in the heart (n = 6). (e) Immunoblot analysis of β2i, β5i, MKP5, p-p38, p38, and VE-cadherin levels (left) and quantification (right, n = 4). (f) qPCR analyses of MKP5 and VE-cadherin levels in LECs (n = 6). The data are presented as the mean ± SD; n represents the number of animals in or experiments for each group. Statistical differences were determined by t tests; p < 0.05, ∗∗p < 0.01, and ∗∗∗p < 0.001 versus the saline group.
Figure 6
Figure 6
Suppression of proteasome activity alleviates Ang II-stimulated LEC hyperpermeability in vitro. LECs on the upper surface of the Transwell membrane were pretreated with vehicle, losartan (10 μM), epoxomicin (10 μM), or vehicle control and then treated with saline or Ang II (100 nM) for 24 hours. (a) Permeability was analyzed 0.5, 1, 2, and 3 hours after 100 μL of Evans blue (0.67 mg/mL) was added to the upper compartment and 600 μL of PBS was added to the lower compartment (n = 3). (b) Permeability was analyzed 0.5, 1, 2, and 3 hours after 100 μL of FITC-dextran (1 mg/mL) was added to the upper compartment and 600 μL of PBS was added to the lower compartment (n = 3). (c) VE-cadherin (red) and DAPI (blue) staining of LECs (left) and quantification (right, n = 6). (d) Immunoblot analysis of MKP5, p-p38, p38, and VE-cadherin levels (left) and quantification (right, n = 3). The data are presented as the mean ± SD; n represents the number of experiments for each group. Statistical differences were determined by two-way ANOVA; p < 0.05, ∗∗p < 0.01, and ∗∗∗p < 0.001 versus the saline+vehicle group; #p < 0.05, ##p < 0.01, and ###p < 0.001 versus the Ang II+vehicle group.
Figure 7
Figure 7
Treatment with epoxomicin attenuates the Ang II-induced increases in proteasome activity, arterial SBP, and cardiac water content and positively regulates the permeability pathway. WT and Lyve-1Cre VEGFR-3f/− mice were pretreated with vehicle or epoxomicin and then infused with saline or Ang II (1000 ng/kg/min) for 14 days. (a) Percentage of proteasome activity of caspase-like, trypsin-like, and chymotrypsin-like proteins in the heart (n = 6). (b) Average arterial SBP of mice (n = 6). (c) Quantitation of cardiac water content (%) (n = 8). (d) Immunoblot analysis of MKP5, p-p38, p38, and VE-cadherin protein levels (left) and quantification (right, n = 4). The data are presented as the mean ± SD; n represents the number of animals in each group. Statistical differences were determined by two-way ANOVA; ∗∗p < 0.01 and ∗∗∗p < 0.001 versus the WT saline+vehicle group; #p < 0.05, ##p < 0.01, and ###p < 0.001 versus the WT Ang II+vehicle group.
Figure 8
Figure 8
Administration of epoxomicin attenuates Ang II-induced cardiac dysfunction, hypertrophy, fibrosis, oxidative stress, and macrophage infiltration in mice. WT and Lyve-1Cre VEGFR-3f/− mice were pretreated with vehicle or epoxomicin and then infused with saline or Ang II (1000 ng/kg/min) for 14 days. (a) Echocardiographic analysis of the heart in M-mode (left) and analysis of EF% (right, n = 12). (b) Cardiac H&E staining (left) and the HW/TL ratio (right, n = 14). (c) Cardiac WGA staining (left) and quantitative analysis (right, n = 6). (d) Cardiac Masson staining (left) and quantitative analysis of the myocardial fibrosis area (right, n = 6). (e) Cardiac DHE fluorescence staining (red) (left, scale bar = 50 μm) and quantitative analysis of relative fluorescence intensity (right, n = 6). (f) Cardiac CD68 immunostaining (red) and DAPI (blue) (left, scale bar = 50 μm) and quantitative analysis of CD68-positive macrophages (right, n = 6). The data are presented as the mean ± SD; n represents the number of animals in each group. Statistical differences were determined by two-way ANOVA; ∗∗∗p < 0.001 versus the WT saline+vehicle group; ###p < 0.001 versus the WT Ang II+vehicle group.
Figure 9
Figure 9
A schematic diagram showing that Ang II induces cardiac edema and hypertrophic remodeling through lymphatic-dependent mechanisms. Binding of Ang II to AT1R not only stimulates cardiac lymphangiogenesis through VEGFR-3-AKT/ERK signaling but also increases the expression and activity of the immunoproteasome catalytic subunits β2i and β5i, which promotes the degradation of MKP5 and VE-cadherin and activation of p38 MAPK, leading to lymphatic endothelial hyperpermeability and therefore a net increase in myocardial water accumulation (edema) and hypertrophic remodeling. VEGFR-3 knockdown inhibits cardiac lymphangiogenesis and aggravates cardiac edema and hypertrophic remodeling. Conversely, the proteasome inhibitor epoxomicin attenuates cardiac lymphatic hyperpermeability and hypertrophic effects.

Similar articles

Cited by

References

    1. Nakamura M. Mechanisms of physiological and pathological cardiac hypertrophy. Nature Reviews. Cardiology . 2018;15(7):387–407. doi: 10.1038/s41569-018-0007-y. - DOI - PubMed
    1. Oka T., Akazawa H., Naito A. T., Komuro I. Angiogenesis and cardiac hypertrophy. Circulation Research . 2014;114(3):565–571. doi: 10.1161/CIRCRESAHA.114.300507. - DOI - PubMed
    1. Saucerman J. J., Tan P. M., Buchholz K. S., McCulloch A. D., Omens J. H. Mechanical regulation of gene expression in cardiac myocytes and fibroblasts. Nature Reviews. Cardiology . 2019;16(6):361–378. doi: 10.1038/s41569-019-0155-8. - DOI - PMC - PubMed
    1. Hu D., Li L., Li S., et al. Lymphatic system identification, pathophysiology and therapy in the cardiovascular diseases. Journal of Molecular and Cellular Cardiology . 2019;133:99–111. doi: 10.1016/j.yjmcc.2019.06.002. - DOI - PubMed
    1. Brakenhielm E. Cardiac lymphatics in health and disease. Nature Reviews. Cardiology . 2019;16(1):56–68. doi: 10.1038/s41569-018-0087-8. - DOI - PubMed

MeSH terms

Substances

LinkOut - more resources