. 2022 Feb 2:20:850-863.
doi: 10.1016/j.csbj.2022.01.029. eCollection 2022.

Compounds targeting GPI biosynthesis or N-glycosylation are active against Plasmodium falciparum

Affiliations

Compounds targeting GPI biosynthesis or N-glycosylation are active against Plasmodium falciparum

Àngel Fenollar et al. Comput Struct Biotechnol J. .

Abstract

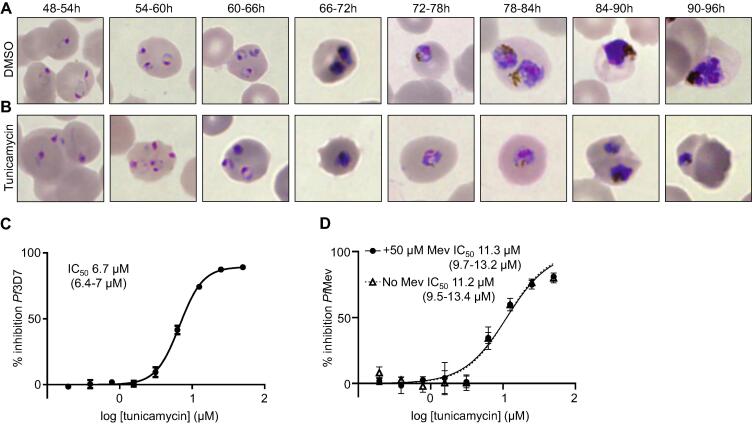
The emergence of resistance to first-line antimalarials, including artemisinin, the last effective malaria therapy in some regions, stresses the urgent need to develop new effective treatments against this disease. The identification and validation of metabolic pathways that could be targeted for drug development may strongly contribute to accelerate this process. In this study, we use fully characterized specific inhibitors targeting glycan biosynthetic pathways as research tools to analyze their effects on the growth of the malaria parasite Plasmodium falciparum and to validate these metabolic routes as feasible chemotherapeutic targets. Through docking simulations using models predicted by AlphaFold, we also shed new light into the modes of action of some of these inhibitors. Molecules inhibiting N-acetylglucosaminyl-phosphatidylinositol de-N-acetylase (GlcNAc-PI de-N-acetylase, PIGL/GPI12) or the inositol acyltransferase (GWT1), central for glycosylphosphatidylinositol (GPI) biosynthesis, halt the growth of intraerythrocytic asexual parasites during the trophozoite stages of the intraerythrocytic developmental cycle (IDC). Remarkably, the nucleoside antibiotic tunicamycin, which targets UDP-N-acetylglucosamine:dolichyl-phosphate N-acetylglucosaminephosphotransferase (ALG7) and N-glycosylation in other organisms, induces a delayed-death effect and inhibits parasite growth during the second IDC after treatment. Our data indicate that tunicamycin induces a specific inhibitory effect, hinting to a more substantial role of the N-glycosylation pathway in P. falciparum intraerythrocytic asexual stages than previously thought. To sum up, our results place GPI biosynthesis and N-glycosylation pathways as metabolic routes with potential to yield much-needed therapeutic targets against the parasite.

Keywords: ALG7, UDP-N-acetylglucosamine:dolichyl-phosphateN-acetylglucosaminephosphotransferase; Antiplasmodial activity; CDS, Coding sequence; CSP, Circumsporozoite protein; DMSO, Dimethyl sulfoxide; ER, Endoplasmic reticulum; GPI, Glycosylphosphatidylinositol; GPI-anchors; GSL-II, Griffonia simplicifoliaII lectin; GWT1, Inositol acyltransferase; GlcNAc, N-acetylglucosamine; GlcNAc-PI de-N-acetylase, N-acetylglucosaminyl-phosphatidylinositol de-N-acetylase; IDC, Intraerythrocytic developmental cycle; Inhibitors; Malaria; N-glycans, Asparagine-linked glycans; N-glycosylation; OST, Oligosaccharyltransferase; Plasmodium falciparum; RBCs, Red blood cells; SHAM, Salicylic hydroxamic acid; UDP-GlcNAc, UDP-N-acetylglucosamine; pLDDT, Predicted local distance difference test.


Conflict of interest statement

The authors declare that they have no known competing financial interests or personal relationships that could have appeared to influence the work reported in this paper.

Figures

None
Graphical abstract
Fig. 1
Fig. 1
Biosynthesis of GPI anchors and N-glycosylation in the P. falciparum ER. Enzyme names are indicated in Table 1 and catalytic subunits are highlighted in red. The different compounds tested in this work and the enzymatic steps they inhibit are also displayed. The predicted byproducts of every reaction are included in the illustration. (For interpretation of the references to colour in this figure legend, the reader is referred to the web version of this article.)
Fig. 2
Fig. 2
GPI inhibitors suppress P. falciparum 3D7 growth at trophozoite stages. Microscopy Giemsa-stained smears of tightly synchronized (5 h window) P. falciparum parasites growth in presence of: (A) DMSO (as a carrier control); (B) SHAM; (C) gepinacin; and (D), manogepix. Images show the effect of compounds on parasite development at different time intervals.
Fig. 3
Fig. 3
Dose-response curves of GPI inhibitors. Percentage of P. falciparum 3D7 inhibition caused by treatment with different concentrations of: (A) SHAM; (B) gepinacin; or (C) manogepix. Graphs and calculated IC50s are representative of three biological replicates. IC50 values calculated for each compound are indicated within each plot (with 95% confidence interval in brackets).
Fig. 4
Fig. 4
Binding of natural ligands and inhibitors on PIGL. Top panels show the hydrophobic surface of the proteins (white: more hydrophobic, green: less hydrophobic), and bottom panels illustrate the interactions between residues (dark blue) and molecules (pink: GlcNAc-PI; light blue: SHAM). (For interpretation of the references to colour in this figure legend, the reader is referred to the web version of this article.)
Fig. 5
Fig. 5
Binding of natural ligands and inhibitors on GWT1. Top panels show the hydrophobic surface of the proteins (white: more hydrophobic, green: less hydrophobic), and bottom panels illustrate the interactions between residues (dark blue) and molecules (grey: GlcN-PI; orange: myristoyl-CoA; yellow: gepinacin; purple: manogepix). (For interpretation of the references to colour in this figure legend, the reader is referred to the web version of this article.)
Fig. 6
Fig. 6
Tunicamycin halts P. falciparum 3D7 growth at the trophozoite stage during the second IDC after treatment. Microscopy Giemsa-stained smears of tightly synchronized (5 h window) P. falciparum parasites growth in presence of: (A), DMSO (as a carrier control); and (B) tunicamycin. Images show the effect of compounds on parasite development during the second IDC at different time intervals. (C) Dose-response curve of tunicamycin during the second IDC post-treatment on P. falciparum 3D7 parasites. (D) Dose response curve of tunicamycin during the second IDC post-treatment on PfMev parasites growth in presence (filled circles) or absence (open triangles) of 50 µM mevalonate. Graphs and calculated IC50s (including 95% confidence interval in brackets) are representative of three biological replicates.
Fig. 7
Fig. 7
Tunicamycin delayed death is stronger in tight-synchronized trophozoites and reduces specific GSL-II labeling. (A) Selective treatment of 3 h-window rings (black bar) or trophozoites (grey bar) treated with tunicamycin show different inhibition percentages during the second IDC. Graph shows mean values ± SD from three replicates. Two-tailed unpaired Student t-test statistical significance (p < 0.01) is indicated by asterisks. (B) GlcNAc-binding lectin GSL-II blot with BSA-GlcNAc neoglycoprotein (1, Control) and extracts from P. falciparum rings (2), trophozoites (3), late trophozoites/schizonts (4) and uninfected red blood cells (5). (C) GSL-II lectin blot with BSA-GlcNAc (1, Control) and extracts from P. falciparum rings (2), trophozoites (3) and late trophozoites/schizonts (4), carried out with GSL-II pre-incubated without (left) or with 0.2 M of GlcNAc, to validate binding specificity. (D) GSL-II lectin blot with BSA-GlcNAc neoglycoprotein (1, Control) and extracts from P. falciparum trophozoites during the second IDC after DMSO (2) or tunicamycin treatment (3). A Coomassie-stained gel with DMSO (2) and tunicamycin treated (3) parasite extracts (right) is included as a loading control. (For interpretation of the references to colour in this figure legend, the reader is referred to the web version of this article.)
Fig. 8
Fig. 8
Binding of natural ligands and inhibitors on ALG7 (A) and PIGA (B). Top panels show the hydrophobic surface of the proteins (white: more hydrophobic, green: less hydrophobic), and bottom panels illustrate the interactions between residues (dark blue) and molecules (purple: UPD-GlcNAc; yellow: dolichyl phosphate; orange: phophatidylinositol; light blue: tunicamycin). (For interpretation of the references to colour in this figure legend, the reader is referred to the web version of this article.)

References

    1. WHO | World malaria report 2021. WHO 2021. https://doi.org/ISBN: 978-92-4-004049-6.
    1. WHO | World malaria report 2017. WHO 2018. https://doi.org/ISBN 978-92-4-156552-3.
    1. Menard D., Dondorp A. Antimalarial Drug Resistance: A Threat to Malaria Elimination. Cold Spring Harb Perspect Med. 2017;7(7):a025619. doi: 10.1101/cshperspect.a025619. - DOI - PMC - PubMed
    1. Wicht KJ, Mok S, Fidock DA. Molecular Mechanisms of Drug Resistance in Plasmodium falciparum Malaria. Https://DoiOrg/101146/Annurev-Micro-020518-115546 2020;74:431–54. https://doi.org/10.1146/ANNUREV-MICRO-020518-115546. - PMC - PubMed
    1. Ashley E.A., Dhorda M., Fairhurst R.M., Amaratunga C., Lim P., Suon S., et al. Spread of artemisinin resistance in Plasmodium falciparum malaria. N Engl J Med. 2014;371(5):411–423. doi: 10.1056/NEJMoa1314981. - DOI - PMC - PubMed