. 2022 Feb 9:10:734308.
doi: 10.3389/fpubh.2022.734308. eCollection 2022.

Resilience to COVID-19: Socioeconomic Disadvantage Associated With Positive Caregiver-Youth Communication and Youth Preventative Actions

Affiliations

Resilience to COVID-19: Socioeconomic Disadvantage Associated With Positive Caregiver-Youth Communication and Youth Preventative Actions

Andrew T Marshall et al. Front Public Health. .

Abstract

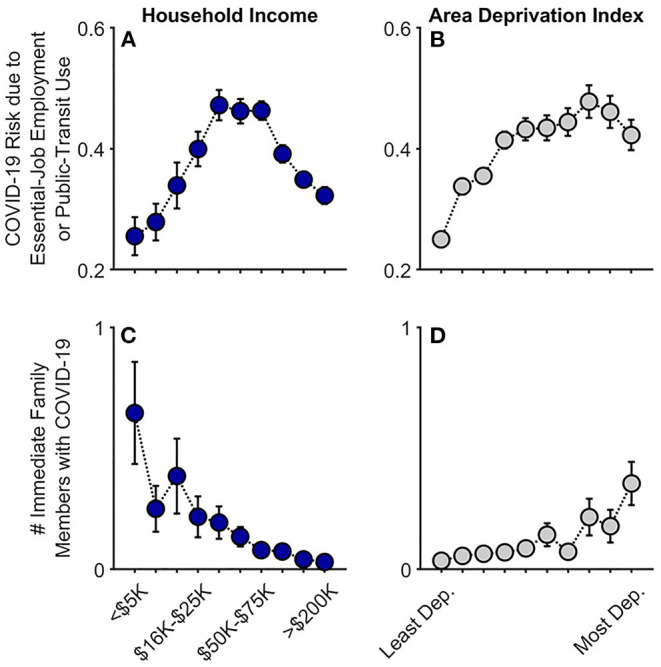
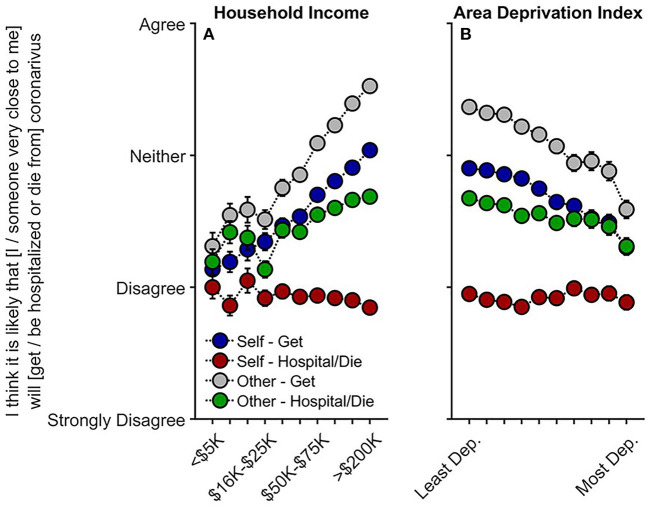
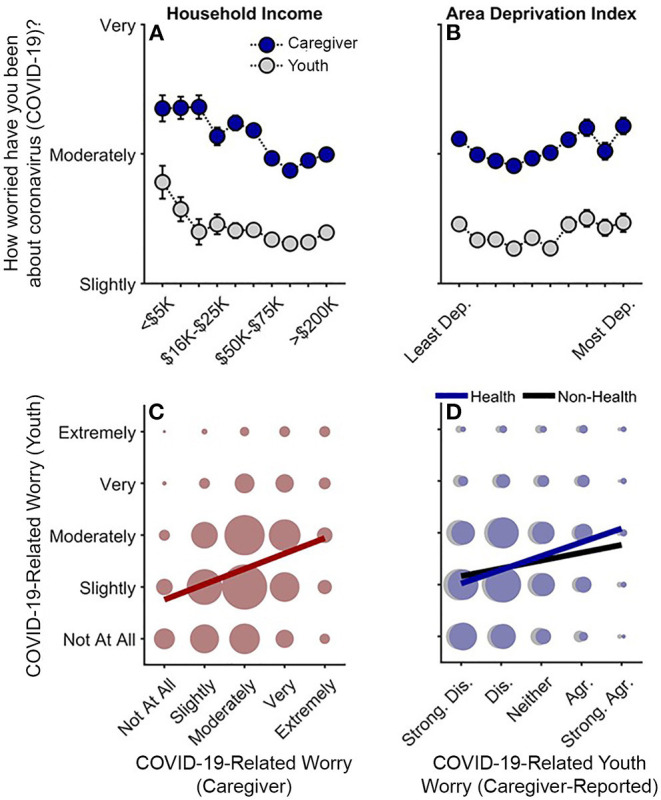
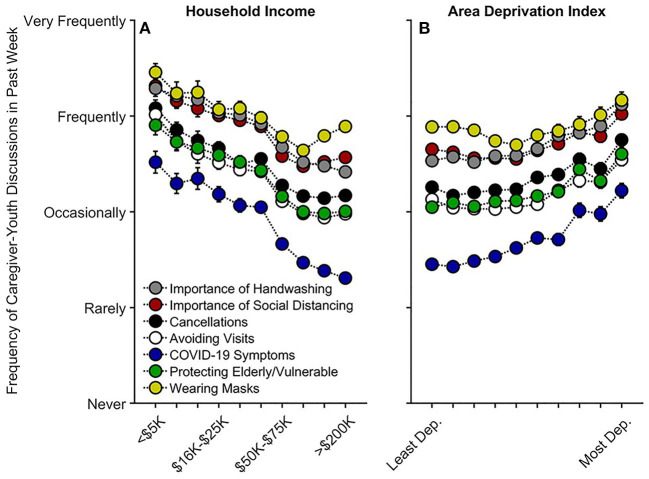
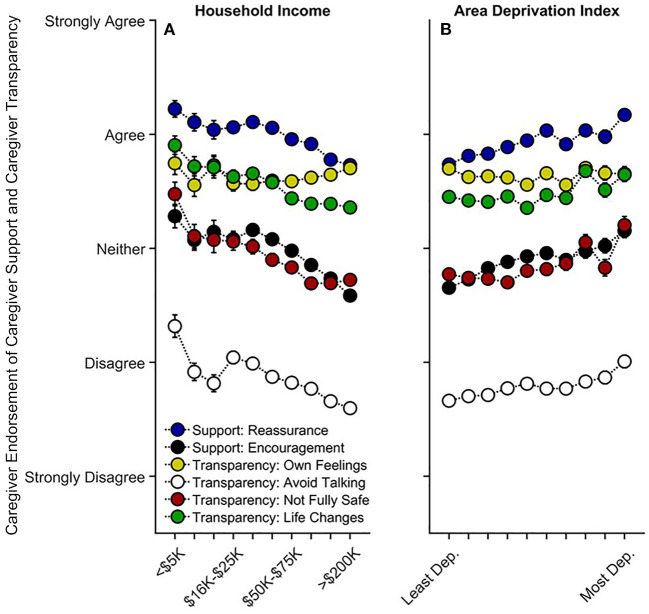
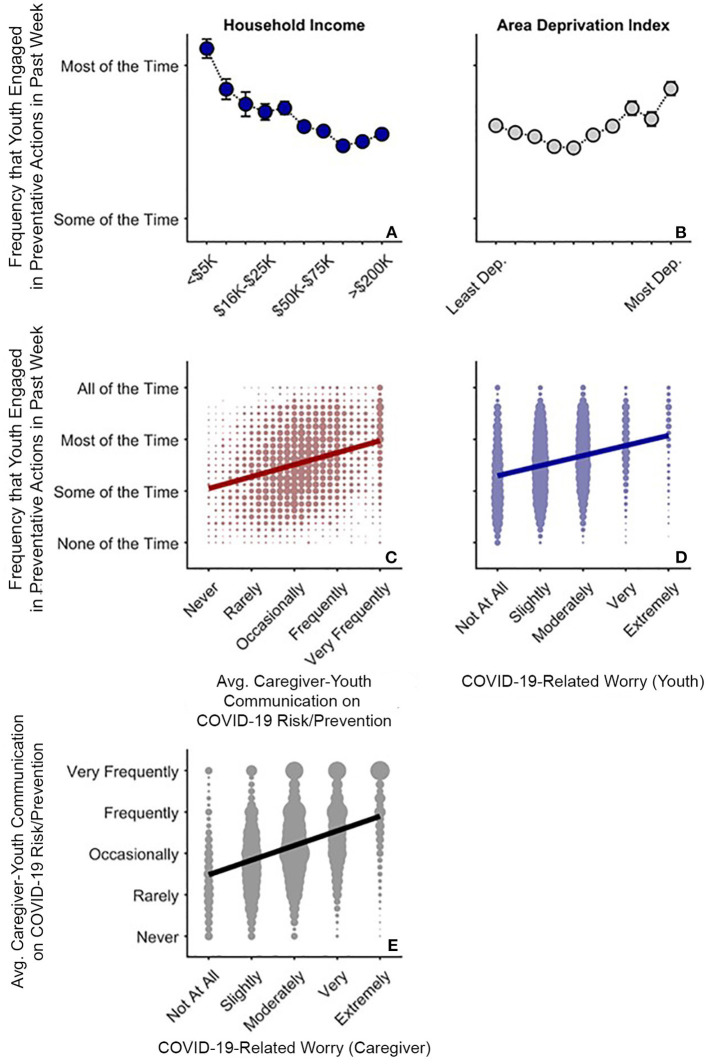
Socioeconomic disadvantage is associated with larger COVID-19 disease burdens and pandemic-related economic impacts. We utilized the longitudinal Adolescent Brain Cognitive Development Study to understand how family- and neighborhood-level socioeconomic disadvantage relate to disease burden, family communication, and preventative responses to the pandemic in over 6,000 youth-caregiver dyads. Data were collected at three timepoints (May-August 2020). Here, we show that both family- and neighborhood-level disadvantage were associated with caregivers' reports of greater family COVID-19 disease burden, less perceived exposure risk, more frequent caregiver-youth conversations about COVID-19 risk/prevention and reassurance, and greater youth preventative behaviors. Families with more socioeconomic disadvantage may be adaptively incorporating more protective strategies to reduce emotional distress and likelihood of COVID-19 infection. The results highlight the importance of caregiver-youth communication and disease-preventative practices for buffering the economic and disease burdens of COVID-19, along with policies and programs that reduce these burdens for families with socioeconomic disadvantage.

Keywords: COVID-19; adolescence; caregivers; pandemic; socioeconomic factors.


Conflict of interest statement

FCB and OK are employed by SRI International, a non-profit research organization. The authors declare that this study received funding from the National Institutes of Health, the National Science Foundation, and Children and Screens: Institute of Digital Media and Child Development Inc. The funders were not involved in the study design, collection, analysis, interpretation of data, and the writing of this article or the decision to submit it for publication. All authors declare no other competing interests.

Figures

Figure 1
Figure 1
COVID-19 exposure and within-family diagnoses as functions of annual household income and their home census tract's area deprivation index. Caregiver-reported data are shown for whether individuals in participants' households were at an increased risk given job type or public-transit use (A,B) and the number of participants' immediate family members who had been diagnosed with COVID-19 (C,D). Error bars are ±1 between-subjects standard error of the means. Analyses controlled for caregiver education, caregiver race, caregiver ethnicity, and participants' baseline study site. Given multiple observations, the job/transit risk analysis also controlled for questionnaire number and participant. Area deprivation index was collapsed across continuous deciles for graphing. Dep., Deprived.
Figure 2
Figure 2
Caregivers' perceived risk of their (or someone close to them) getting and being hospitalized/dying from COVID-19 as functions of (A) annual household income and (B) their home census tract's area deprivation index. With respect to questionnaire item wording, “Self” refers to “I,” and “Other” refers to “someone very close to me.” Error bars are ±1 between-subjects standard error of the means. Analyses controlled for caregiver education, caregiver race, caregiver ethnicity, questionnaire number, participants' baseline study site, and participant. Area deprivation index was collapsed across continuous deciles for graphing. Dep., Deprived.
Figure 3
Figure 3
Caregiver and youth worry levels about COVID-19. (A,B) Worry levels as functions of annual household income and area deprivation index. Error bars are ±1 between-subjects standard error of the means. Analyses of caregiver worry controlled for caregiver education, caregiver race, caregiver ethnicity, questionnaire number, participants' baseline study site, and participant ID. Analyses of youth worry controlled for caregiver education, child race, child ethnicity, child sex, child age, questionnaire number, participants' baseline study site, and participant. Area deprivation index was collapsed across continuous deciles for graphing. (C) Youths' worry levels by caregivers' worry levels. (D) Youths' worry levels by caregiver-reported youth worry levels about the health- and non-health-related consequences of the COVID-19 pandemic. (C,D) Circle size reflects the number of datapoints at each x-y coordinate. The solid lines are best fitting simple regression lines. Dep., Deprived; Strong. Dis., Strongly disagree; Dis., Disagree; Agr., Agree; Strong. Agr., Strongly agree.
Figure 4
Figure 4
Caregiver participants' communication frequency with youth on factors related to COVID-19 risk and prevention as functions of (A) annual household income and (B) their home census tract's area deprivation index. Error bars are ±1 between-subjects standard error of the means. Analyses controlled for caregiver education, caregiver race, caregiver ethnicity, child sex, child age, questionnaire number, participants' baseline study site, and participant, except for “Wearing Masks,” the analysis for which did not include questionnaire number or participant ID due to its only having one timepoint. Area deprivation index was collapsed across continuous deciles for graphing. Dep., Deprived.
Figure 5
Figure 5
Caregiver support and transparency as functions of (A) annual household income and (B) their home census tract's area deprivation index. Error bars are ±1 between-subjects standard error of the means. Analyses controlled for caregiver education, caregiver race, caregiver ethnicity, child sex, child age, questionnaire number, participants' baseline study site, and participant. Caregiver “reassurance” refers to how much caregivers agreed with, “I have told my child that everything will be okay.” Caregiver encouragement refers to how much caregivers agreed with, “I have encouraged my child not to focus on coronavirus or its impacts on people and the world.” “Own Feelings” refers to how much caregivers agreed with “I discussed with my child my own feelings about coronavirus and its impact on people and the world.” “Avoid Talking” refers to how much caregivers agreed with, “I have avoided talking to my child about coronavirus.” “Not Fully Safe” refers to how much caregivers agreed with, “I have expressed concern to my child that they might not be fully safe from coronavirus.” “Life Changes” refers to how much caregivers agree with, “I have prepared my child for our lives to change significantly.” Area deprivation index was collapsed across continuous deciles for graphing. Dep., Deprived.
Figure 6
Figure 6
COVID-19 risk and prevention as functions of COVID-19-related worry in caregivers and youth. (A,B) Average (Avg.) frequency that youth endorsed COVID-19-related preventative behaviors as functions of annual household income and area deprivation index. Error bars are ±1 between-subjects standard error of the means. Analysis controlled for caregiver education, child race, ethnicity, sex, and age, questionnaire number, participants' baseline study site, and participant. Area deprivation index was collapsed across continuous deciles for graphing. (C) Frequency of youths' preventative behaviors by caregiver-youth risk/prevention communication frequency (i.e., averaged data from Figure 4). (D) Frequency of youths' preventative behaviors by youth COVID-19-related worry. (E) Frequency of caregiver-child risk/prevention communication by caregiver COVID-19-related worry. (C–E) Circle size reflects the number of datapoints at each x-y coordinate. Solid lines are best fitting simple regression lines.

Update of

References

    1. Bambra C, Riordan R, Ford J, Matthews F. The COVID-19 pandemic and health inequalities. J Epidemiol Community Health. (2020) 74:964–8. 10.1136/jech-2020-214401 - DOI - PMC - PubMed
    1. Chen JT, Krieger N. Revealing the unequal burden of COVID-19 by income, race/ethnicity, and household crowding: US county versus zip code analyses. J Public Health Manage Pract. (2021) 27:S43–S56. 10.1097/PHH.0000000000001263 - DOI - PubMed
    1. Whittle RS, Diaz-Artiles A. An ecological study of socioeconomic predictors in detection of COVID-19 cases across neighborhoods in New York City. BMC Med. (2020) 18:271. 10.1186/s12916-020-01731-6 - DOI - PMC - PubMed
    1. Karmakar M, Lantz PM, Tipirneni R. Association of social and demographic factors with COVID-19 incidence and death rates in the US. JAMA Netw Open. (2021) 4:e2036462. 10.1001/jamanetworkopen.2020.36462 - DOI - PMC - PubMed
    1. Karaye IM, Horney JA. The impact of social vulnerability on COVID-19 in the U.S.: an analysis of spatially varying relationships. Am J Prev Med. (2020) 59:317–25. 10.1016/j.amepre.2020.06.006 - DOI - PMC - PubMed

Publication types