

A Ferroptosis-Related Gene Prognostic Index Associated With Biochemical Recurrence and Radiation Resistance for Patients With Prostate Cancer Undergoing Radical Radiotherapy
- PMID: 35223835
- PMCID: PMC8867172
- DOI: 10.3389/fcell.2022.803766
A Ferroptosis-Related Gene Prognostic Index Associated With Biochemical Recurrence and Radiation Resistance for Patients With Prostate Cancer Undergoing Radical Radiotherapy
Abstract
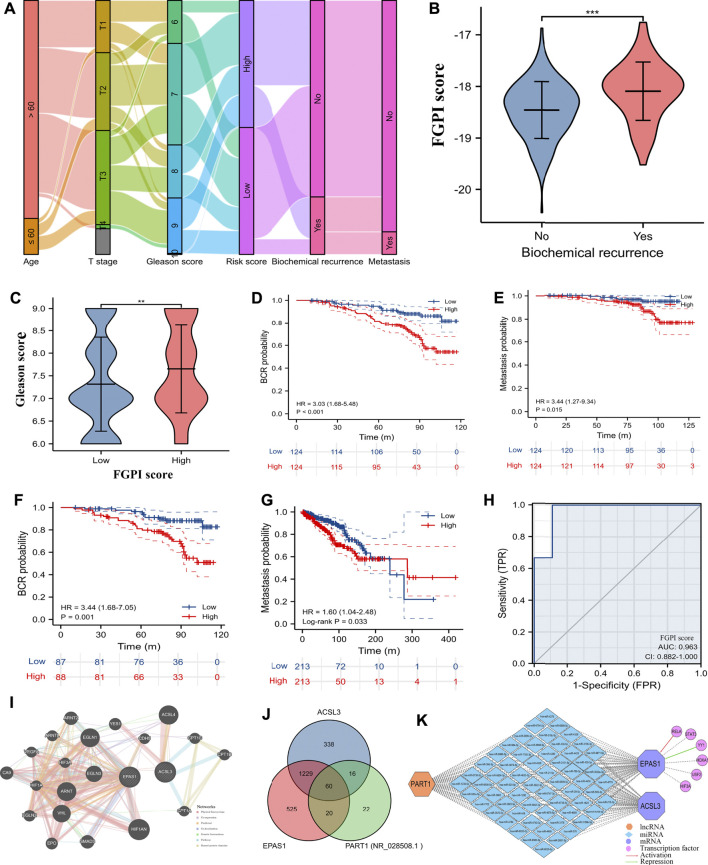
Background: Ferroptosis is a new type of programmed cell death which has been reported to be involved in the development of various cancers. In this study, we attempted to explore the possible links between ferroptosis and prostate cancer (PCa), and a novel ferroptosis-related gene prognostic index (FGPI) was constructed to predict biochemical recurrence (BCR) and radiation resistance for PCa patients undergoing radical radiotherapy (RRT). Moreover, the tumor immune microenvironment (TME) of PCa was analyzed. Methods: We merged four GEO datasets by removing batch effects. All analyses were conducted with R version 3.6.3 and its suitable packages. Cytoscape 3.8.2 was used to establish a network of transcriptional factor and competing endogenous RNA. Results: We established the FGPI based on ACSL3 and EPAS1. We observed that FGPI was an independent risk factor of BCR for PCa patients (HR: 3.03; 95% CI: 1.68-5.48), consistent with the result of internal validation (HR: 3.44; 95% CI: 1.68-7.05). Furthermore, FGPI showed high ability to identify radiation resistance (AUC: 0.963; 95% CI: 0.882-1.00). LncRNA PART1 was significantly associated with BCR and might modulate the mRNA expression of EPAS1 and ACSL3 through interactions with 60 miRNAs. Gene set enrichment analysis indicated that FGPI was enriched in epithelial-mesenchymal transition, allograft rejection, TGF beta signaling pathway, and ECM receptor interaction. Immune checkpoint and m6A analyses showed that PD-L2, CD96, and METTL14 were differentially expressed between BCR and no BCR groups, among which CD96 was significantly associated with BCR-free survival (HR: 1.79; 95% CI: 1.06-3.03). We observed that cancer-related fibroblasts (CAFs), macrophages, stromal score, immune score, estimate score, and tumor purity were differentially expressed between BCR and no BCR groups and closely related to BCR-free survival (HRs were 2.17, 1.79, 2.20, 1.93, 1.92, and 0.52 for cancer-related fibroblasts, macrophages, stromal score, immune score, estimate score, and tumor purity, respectively). Moreover, cancer-related fibroblasts (coefficient: 0.20), stromal score (coefficient: 0.14), immune score (coefficient: 0.14), estimate score (coefficient: 0.15), and tumor purity (coefficient: -0.15) were significantly related to FGPI, among which higher positive correlation between cancer-related fibroblasts and FGPI was observed. Conclusion: We found that FGPI based on ACSL3 and EPAS1 might be used to predict BCR and radiation resistance for PCa patients. CD96 and PD-L2 might be a possible target for drug action. Besides, we highlighted the importance of immune evasion in the process of BCR.
Keywords: biochemical recurrence; ferroptosis-related gene prognostic index; immune checkpoint; prostate cancer; tumor immune microenvironment.
Copyright © 2022 Feng, Shi, Xiong, Zhang, Li, Wei and Yang.
Conflict of interest statement
The authors declare that the research was conducted in the absence of any commercial or financial relationships that could be construed as a potential conflict of interest.
Figures


Similar articles
-
A cellular senescence-related gene prognostic index for biochemical recurrence and drug resistance in patients with prostate cancer.Am J Cancer Res. 2022 Aug 15;12(8):3811-3828. eCollection 2022. Am J Cancer Res. 2022. PMID: 36119834 Free PMC article.
-
An autophagy-related gene prognostic index predicting biochemical recurrence, metastasis, and drug resistance for prostate cancer.Asian J Androl. 2023 Mar-Apr;25(2):208-216. doi: 10.4103/aja202281. Asian J Androl. 2023. PMID: 36412461 Free PMC article.
-
A Gene Prognostic Index Associated With Epithelial-Mesenchymal Transition Predicting Biochemical Recurrence and Tumor Chemoresistance for Prostate Cancer.Front Oncol. 2022 Jan 12;11:805571. doi: 10.3389/fonc.2021.805571. eCollection 2021. Front Oncol. 2022. PMID: 35096608 Free PMC article.
-
The prognostic value of long noncoding RNAs in prostate cancer: a systematic review and meta-analysis.Oncotarget. 2017 May 7;8(34):57755-57765. doi: 10.18632/oncotarget.17645. eCollection 2017 Aug 22. Oncotarget. 2017. PMID: 28915709 Free PMC article. Review.
-
Deciphering the Tumor Microenvironment in Prostate Cancer: A Focus on the Stromal Component.Cancers (Basel). 2024 Oct 31;16(21):3685. doi: 10.3390/cancers16213685. Cancers (Basel). 2024. PMID: 39518123 Free PMC article. Review.
Cited by
-
Membrane tension-mediated stiff and soft tumor subtypes closely associated with prognosis for prostate cancer patients.Eur J Med Res. 2023 May 13;28(1):172. doi: 10.1186/s40001-023-01132-4. Eur J Med Res. 2023. PMID: 37179366 Free PMC article.
-
A novel ferroptosis-related gene prognostic index for prognosis and response to immunotherapy in patients with prostate cancer.Front Endocrinol (Lausanne). 2022 Aug 10;13:975623. doi: 10.3389/fendo.2022.975623. eCollection 2022. Front Endocrinol (Lausanne). 2022. PMID: 36034466 Free PMC article.
-
Establishment of novel ferroptosis-related prognostic subtypes correlating with immune dysfunction in prostate cancer patients.Heliyon. 2023 Dec 9;10(1):e23495. doi: 10.1016/j.heliyon.2023.e23495. eCollection 2024 Jan 15. Heliyon. 2023. PMID: 38187257 Free PMC article.
-
Metabolism-regulated ferroptosis in cancer progression and therapy.Cell Death Dis. 2024 Mar 8;15(3):196. doi: 10.1038/s41419-024-06584-y. Cell Death Dis. 2024. PMID: 38459004 Free PMC article. Review.
-
Cancer-Associated Fibroblast Heterogeneity, Activation and Function: Implications for Prostate Cancer.Biomolecules. 2022 Dec 29;13(1):67. doi: 10.3390/biom13010067. Biomolecules. 2022. PMID: 36671452 Free PMC article. Review.
References
-
- Amling C. L., Blute M. L., Bergstralh E. J., Seay T. M., Slezak J., Zincke H. (2000). Long-term hazard of Progression after Radical Prostatectomy for Clinically Localized Prostate Cancer: Continued Risk of Biochemical Failure after 5 Years. J. Urol. 164 (1), 101–105. 10.1097/00005392-200007000-00023 - DOI - PubMed
-
- Antonarakis E. S., Feng Z., Trock B. J., Humphreys E. B., Carducci M. A., Partin A. W., et al. (2012). The Natural History of Metastatic Progression in Men with Prostate-specific Antigen Recurrence after Radical Prostatectomy: Long-Term Follow-Up. BJU Int. 109 (1), 32–39. 10.1111/j.1464-410x.2011.10422.x - DOI - PMC - PubMed
LinkOut - more resources
Full Text Sources
Research Materials
Miscellaneous