. 2022 Feb 10:10:805291.
doi: 10.3389/fcell.2022.805291. eCollection 2022.

Clinical Significance and Immune Landscape of a Pyroptosis-Derived LncRNA Signature for Glioblastoma

Affiliations

Clinical Significance and Immune Landscape of a Pyroptosis-Derived LncRNA Signature for Glioblastoma

Zhe Xing et al. Front Cell Dev Biol. .

Abstract

Introduction: Pyroptosis was recently implicated in the initiation and progression of tumors, including glioblastoma (GBM). This study aimed to explore the clinical significance of pyroptosis-related lncRNAs (PRLs) in GBM. Methods: Three independent cohorts were retrieved from the TCGA and CGGA databases. The consensus clustering and weighted gene coexpression network analysis (WGCNA) were applied to identify PRLs. The LASSO algorithm was employed to develop and validate a pyroptosis-related lncRNA signature (PRLS) in three independent cohorts. The molecular characteristics, clinical significances, tumor microenvironment, immune checkpoints profiles, and benefits of chemotherapy and immunotherapy regarding to PRLS were also explored. Results: In the WGCNA framework, a key module that highly correlated with pyroptosis was extracted for identifying PRLs. Univariate Cox analysis further revealed the associations between PRLs and overall survival. Based on the expression profiles of PRLs, the PRLS was initially developed in TCGA cohort (n = 143) and then validated in two CGGA cohorts (n = 374). Multivariate Cox analysis demonstrated that our PRLS model was an independent risk factor. More importantly, this signature displayed a stable and accurate performance in predicting prognosis at 1, 3, and 5 years, with all AUCs above 0.7. The decision curve analysis also indicated that our signature had promising clinical application. In addition, patients with high PRLS score suggested a more abundant immune infiltration, higher expression of immune checkpoint genes, and better response to immunotherapy but worse to chemotherapy. Conclusion: A novel pyroptosis-related lncRNA signature with a robust performance was constructed and validated in multiple cohorts. This signature provided new perspectives for clinical management and precise treatments of GBM.

Keywords: chemotherapy; glioblastoma (GBM); immune landscape; immunotherapy; long non-coding RNA; prognostic signature; pyroptosis.


Conflict of interest statement

The authors declare that the research was conducted in the absence of any commercial or financial relationships that could be construed as a potential conflict of interest.

Figures
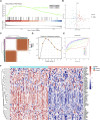
FIGURE 1
FIGURE 1
The gene set enrichment analysis (GSEA) and consensus clustering of pyroptosis-related gene set. (A) Gene set enrichment analysis showed pyroptosis-related signatures significantly enriched in glioblastoma (GBM) patients. (B) Two-dimensional principle component plot by gene profile of 51 pyroptosis-related genes (PRGs). Each point represents a single sample, with different colors indicating the different clusters. (C) The clustering heatmap of GBM samples when k = 2. (D) The proportion of ambiguous clustering (PAC) score; a low value of PAC implies a flat middle segment, allowing conjecture of the optimal k (k = 2) by the lowest PAC. (E) The cumulative distribution functions of clustering heatmaps for each k (indicated by colors). (F) The pyroptosis cluster of GBM patients in The Cancer Genome Atlas (TCGA) cohort.
FIGURE 2
FIGURE 2
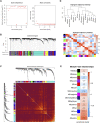
Weighted gene coexpression network analysis. (A) Analysis of network topology for various soft-thresholding powers. The left panel shows the scale-free fit index (y-axis) as a function of the soft-thresholding power (x-axis). The right panel displays the mean connectivity (degree, y-axis) as a function of the soft-thresholding power (x-axis). (B) Clustering dendrogram of genes, with dissimilarity based on topological overlap, together with assigned module colors. (C) Visualizing the gene network using a heatmap plot. The heatmap depicts the Topological Overlap Matrix (TOM) among all genes in the analysis. Light color represents low overlap and the progressively darker red color represents a higher overlap. Blocks of darker colors along the diagonal are the modules. (D) Visualization of the eigengene network representing the relationships among the modules and the clinical trait weight. (E) Module-trait associations: Each row corresponds to a module eigengene and the column to the pyroptosis cluster. Each cell contains the corresponding correlation and p-value.
FIGURE 3
FIGURE 3
Identification and of prognostic pyroptosis-related long noncoding RNAs (lncRNAs) and further Kaplan–Meier (KM) analysis. (A) Univariate Cox regression was utilized to identify 19 prognostic pyroptosis-related lncRNAs, and the corresponding p-values and hazard ratio values were also exhibited. (B–T) KM curves were illustrated to exhibit the relationship between overall survival (OS) and the expression levels of these 19 pyroptosis-related lncRNAs (PRLs) based on the optimal cutoff points.
FIGURE 4
FIGURE 4
Construction of the pyroptosis-related lncRNA signature (PRLS). (A) LASSO coefficient profiles of the candidate PRLs for PRLS construction. (B) Ten-time cross-validations to tune the parameter selection in the LASSO model. The two dotted vertical lines are drawn at the optimal values by minimum criteria (left) and 1-SE criteria (right). (C) LASSO coefficient profiles of the candidate genes for RAIS construction. (D–F) The scattergrams of the risk score (up) and survival status (down) of each patient in the TCGA, c325, c693 cohorts, respectively. In the upper parts of the scattergrams, the red and green dots represent high-risk (“H”) and low-risk groups (“L”), respectively, and in the lower part of the scattergrams, death and survival, respectively. (G–I) Kaplan–Meier overall survival (OS) analysis of the high-risk and low-risk groups based on the PRLS and median risk scores in the TCGA, c325, c693 cohorts, respectively. (J) Kaplan–Meier curve of disease-specific survival (DSS) in the TCGA cohort. (K) Kaplan–Meier curve of progression free survival (PFS) in the TCGA cohort.
FIGURE 5
FIGURE 5
Prediction performance and independence of the PRLS. (A–C) Time-dependent receiver operating characteristic curve (ROC) analysis for predicting overall survival (OS) at 1-, 3-, and 5-years (D–F) Decision curve analysis (DCA) curves to evaluate the clinical utility of different decision strategies, and the red line represented the PRLS. (G–H) Multivariate Cox regression analysis of the risk score in three cohorts.
FIGURE 6
FIGURE 6
Biological functions and immune landscape regarding PRLS. (A) The enriched gene sets in HALLMARK collection by the high-risk groups. Each line representing one particular gene set with unique color, and upregulated genes located in the left approaching the origin of the coordinates; by contrast the downregulated lay on the right of x-axis. Only gene sets with normalized enrichment score |NES| >2 and false discovery rate (FDR) <0.01 were considered significant. Only several leading gene sets were displayed in the plot. (B) The distribution difference of ESTIMATE, immune, stromal, and tumor purity enrichment score between the high-risk and low-risk groups. nsp > 0.05, *p < 0.05. (C–F) Heatmaps of immune cells infiltration in the high-risk and low-risk groups based on ssGSEA, xCell, MCPcounter, and CIBERSORT algorithms, respectively.
FIGURE 7
FIGURE 7
Evaluation of immune checkpoint profiles, immunotherapy, and chemotherapy between risk groups. (A–C) Three heatmaps of 27 immune checkpoints profiles in high-risk and low-risk groups. *p < 0.05, **p < 0.01, ***p < 0.001. (D) Submap analysis of the TCGA cohort and 47 previous melanoma patients with detailed immunotherapeutic information. (E) The distribution difference of T-cell inflammatory signature (TIS) score between the high- and low-risk groups. *p < 0.05. (F) Distribution of the immunotherapy response results predicted by the Tumor Immune Dysfunction and Exclusion (TIDE) algorithm among the high- and low-risk groups in the TCGA cohort. (G–I) Distribution of the estimated half-maximal inhibitory concentration (IC50) of bleomycin (G), docetaxel (H), and paclitaxel (I) between the high- and low-risk groups in TCGA cohort.

Similar articles

Cited by

References

    1. Ayers M., Lunceford J., Nebozhyn M., Murphy E., Loboda A., Kaufman D. R., et al. (2017). IFN-γ-related mRNA Profile Predicts Clinical Response to PD-1 Blockade. J. Clin. Invest. 127 (8), 2930–2940. 10.1172/JCI91190 - DOI - PMC - PubMed
    1. Delgado‐Martín B., Medina M. Á. (2020). Advances in the Knowledge of the Molecular Biology of Glioblastoma and its Impact in Patient Diagnosis, Stratification, and Treatment. Adv. Sci. 7 (9), 1902971. 10.1002/advs.201902971 - DOI - PMC - PubMed
    1. Ding J., Wang K., Liu W., She Y., Sun Q., Shi J., et al. (2016). Erratum: Pore-Forming Activity and Structural Autoinhibition of the Gasdermin Family. Nature 540 (7631), 150. 10.1038/nature20106 - DOI - PubMed
    1. Fang Y., Tian S., Pan Y., Li W., Wang Q., Tang Y., et al. (2020). Pyroptosis: A New Frontier in Cancer. Biomed. Pharmacother. 121, 109595. 10.1016/j.biopha.2019.109595 - DOI - PubMed
    1. Geeleher P., Cox N., Huang R. S. (2014). pRRophetic: an R Package for Prediction of Clinical Chemotherapeutic Response from Tumor Gene Expression Levels. PLoS One 9 (9), e107468. 10.1371/journal.pone.0107468 - DOI - PMC - PubMed

LinkOut - more resources