. 2022 Feb 11:10:807149.
doi: 10.3389/fcell.2022.807149. eCollection 2022.

Protein Posttranslational Signatures Identified in COVID-19 Patient Plasma

Affiliations

Protein Posttranslational Signatures Identified in COVID-19 Patient Plasma

Pavan Vedula et al. Front Cell Dev Biol. .

Abstract

Severe acute respiratory syndrome coronavirus-2 (SARS-CoV-2) is a highly contagious virus of the coronavirus family that causes coronavirus disease-19 (COVID-19) in humans and a number of animal species. COVID-19 has rapidly propagated in the world in the past 2 years, causing a global pandemic. Here, we performed proteomic analysis of plasma samples from COVID-19 patients compared to healthy control donors in an exploratory study to gain insights into protein-level changes in the patients caused by SARS-CoV-2 infection and to identify potential proteomic and posttranslational signatures of this disease. Our results suggest a global change in protein processing and regulation that occurs in response to SARS-CoV-2, and the existence of a posttranslational COVID-19 signature that includes an elevation in threonine phosphorylation, a change in glycosylation, and a decrease in arginylation, an emerging posttranslational modification not previously implicated in infectious disease. This study provides a resource for COVID-19 researchers and, longer term, and will inform our understanding of this disease and its treatment.

Keywords: COVID-19; arginylation; peptidomics; posttranslational modifications; proteomics.


Conflict of interest statement

The authors declare that the research was conducted in the absence of any commercial or financial relationships that could be construed as a potential conflict of interest.

Figures
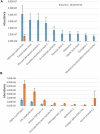
FIGURE 1
FIGURE 1
Plasma peptides from COVID-19 patients exhibits prominent changes compared to control. Combined total intensities of all significantly changed peptides for each parent protein listed on the X axis. A and B show the most abundant peptide groups in control (A) and COVID-19 (B). See Supplementary Figure S2 for the full list of proteins with significantly changed peptides. Error bars represent SEM (n = 7 for control, 6 for COVID-19).
FIGURE 2
FIGURE 2
Fibrinogen- and serglycin-derived peptides exhibit differential abundance changes between COVID-19 and control, suggesting different proteolytic patterns in response to Sars-CoV-2 infection. Normalized intensities of the most abundant individual peptides in control and COVID-19 plasma samples are shown for fibrinogen (A) and serglycin (B). Peptides in A are plotted in two charts on two different scales, including one overlapping peptide is shown in both charts for scale ([G]. EFVSETESRGSE[S] indicated with a gray arrow in both charts). Error bars represent SEM (n = 7 for control, 6 for COVID-19).
FIGURE 3
FIGURE 3
Plasma proteins from COVID-19 patients exhibits prominent changes compared to control. iBAQ intensities of the most abundant proteins showing significant differences between COVID-19 and control. See Supplementary Figure S4 for the full list of hits. Bars represent normalized intensity levels averaged for all samples in each group, error bars represent SEM (n = 7 for control, 6 for COVID-19).
FIGURE 4
FIGURE 4
Plasma proteins from COVID-19 patients exhibits changes in the overall levels of several physiological posttranslational modifications. Normalized spectra counts for high (A), intermediate (B), and low abundance (C) hits are plotted on different scales. Error bars represent SEM (n = 7 for control, 6 for COVID-19). p values calculated by 2-tailed Student’s T-test are listed on top of each set of bars.

References

    1. Ahmed S., Zimba O., Gasparyan A. Y. (2020). Thrombosis in Coronavirus Disease 2019 (COVID-19) through the Prism of Virchow's Triad. Clin. Rheumatol. 39 (9), 2529–2543. 10.1007/s10067-020-05275-1 - DOI - PMC - PubMed
    1. Anand P., Puranik A., Aravamudan M., Venkatakrishnan A., Soundararajan V. (2020). SARS-CoV-2 Strategically Mimics Proteolytic Activation of Human ENaC. Elife 9. 10.7554/eLife.58603 - DOI - PMC - PubMed
    1. Arapidi G., Osetrova M., Ivanova O., Butenko I., Saveleva T., Pavlovich P., et al. (2018). Peptidomics Dataset: Blood Plasma and Serum Samples of Healthy Donors Fractionated on a Set of Chromatography Sorbents. Data in Brief 18, 1204–1211. 10.1016/j.dib.2018.04.018 - DOI - PMC - PubMed
    1. Chi H., Liu C., Yang H., Zeng W.-F., Wu L., Zhou W.-J., et al. (2018). Comprehensive Identification of Peptides in Tandem Mass Spectra Using an Efficient Open Search Engine. Nat. Biotechnol. 36, 1059–1061. 10.1038/nbt.4236 - DOI - PubMed
    1. Cox J., Mann M. (2008). MaxQuant Enables High Peptide Identification Rates, Individualized p.p.b.-Range Mass Accuracies and Proteome-Wide Protein Quantification. Nat. Biotechnol. 26 (12), 1367–72. 10.1038/nbt.1511 - DOI - PubMed