

Blockade of GCH1/BH4 Axis Activates Ferritinophagy to Mitigate the Resistance of Colorectal Cancer to Erastin-Induced Ferroptosis
- PMID: 35223839
- PMCID: PMC8866854
- DOI: 10.3389/fcell.2022.810327
Blockade of GCH1/BH4 Axis Activates Ferritinophagy to Mitigate the Resistance of Colorectal Cancer to Erastin-Induced Ferroptosis
Abstract
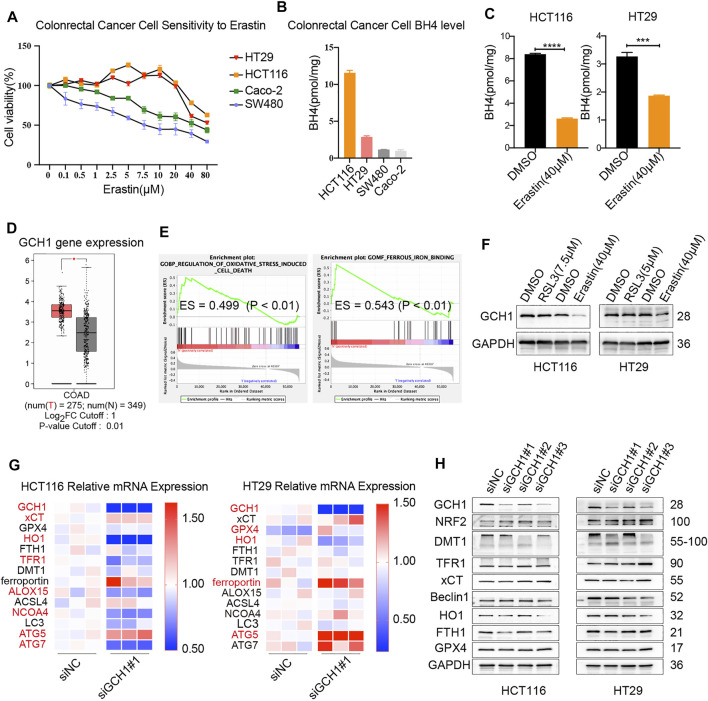
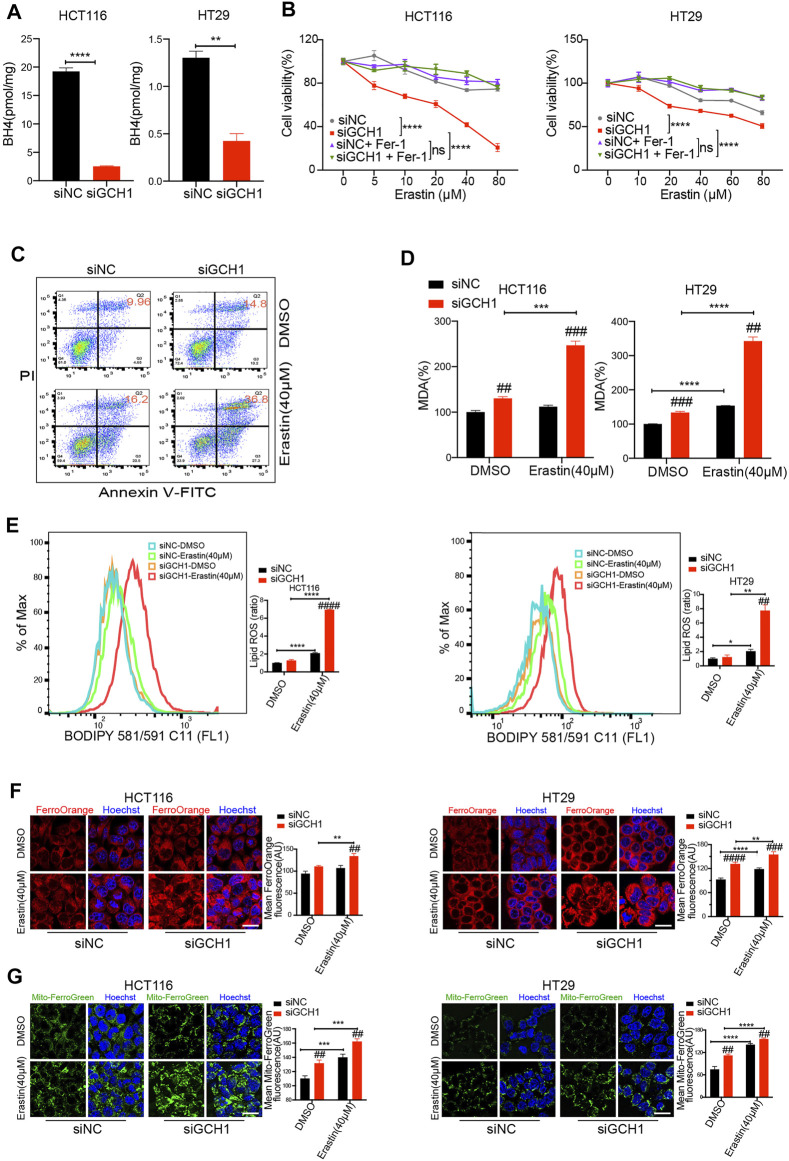
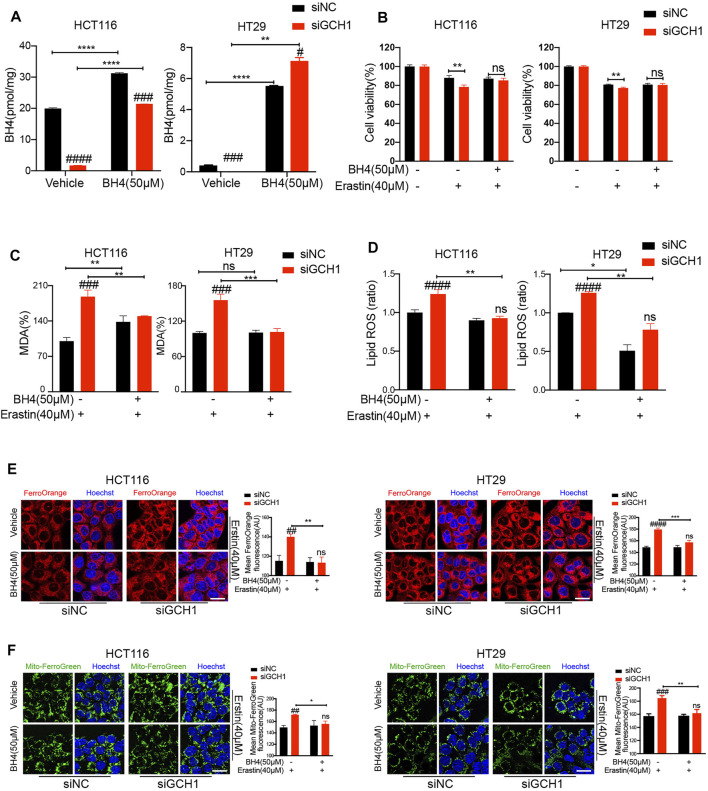
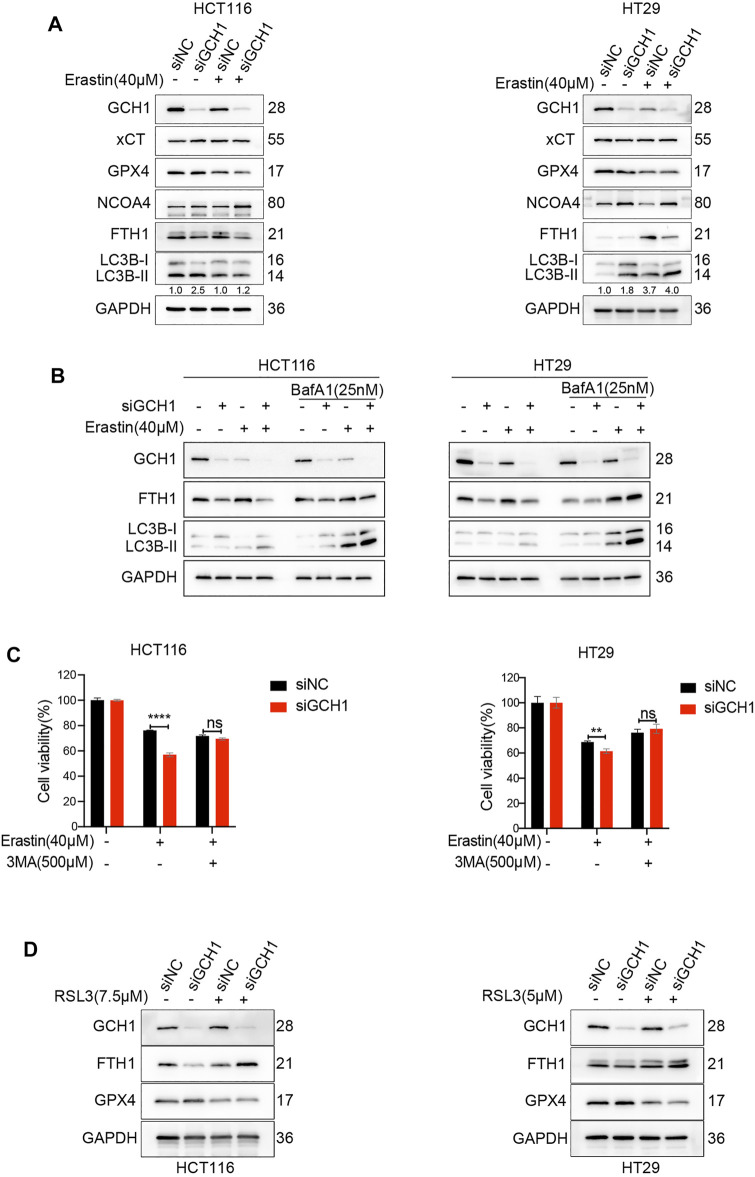
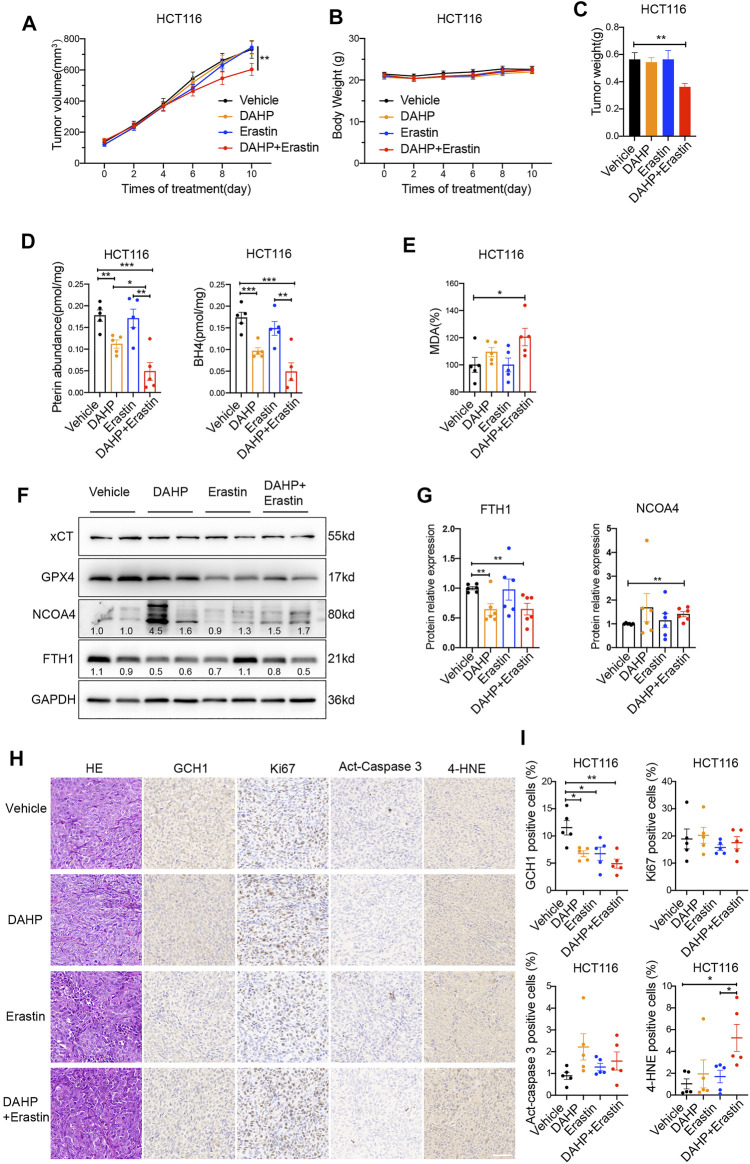
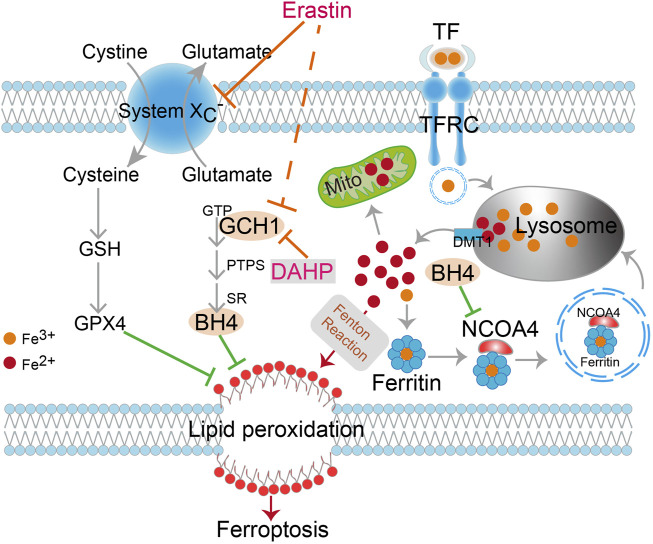
Ferroptosis, a type of cell death triggered by excessive accumulation of iron-dependent lipid peroxidation, possesses an excellent potential in cancer treatment. However, many colorectal cancer (CRC) cell lines are resistant to ferroptosis induced by erastin and RSL3, the classical ferroptotic inducers. Moreover, the underlying mechanism of resistance remains poorly elucidated. This study sought to discover the major factor contributing to ferroptosis resistance in CRC. The study findings will help design strategies for triggering ferroptosis for application in individualized tumor therapy. Here, we show that tetrahydrobiopterin (BH4) determines the sensitivity of CRC cells to ferroptosis induced by erastin. GTP cyclohydrolase-1 (GCH1) is the first rate-limiting enzyme of BH4. Genetic or pharmacological inhibition of GCH1 decreased BH4 and assisted erastin in cell death induction, lipid peroxidation enhancement, and ferrous iron accumulation. BH4 supplementation completely inhibited ferroptotic features resulting from GCH1 knockdown. Unexpectedly, GCH1 knockdown failed to enhance RSL3-induced cell death in CRC. Mechanistically, GCH1 knockdown drastically activated ferritinophagy during erastin treatment rather than RSL3 treatment. Administration of an autophagy inhibitor reversed erastin resistance in GCH1-knockdown cells. GCH1 inhibitor and erastin co-treatment in vivo synergistically inhibited tumor growth in CRC. Overall, our results identified GCH1/BH4 metabolism as a burgeoning ferroptosis defense mechanism in CRC. Inhibiting GCH1/BH4 metabolism promoted erastin-induced ferroptosis by activating ferritinophagy, suggesting that combining GCH1 inhibitors with erastin in the treatment of CRC is a novel therapeutic strategy.
Keywords: GCH1; colorectal cancer; erastin; ferritinophagy; ferroptosis; tetrahydrobiopterin.
Copyright © 2022 Hu, Wei, Wu, Huang, Li, Li, Yin, Peng, Lu, Zhao and Liu.
Conflict of interest statement
The authors declare that the research was conducted in the absence of any commercial or financial relationships that could be construed as a potential conflict of interest.
Figures
Similar articles
-
NCOA4-mediated ferritinophagy promotes ferroptosis induced by erastin, but not by RSL3 in HeLa cells.Biochim Biophys Acta Mol Cell Res. 2021 Feb;1868(2):118913. doi: 10.1016/j.bbamcr.2020.118913. Epub 2020 Nov 25. Biochim Biophys Acta Mol Cell Res. 2021. PMID: 33245979
-
GTP Cyclohydrolase 1/Tetrahydrobiopterin Counteract Ferroptosis through Lipid Remodeling.ACS Cent Sci. 2020 Jan 22;6(1):41-53. doi: 10.1021/acscentsci.9b01063. Epub 2019 Dec 27. ACS Cent Sci. 2020. PMID: 31989025 Free PMC article.
-
Inhibition of SRSF9 enhances the sensitivity of colorectal cancer to erastin-induced ferroptosis by reducing glutathione peroxidase 4 expression.Int J Biochem Cell Biol. 2021 May;134:105948. doi: 10.1016/j.biocel.2021.105948. Epub 2021 Feb 17. Int J Biochem Cell Biol. 2021. PMID: 33609745
-
Lipid Peroxidation-Dependent Cell Death Regulated by GPx4 and Ferroptosis.Curr Top Microbiol Immunol. 2017;403:143-170. doi: 10.1007/82_2016_508. Curr Top Microbiol Immunol. 2017. PMID: 28204974 Review.
-
Novel Therapeutic Savior for Osteosarcoma: The Endorsement of Ferroptosis.Front Oncol. 2022 Mar 24;12:746030. doi: 10.3389/fonc.2022.746030. eCollection 2022. Front Oncol. 2022. PMID: 35402247 Free PMC article. Review.
Cited by
-
Ferroptosis: Emerging Role in Diseases and Potential Implication of Bioactive Compounds.Int J Mol Sci. 2023 Dec 8;24(24):17279. doi: 10.3390/ijms242417279. Int J Mol Sci. 2023. PMID: 38139106 Free PMC article. Review.
-
A New Perspective in the Treatment of Ischemic Stroke: Ferroptosis.Neurochem Res. 2024 Apr;49(4):815-833. doi: 10.1007/s11064-023-04096-3. Epub 2024 Jan 3. Neurochem Res. 2024. PMID: 38170383 Review.
-
Targeting Ferroptosis Holds Potential for Intervertebral Disc Degeneration Therapy.Cells. 2022 Nov 5;11(21):3508. doi: 10.3390/cells11213508. Cells. 2022. PMID: 36359904 Free PMC article. Review.
-
Ninety-six-hour starved peripheral blood mononuclear cell supernatant inhibited LA7 breast cancer stem cells induced tumor via reduction in angiogenesis and alternations in Gch1 and Spr expressions.Front Immunol. 2023 Feb 23;13:1025933. doi: 10.3389/fimmu.2022.1025933. eCollection 2022. Front Immunol. 2023. PMID: 36908807 Free PMC article.
-
Recent advances in ferroptosis and therapeutic strategies for glioblastoma.Front Mol Biosci. 2023 Jan 13;9:1068437. doi: 10.3389/fmolb.2022.1068437. eCollection 2022. Front Mol Biosci. 2023. PMID: 36710875 Free PMC article. Review.
References
LinkOut - more resources
Full Text Sources