

Circulating TGF-β Pathway in Osteogenesis Imperfecta Pediatric Patients Subjected to MSCs-Based Cell Therapy
- PMID: 35223854
- PMCID: PMC8865676
- DOI: 10.3389/fcell.2022.830928
Circulating TGF-β Pathway in Osteogenesis Imperfecta Pediatric Patients Subjected to MSCs-Based Cell Therapy
Abstract
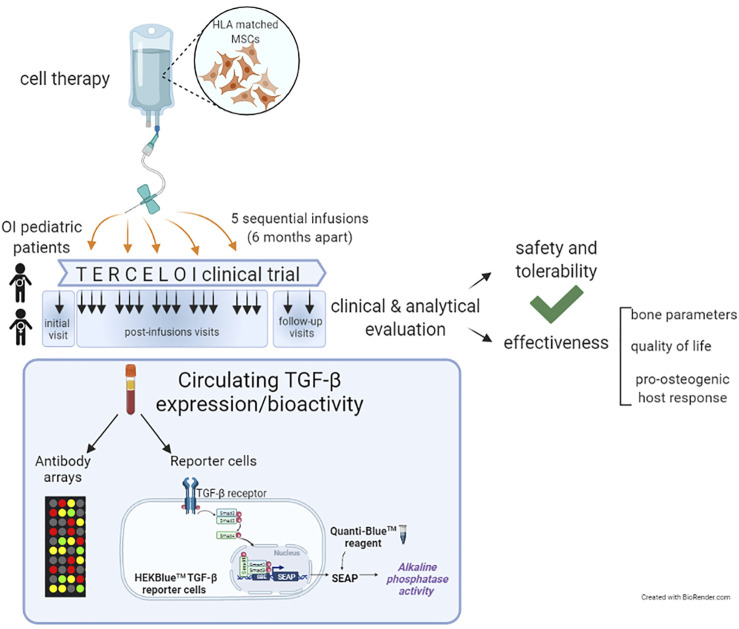
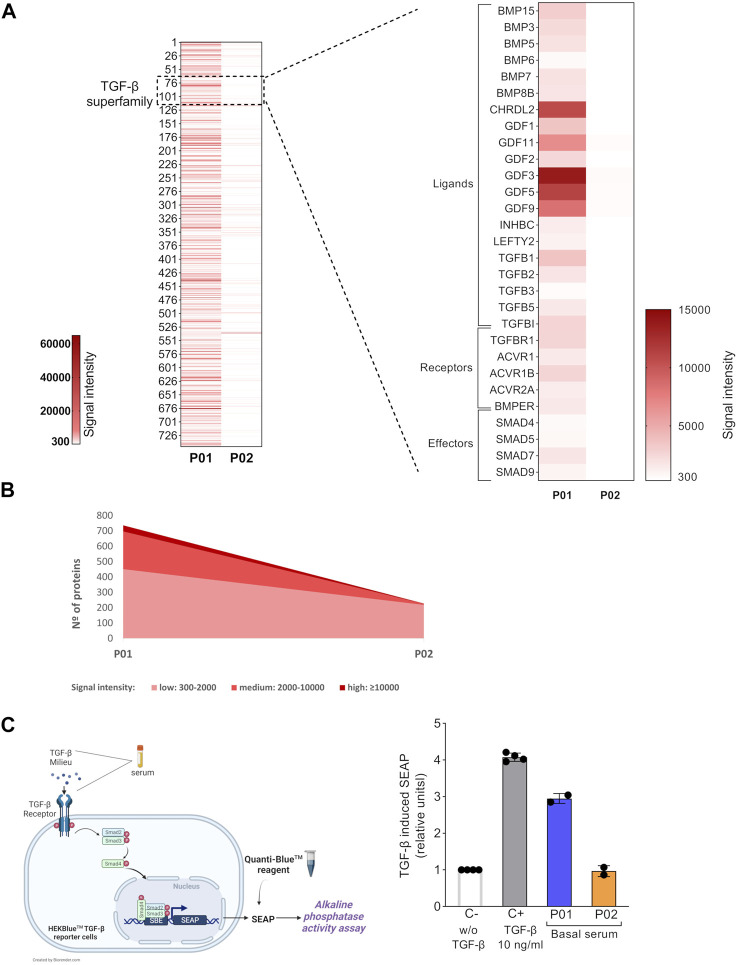
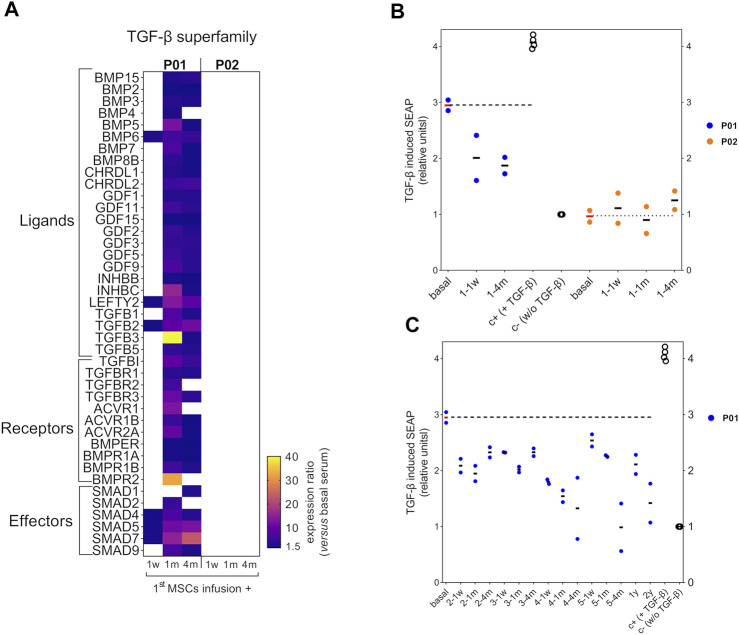
Osteogenesis Imperfecta (OI) is a rare genetic disease characterized by bone fragility, with a wide range in the severity of clinical manifestations. The majority of cases are due to mutations in COL1A1 or COL1A2, which encode type I collagen. There is no cure for OI, and real concerns exist for current therapeutic approaches, mainly antiresorptive drugs, regarding their effectiveness and security. Safer and effective therapeutic approaches are demanded. Cell therapy with mesenchymal stem cells (MSCs), osteoprogenitors capable of secreting type I collagen, has been tested to treat pediatric OI with encouraging outcomes. Another therapeutic approach currently under clinical development focuses on the inhibition of TGF-β pathway, based on the excessive TGF-β signaling found in the skeleton of severe OI mice models, and the fact that TGF-β neutralizing antibody treatment rescued bone phenotypes in those OI murine models. An increased serum expression of TGF-β superfamily members has been described for a number of bone pathologies, but still it has not been addressed in OI patients. To delve into this unexplored question, in the present study we investigated serum TGF-β signalling pathway in two OI pediatric patients who participated in TERCELOI, a phase I clinical trial based on reiterative infusions of MSCs. We examined not only the expression and bioactivity of circulating TGF-β pathway in TERCELOI patients, but also the effects that MSCs therapy could elicit. Strikingly, basal serum from the most severe patient showed an enhanced expression of several TGF-β superfamily members and increased TGF-β bioactivity, which were modulated after MSCs therapy.
Keywords: TGF-β; cell therapy; mesenchymal stem cells; osteogenesis imperfecta; stem cells.
Copyright © 2022 Infante, Cabodevilla, Gener and Rodríguez.
Conflict of interest statement
The authors declare that the research was conducted in the absence of any commercial or financial relationships that could be construed as a potential conflict of interest.
Figures
Similar articles
-
Reiterative infusions of MSCs improve pediatric osteogenesis imperfecta eliciting a pro-osteogenic paracrine response: TERCELOI clinical trial.Clin Transl Med. 2021 Jan;11(1):e265. doi: 10.1002/ctm2.265. Clin Transl Med. 2021. PMID: 33463067 Free PMC article. Clinical Trial.
-
Galunisertib downregulates mutant type I collagen expression and promotes MSCs osteogenesis in pediatric osteogenesis imperfecta.Biomed Pharmacother. 2024 Jun;175:116725. doi: 10.1016/j.biopha.2024.116725. Epub 2024 May 13. Biomed Pharmacother. 2024. PMID: 38744219
-
Inhibition of TGF-β Increases Bone Volume and Strength in a Mouse Model of Osteogenesis Imperfecta.JBMR Plus. 2021 Aug 3;5(9):e10530. doi: 10.1002/jbm4.10530. eCollection 2021 Sep. JBMR Plus. 2021. PMID: 34532615 Free PMC article.
-
Osteogenesis Imperfecta: New Perspectives From Clinical and Translational Research.JBMR Plus. 2019 Feb 20;3(8):e10174. doi: 10.1002/jbm4.10174. eCollection 2019 Aug. JBMR Plus. 2019. PMID: 31485550 Free PMC article. Review.
-
Osteogenesis imperfecta: an update on clinical features and therapies.Eur J Endocrinol. 2020 Oct;183(4):R95-R106. doi: 10.1530/EJE-20-0299. Eur J Endocrinol. 2020. PMID: 32621590 Free PMC article. Review.
Cited by
-
Targeted Proteomic Profiling Revealed Roles of Small GTPases during Osteogenic Differentiation.Anal Chem. 2023 May 2;95(17):6879-6887. doi: 10.1021/acs.analchem.2c05781. Epub 2023 Apr 21. Anal Chem. 2023. PMID: 37083350 Free PMC article.
-
Evaluation of safety and efficacy of multiple intravenous and intraosseous doses of foetal liver-derived mesenchymal stem cells in children with severe osteogenesis imperfecta : the BOOST2B clinical trial protocol.Bone Jt Open. 2025 Mar 24;6(3):361-372. doi: 10.1302/2633-1462.63.BJO-2024-0115.R1. Bone Jt Open. 2025. PMID: 40122106 Free PMC article.
-
Murine Animal Models in Osteogenesis Imperfecta: The Quest for Improving the Quality of Life.Int J Mol Sci. 2022 Dec 22;24(1):184. doi: 10.3390/ijms24010184. Int J Mol Sci. 2022. PMID: 36613624 Free PMC article. Review.
-
Revolutionizing bone defect healing: the power of mesenchymal stem cells as seeds.Front Bioeng Biotechnol. 2024 Oct 21;12:1421674. doi: 10.3389/fbioe.2024.1421674. eCollection 2024. Front Bioeng Biotechnol. 2024. PMID: 39497791 Free PMC article. Review.
-
Exploration of the skeletal phenotype of the Col1a1 +/Mov13 mouse model for haploinsufficient osteogenesis imperfecta type 1.Front Endocrinol (Lausanne). 2023 Mar 8;14:1145125. doi: 10.3389/fendo.2023.1145125. eCollection 2023. Front Endocrinol (Lausanne). 2023. PMID: 36967771 Free PMC article.
References
LinkOut - more resources
Full Text Sources
Medical
Miscellaneous