

Multi-Omics Characterization of Tumor Microenvironment Heterogeneity and Immunotherapy Resistance Through Cell States-Based Subtyping in Bladder Cancer
- PMID: 35223867
- PMCID: PMC8864284
- DOI: 10.3389/fcell.2021.809588
Multi-Omics Characterization of Tumor Microenvironment Heterogeneity and Immunotherapy Resistance Through Cell States-Based Subtyping in Bladder Cancer
Abstract
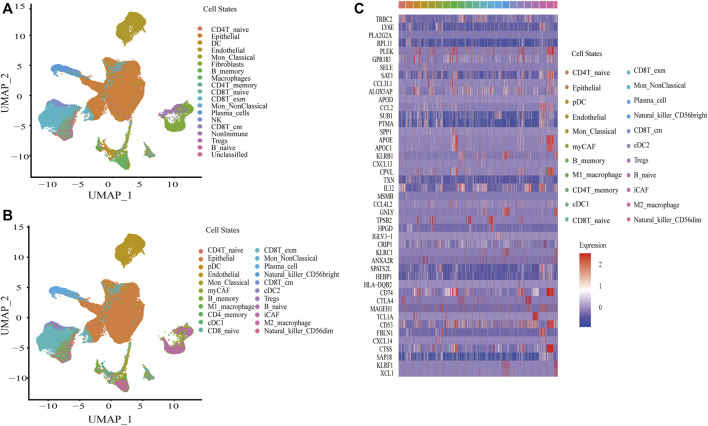
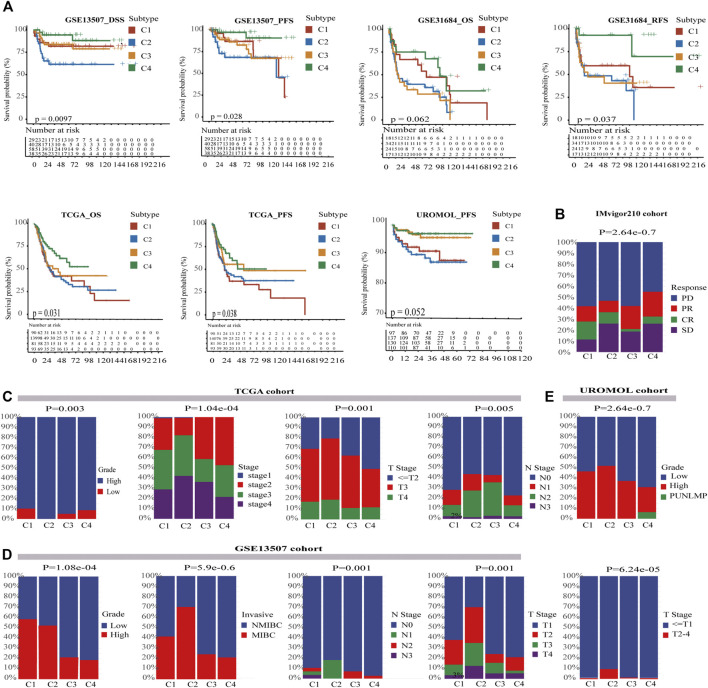
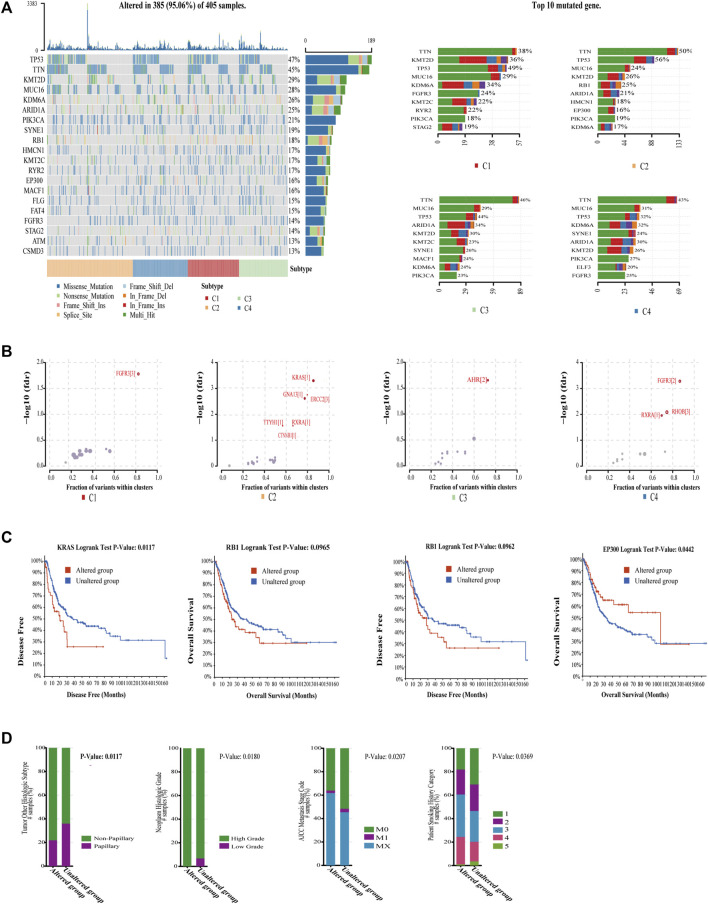
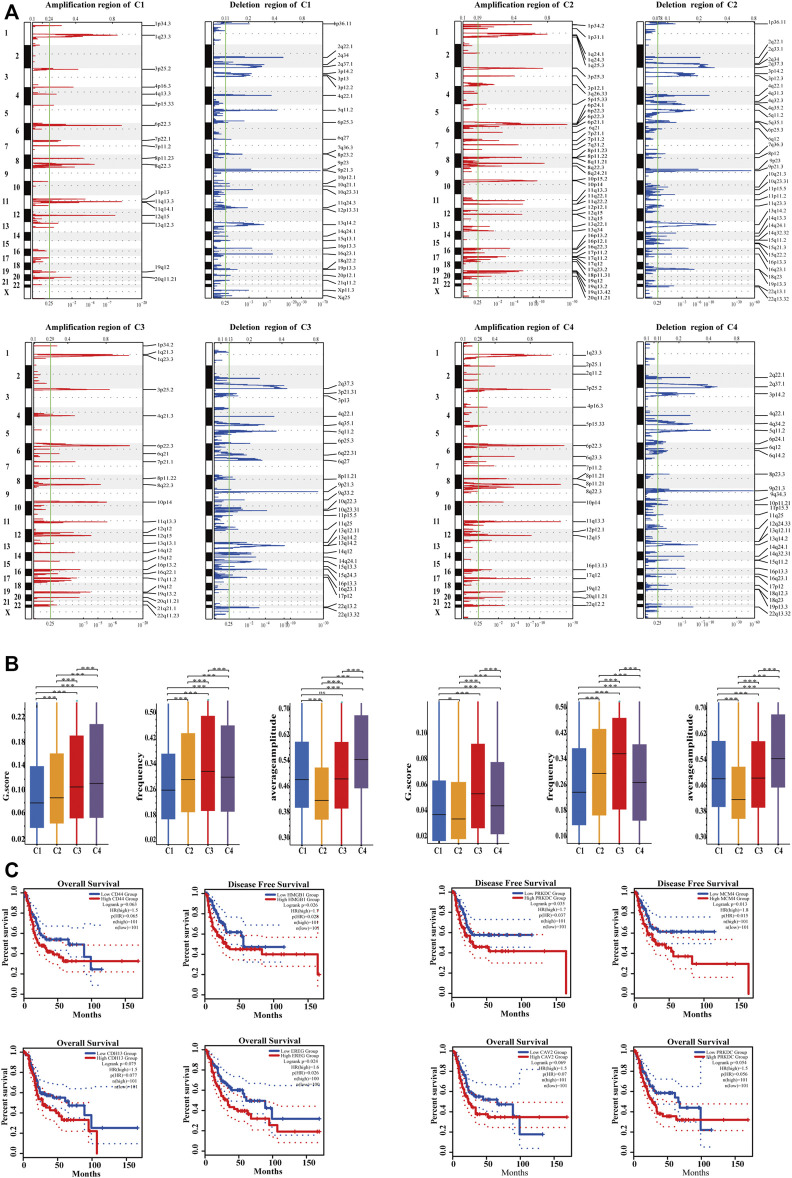
Due to the strong heterogeneity of bladder cancer (BC), there is often substantial variation in the prognosis and efficiency of immunotherapy among BC patients. For the precision treatment and assessment of prognosis, the subtyping of BC plays a critical role. Despite various subtyping methods proposed previously, most of them are based on a limited number of molecules, and none of them is developed on the basis of cell states. In this study, we construct a single-cell atlas by integrating single cell RNA-seq, RNA microarray, and bulk RNA-seq data to identify the absolute proportion of 22 different cell states in BC, including immune and nonimmune cell states derived from tumor tissues. To explore the heterogeneity of BC, BC was identified into four different subtypes in multiple cohorts using an improved consensus clustering algorithm based on cell states. Among the four subtypes, C1 had median prognosis and best overall response rate (ORR), which characterized an immunosuppressive tumor microenvironment. C2 was enriched in epithelial-mesenchymal transition/invasion, angiogenesis, immunosuppression, and immune exhaustion. Surely, C2 performed the worst in prognosis and ORR. C3 with worse ORR than C2 was enriched in angiogenesis and almost nonimmune exhaustion. Displaying an immune effective environment, C4 performed the best in prognosis and ORR. We found that patients with just an immunosuppressive environment are suitable for immunotherapy, but patients with an immunosuppressive environment accompanied by immune exhaustion or angiogenesis may resist immunotherapy. Furthermore, we conducted exploration into the heterogeneity of the transcriptome, mutational profiles, and somatic copy-number alterations in four subtypes, which could explain the significant differences related to cell states in prognosis and ORR. We also found that PD-1 in immune and tumor cells could both influence ORR in BC. The level of TGFβ in a cell state can be opposite to the overall level in the tissues, and the level in a specific cell state could predict ORR more accurately. Thus, our work furthers the understanding of heterogeneity and immunotherapy resistance in BC, which is expected to assist clinical practice and serve as a supplement to the current subtyping method from a novel perspective of cell states.
Keywords: bladder cancer; cell states; heterogeneity; immunotherapy resistance; multi-omics; prognosis; subtype; tumor microenvironment.
Copyright © 2022 Hu, Tao, Yu, Ding, Zhu, Peng, Zheng, Yang and Wu.
Conflict of interest statement
The authors declare that the research was conducted in the absence of any commercial or financial relationships that could be construed as a potential conflict of interest.
Figures


Similar articles
-
Tumor immune dysfunction and exclusion subtypes in bladder cancer and pan-cancer: a novel molecular subtyping strategy and immunotherapeutic prediction model.J Transl Med. 2024 Apr 17;22(1):365. doi: 10.1186/s12967-024-05186-8. J Transl Med. 2024. PMID: 38632658 Free PMC article.
-
An integrated bioinformatic analysis of bulk and single-cell sequencing clarifies immune microenvironment and metabolic profiles of lung adenocarcinoma to predict immunotherapy efficacy.Front Cell Dev Biol. 2023 Apr 5;11:1163314. doi: 10.3389/fcell.2023.1163314. eCollection 2023. Front Cell Dev Biol. 2023. PMID: 37091977 Free PMC article.
-
Immune subtyping for pancreatic cancer with implication in clinical outcomes and improving immunotherapy.Cancer Cell Int. 2021 Feb 26;21(1):137. doi: 10.1186/s12935-021-01824-z. Cancer Cell Int. 2021. PMID: 33637086 Free PMC article.
-
Multi-Omic Approaches to Breast Cancer Metabolic Phenotyping: Applications in Diagnosis, Prognosis, and the Development of Novel Treatments.Cancers (Basel). 2021 Sep 10;13(18):4544. doi: 10.3390/cancers13184544. Cancers (Basel). 2021. PMID: 34572770 Free PMC article. Review.
-
Single-cell RNA sequencing in breast cancer: Understanding tumor heterogeneity and paving roads to individualized therapy.Cancer Commun (Lond). 2020 Aug;40(8):329-344. doi: 10.1002/cac2.12078. Epub 2020 Jul 12. Cancer Commun (Lond). 2020. PMID: 32654419 Free PMC article. Review.
Cited by
-
Clinical implications of single cell sequencing for bladder cancer.Oncol Res. 2024 Mar 20;32(4):597-605. doi: 10.32604/or.2024.045442. eCollection 2024. Oncol Res. 2024. PMID: 38560564 Free PMC article. Review.
-
Natural sesquiterpene lactones in prostate cancer therapy: mechanisms and sources.Med Oncol. 2025 May 15;42(6):212. doi: 10.1007/s12032-025-02740-2. Med Oncol. 2025. PMID: 40372575 Review.
-
Protein-Based Predictive Biomarkers to Personalize Neoadjuvant Therapy for Bladder Cancer-A Systematic Review of the Current Status.Int J Mol Sci. 2024 Sep 13;25(18):9899. doi: 10.3390/ijms25189899. Int J Mol Sci. 2024. PMID: 39337385 Free PMC article.
References
-
- Aine M., Sjödahl G., Eriksson P., Veerla S., Lindgren D., Ringnér M., et al. (2015). Integrative Epigenomic Analysis of Differential DNA Methylation in Urothelial carcinomaIntegrative Epigenomic Analysis of Differential DNA Methylation in Urothelial Carcinoma. Genome Med. 7, 23. 10.1186/s13073-015-0144-4 - DOI - PMC - PubMed
LinkOut - more resources
Full Text Sources
Miscellaneous