. 2022 Feb 10:9:697443.
doi: 10.3389/fmed.2022.697443. eCollection 2022.

Glucocorticoids Inhibit EGFR Signaling Activation in Podocytes in Anti-GBM Crescentic Glomerulonephritis

Affiliations

Glucocorticoids Inhibit EGFR Signaling Activation in Podocytes in Anti-GBM Crescentic Glomerulonephritis

Xiaomei Wu et al. Front Med (Lausanne). .

Abstract

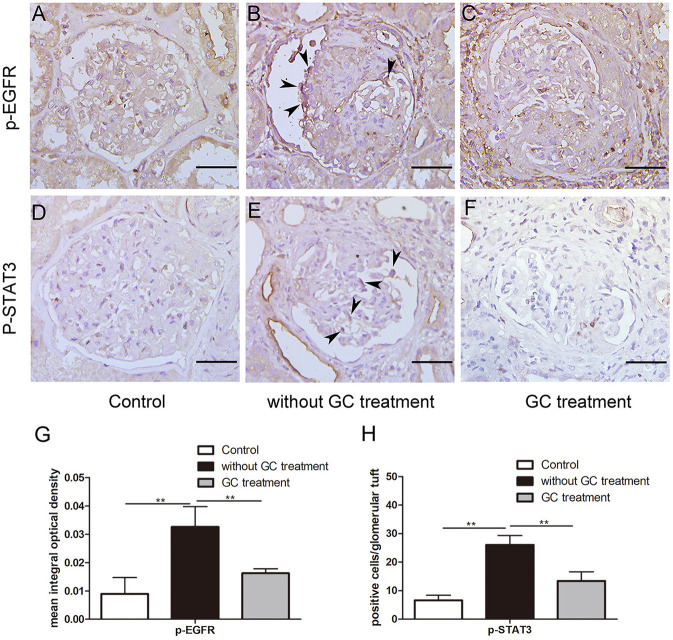
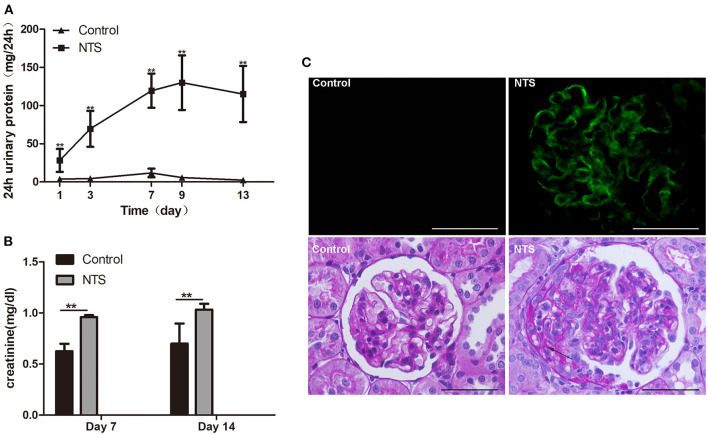
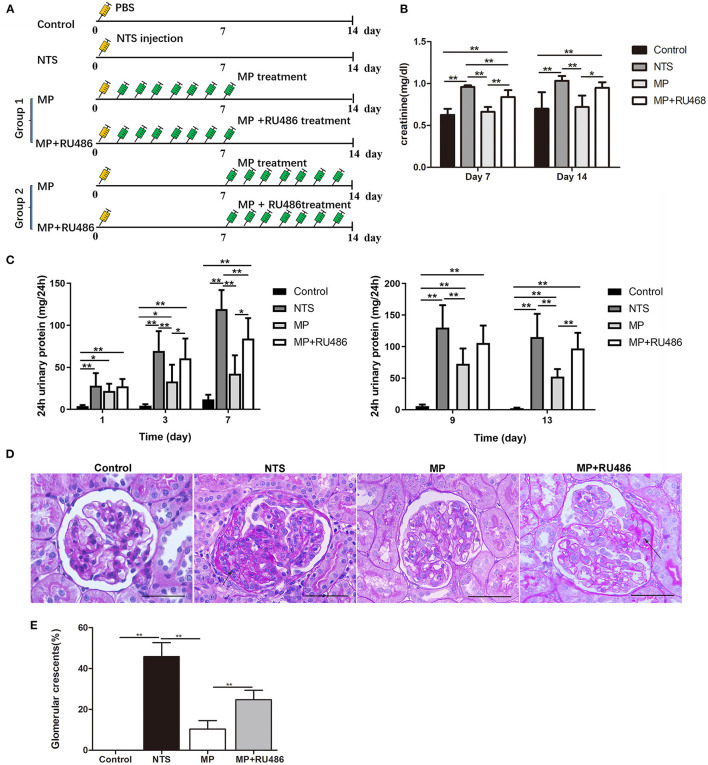
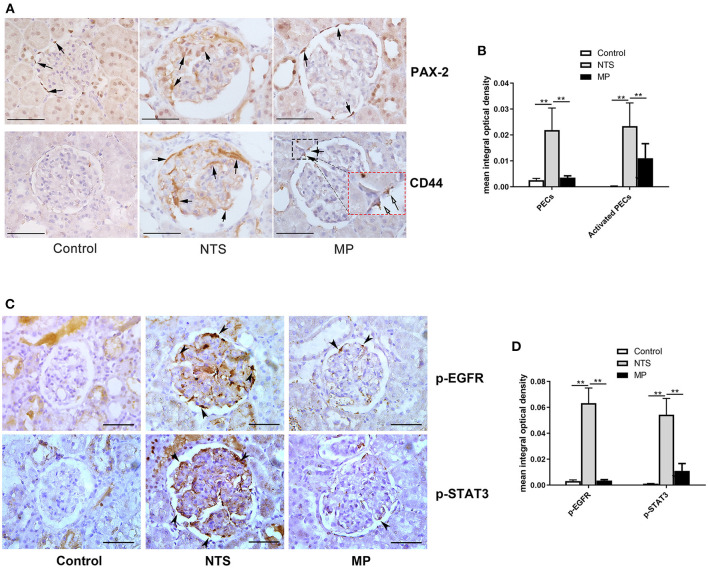
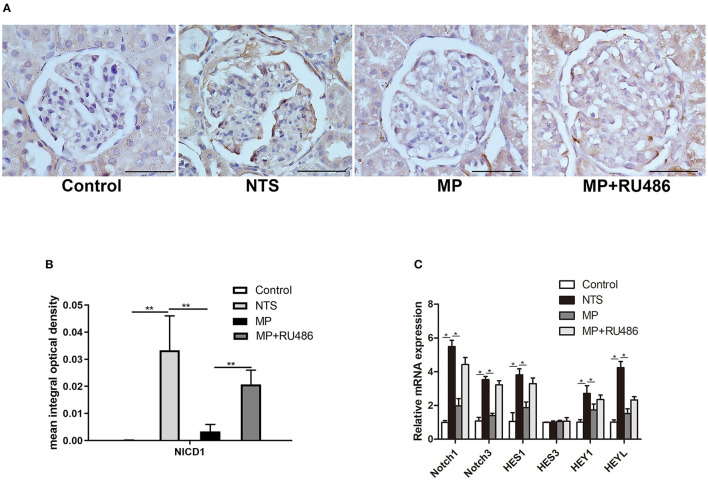
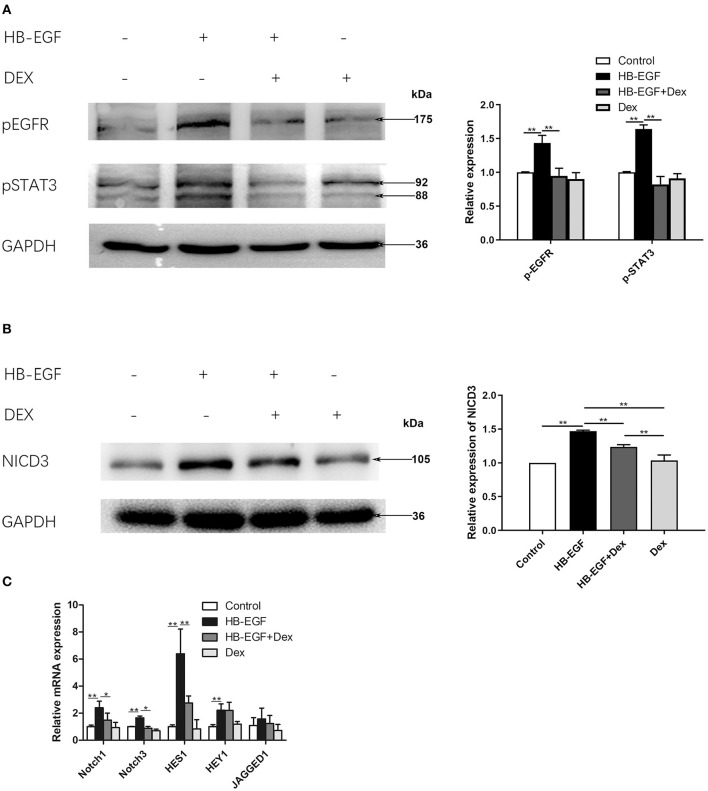
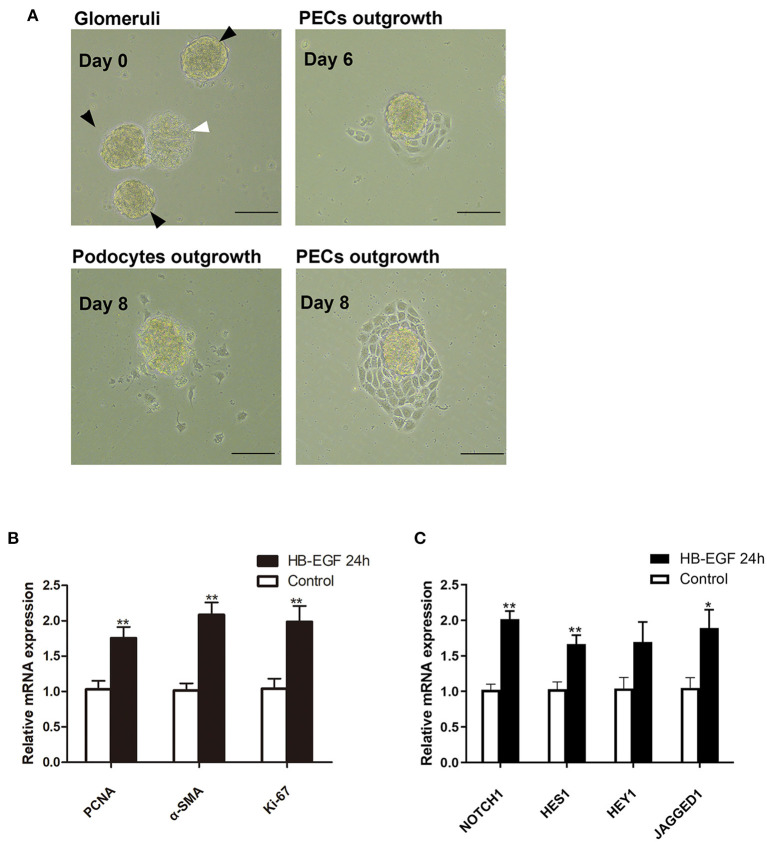
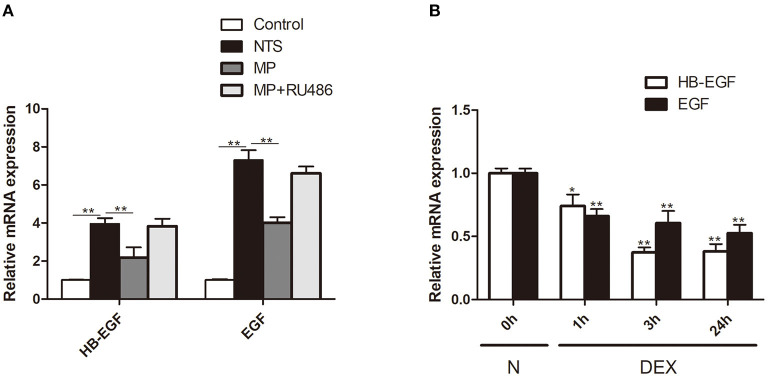
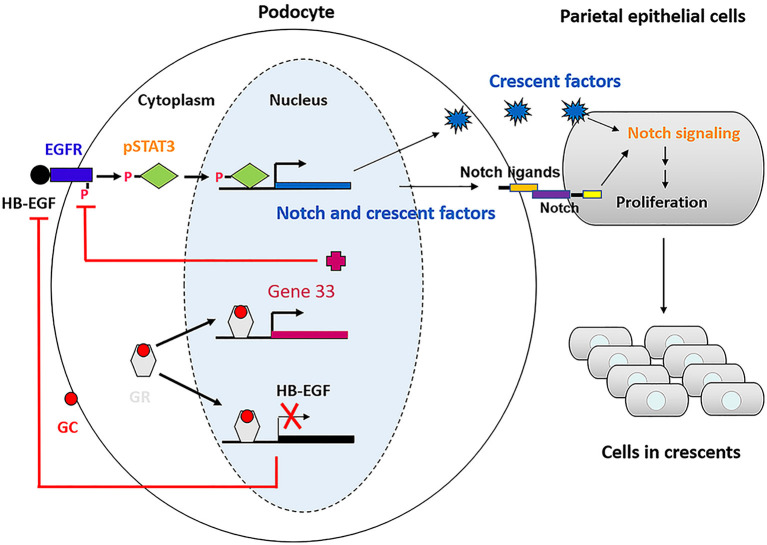
Glucocorticoids are commonly used to treat anti-GBM crescentic glomerulonephritis, however, the mechanism underlying its therapeutic effectiveness is not completely understood. Since podocyte EGFR/STAT3 signaling is known to mediate the development of anti-GBM glomerulonephritis, we investigated the effect of glucocorticoids on EGFR/STAT3 signaling in podocytes. We found that the levels of phosphorylated (activated) EGFR and STAT3 in podocytes were markedly elevated in anti-GBM patients without glucocorticoids treatment, but were normalized in patients with glucocorticoids treatment. In a rat model of anti-GBM glomerulonephritis, glucocorticoids treatment significantly attenuated the proteinuria, crescent formation, parietal epithelial cell (PEC) activation and proliferation, accompanied by elimination of podocyte EGFR/STAT3 signaling activation. In cultured podocytes, glucocorticoids were found to inhibit HB-EGF-induced EGFR and STAT3 activation. The conditioned medium from podocytes treated with HB-EGF in the absence but not presence of glucocorticoids was capable of activating Notch signaling (which is known to be involved in PEC proliferation and crescent formation) and enhancing proliferative activity in primary PECs, suggesting that glucocorticoids prevent podocytes from producing secreted factors that cause PEC proliferation and crescent formation. Furthermore, we found that glucocorticoids can downregulate the expression of EGFR ligands, EGF and HB-EGF, while upregulate the expression of EGFR inhibitor, Gene 33, explaining how glucocorticoids suppress EGFR signaling. Taken together, glucocorticoids exert therapeutic effect on anti-GBM crescentic glomerulonephritis through inhibiting podocyte EGFR/STAT3 signaling and the downstream pathway that leads to PEC proliferation and crescent formation.

Keywords: EGFR/STAT3 signaling; Notch signaling; anti-GBM glomerulonephritis; glucocorticoids; parietal epithelial cell; podocyte.


Conflict of interest statement

The authors declare that the research was conducted in the absence of any commercial or financial relationships that could be construed as a potential conflict of interest.

Figures

Figure 1
Figure 1
Glucocorticoids inhibited aberrant activation of EGFR-STAT3 signaling in podocytes of patients with anti-GBM nephritis. (A–F) Representative immunohistochemistry staining for p-EGFR and p-STAT3 in sections of kidney biopsies from patients with anti-GBM nephritis. Twenty-two patients who received glucocorticoid (GC) treatment before renal biopsy (C,F) and 12 patients without GC treatment before renal biopsy (B,E) were analyzed. Para-carcinoma kidney tissues (A,D) were used as control. (G,H) Quantification of intensity of IHC staining in glomeruli tuft for a-f. **P < 0.01 vs. the group without GC treatment. Scale bars, 50 μm.
Figure 2
Figure 2
Clinicopathologically characteristics of rat model of anti-GBM nephritis. (A) 24-h urinary protein levels in rats after NTS injection and control (n = 5 per group). (B) Serum creatinine concentration of NTS and control rats at day 7 and day 14 (n = 5 per group). (C) Immunofluorescence staining of goat anti-rabbit IgG in kidney of NTS rats, showing strong linear deposition of IgG along GBM; and Periodic acid–Schiff staining of kidney sections at day 14, showing crescent formation (arrows) in glomeruli of NTS rats. **P < 0.01; Scale bars, 50 μm.
Figure 3
Figure 3
Glucocorticoid treatment attenuated the progression of rat anti-GBM glomerulonephritis. (A) Schematic of experimental design. (B) serum creatinine concentration of rats on day 7 and 14 after NTS injection (n = 5 per group). (C) 24-h urinary protein levels of rats on day 1, 3, 7, 9, and 13 after NTS injection (n = 5 per group). (D) Periodic acid–Schiff staining of kidney from rats 14 days after NTS injection showing crescent formation (arrows) in glomeruli. (E) The percentage of cellular crescents in rats.**P < 0.01, *P < 0.05 vs. controls. Scale bars, 50 μm.
Figure 4
Figure 4
Glucocorticoid treatment suppressed proliferation of PECs and activation of EGF signaling in podocytes of NTS rats. (A) Immunohistochemistry staining for PAX-2 (PECs) and CD44 (activated PECs) in sections of kidney biopsies from rats treated with NTS alone, NTS+MP, and NTS+MP+RU486, respectively (n = 5 per group). Quantification of staining intensity in glomeruli is shown in (B); (C) Immunohistochemistry staining for p-EGFR (Tyr1068) and p-STAT3 (Tyr705) in sections of kidney biopsies from the corresponding rats in (A). Quantification of the staining intensity for p-EGFR and p-STAT3 in glomerular tuft is shown in (D). Arrows denote positive staining in the glomeruli; **P < 0.01. Scale bars, 50 μm.
Figure 5
Figure 5
Glucocorticoids prevented Notch signaling activation in podocytes of NTS-treated rats. (A) Immunohistochemistry staining of NICD1 in sections of kidney biopsies from rats treated with saline (control), NTS, NTS+MP, and NTS+MP+RU486, respectively (n = 5 per group). Quantification of immunostaining intensity for NICD1 in glomerular tuft is shown in (B); (C) The relative mRNA expression of Notch pathway genes (Notch1, Notch3, Hes1, Hes3, Hey1, and HeyL) from isolated glomeruli of the rats treated as indicated on day 14 (n = 5 per group). *P < 0.05, **P < 0.01. Scale bars, 50 μm.
Figure 6
Figure 6
Glucocorticoid treatment suppressed activation of EGFR, STAT3 and Notch3 in HB-EGF-treated podocytes in culture. (A) Immunoblotting showing that treatment of Dex prevented phosphorylation of EGFR (Tyr1068) and STAT3 (Tyr705) in HB-EGF treated podocyte (target bands are indicated by arrows) according to the samples treated for 3 h. Quantifications of the blots are shown on the right. (B,C) Immunoblotting (B) and qPCR (C) showing Notch signaling was induced by HB-EGF, which was prevented by Dex. Quantification of the blots is shown on the right (B). The data are expressed as the mean ± SD of three independent experiments (C). *P < 0.05, **P < 0.01 vs. mRNA levels on 0 h at baseline.
Figure 7
Figure 7
Conditioned medium from HB-EGF-treated podocytes activated Notch signaling and enhanced proliferative activity in primary PECs. (A) Capsulated (black arrows) and decapsulated (white arrow) glomeruli were isolated from rat kidney. Primary PECs (irregularly shaped, uniform in size, and grown in clusters) outgrowing from capsulated glomeruli at day 7 were seen. (B) qRT-PCR analysis showing that the relative PCNA, α-SMA, Ki-67 mRNA expressions were significantly upregulated in the primary PECs after 24-h stimulation with conditioned medium from HB-EGF-treated podocytes (C) qRT-PCR analysis of Notch and downstream genes revealed a marked increase of mRNA in the same PECs as in (B). All data are presented as the mean ± SD of three independent experiments. *P < 0.05, **P < 0.01 vs. primary PECs treated with control medium from untreated podocytes. Scale bars, 50 μm.
Figure 8
Figure 8
Glucocorticoid treatment inhibited expression of EGFR ligands in vivo and in vitro. (A) Quantification by qRT-PCR of HB-EGF and EGF mRNA in isolated glomeruli of rats treated with saline (control), NTS, NTS+MP, NTS+MP+RU486, respectively on day 14 (n = 5 per group). **P < 0.01; (B) qRT-PCR analysis showing the relative HB-EGF and EGF mRNA expression levels in cultured podocytes stimulated with Dex (1 μM) for 0, 1, 3, 24 h, respectively, in vitro. The data are expressed as the mean ± SD of three independent experiments. *P < 0.05, **P < 0.01 vs. mRNA levels on 0 h at baseline.
Figure 9
Figure 9
Schematic of the mechanism underlying glucocorticoids effectiveness on anti-GBM crescentic glomerulonephritis.

Similar articles

References

    1. Boucher A, Droz D, Adafer E, Noël LH. Relationship between the integrity of Bowman's capsule and the composition of cellular crescents in human crescentic glomerulonephritis. Lab Invest. (1987) 56:526–33. - PubMed
    1. Lan HY, Nikolic-Paterson DJ, Atkins RC. Involvement of activated periglomerular leukocytes in the rupture of Bowman's capsule and glomerular crescent progression in experimental glomerulonephritis. Lab Invest. (1992) 67:743–51. - PubMed
    1. Ophascharoensuk V, Pippin JW, Gordon KL, Shankland SJ, Couser WG, Johnson RJ. Role of intrinsic renal cells versus infiltrating cells in glomerular crescent formation. Kidney Int. (1998) 54:416–25. 10.1046/j.1523-1755.1998.00003.x - DOI - PubMed
    1. Smeets B, Uhlig S, Fuss A, Mooren F, Wetzels JF, Floege J, et al. . Tracing the origin of glomerular extracapillary lesions from parietal epithelial cells. J Am Soc Nephrol. (2009) 20:2604–15. 10.1681/ASN.2009010122 - DOI - PMC - PubMed
    1. Sicking EM, Fuss A, Uhlig S, Jirak P, Dijkman H, Wetzels J, et al. . Subtotal ablation of parietal epithelial cells induces crescent formation. J Am Soc Nephrol. (2012) 23:629–40. 10.1681/ASN.2011050449 - DOI - PMC - PubMed