. 2022 Feb 11:9:836067.
doi: 10.3389/fcvm.2022.836067. eCollection 2022.

Predicting Diagnostic Gene Biomarkers Associated With Immune Checkpoints, N6-Methyladenosine, and Ferroptosis in Patients With Acute Myocardial Infarction

Affiliations

Predicting Diagnostic Gene Biomarkers Associated With Immune Checkpoints, N6-Methyladenosine, and Ferroptosis in Patients With Acute Myocardial Infarction

Xiao Tong et al. Front Cardiovasc Med. .

Abstract

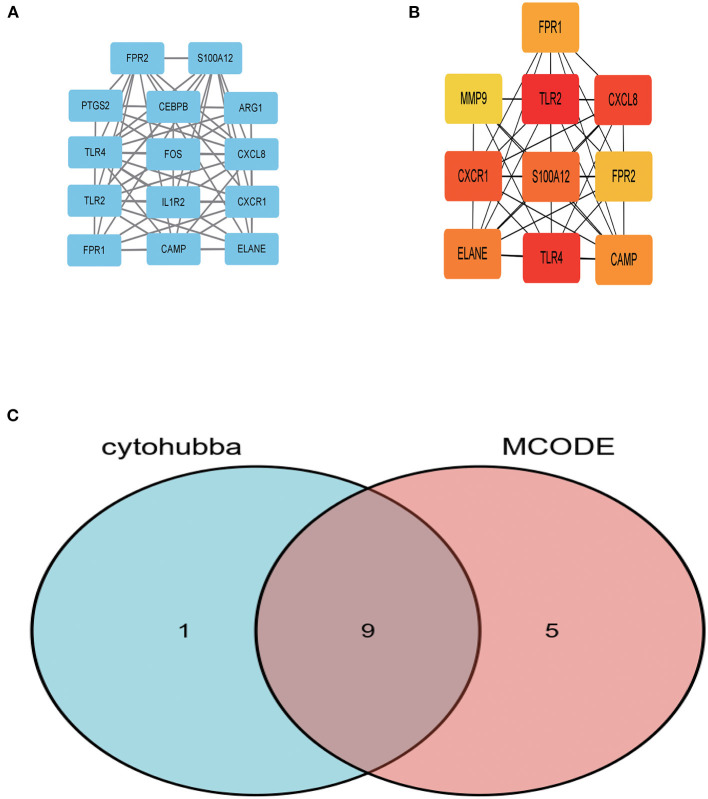
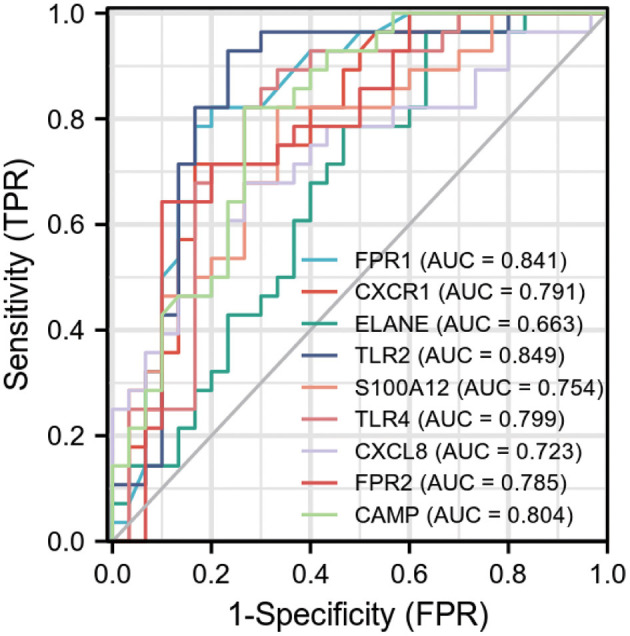
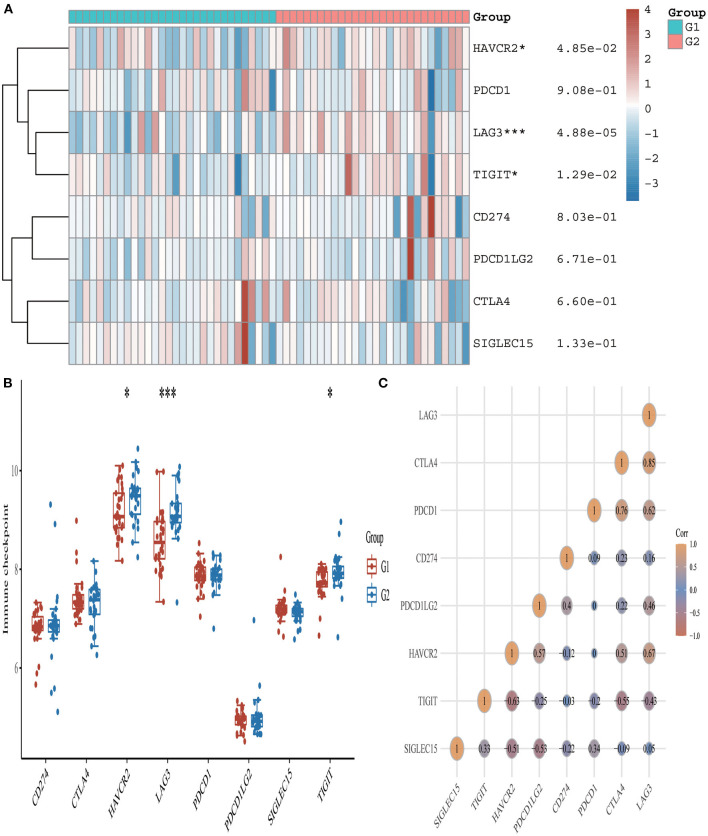
This study aimed to determine early diagnosis genes of acute myocardial infarction (AMI) and then validate their association with ferroptosis, immune checkpoints, and N6-methyladenosine (m6A), which may provide a potential method for the early diagnosis of AMI. Firstly, we downloaded microarray data from NCBI (GSE61144, GSE60993, and GSE42148) and identified differentially expressed genes (DEGs) in samples from healthy subjects and patients with AMI. Also, we performed systematic gene ontology (GO) and Kyoto Encyclopedia of Genes and Genomes (KEGG) analyses and used STRING to predict protein interactions. Moreover, MCC and MCODE algorithms in the cytoHubba plug-in were used to screen nine key genes in the network. We then determined the diagnostic significance of the nine obtained DEGs by plotting receiver operating characteristic curves using a multiscale curvature classification algorithm. Meanwhile, we investigated the relationship between AMI and immune checkpoints, ferroptosis, and m6A. In addition, we further validated the key genes through the GSE66360 dataset and consequently obtained nine specific genes that can be used as early diagnosis biomarkers for AMI. Through screening, we identified 210 DEGs, including 53 downregulated and 157 upregulated genes. According to GO, KEGG, and key gene screening results, FPR1, CXCR1, ELANE, TLR2, S100A12, TLR4, CXCL8, FPR2 and CAMP could be used for early prediction of AMI. Finally, we found that AMI was associated with ferroptosis, immune checkpoints, and m6A and FPR1, CXCR1, ELANE, TLR2, S100A12, TLR4, CXCL8, FPR2 and CAMP are effective markers for the diagnosis of AMI, which can provide new prospects for future studies on the pathogenesis of AMI.

Keywords: acute myocardial infarction; diagnostic gene biomarker; differentially expressed genes; ferroptosis; immune checkpoints; m6A.


Conflict of interest statement

The authors declare that the research was conducted in the absence of any commercial or financial relationships that could be construed as a potential conflict of interest.

Figures

Figure 1
Figure 1
Volcano plots and heat maps of differentially expressed genes in AMI. (A) Box plot after data standardization. (B) PCA results before batch removal for multiple data sets. (C) PCA results after batch removal. (D) Volcano plots were constructed using fold-change values and adjusted P. The red point in the plot represents the upregulated mRNAs and the blue point indicates the downregulated mRNAs with statistical significance. (E) Hierarchical clustering analysis of mRNAs, which were differentially expressed between patients with AMI and healthy controls.
Figure 2
Figure 2
GO and KEGG enrichment analysis. The enriched KEGG signaling pathways were selected to demonstrate the primary biological actions of major potential mRNAs. The abscissa indicates gene ratio and the enriched pathways were presented in the ordinate. Gene ontology (GO) analysis of potential mRNA targets. The biological pathways (BP), cellular component (CC), and molecular function (MF) of potential targets were clustered based on the ClusterProfiler R package (version: 3.18.0). In the enrichment result, p < 0.05 or FDR < 0.05 were considered meaningful.
Figure 3
Figure 3
The key genes were identified using MCC and MCODE. (A) Represents the 10 key genes calculated by MCC algorithm in cytoHubba; the darker the color, the more critical the gene. (B) Denotes the gene related to the module with the highest score in MCODE calculation methods using Cytoscape. (C) The intersection of the key genes calculated by MCC and MCODE is visualized using Venn diagram.
Figure 4
Figure 4
Receiver operating characteristic (ROC) curve of differentially expressed genes related to AMI, independence. TPR: true positive rate, the ratio of positive samples to all positive samples predicted by classifier, i.e., TP/(TP+FN); FPR: False negative rate, the ratio of positive classes to all negative classes in the sample predicted by the classifier, i.e., FP/(FP+TN). By changing different thresholds, a pair of TPR and FPR will be obtained. ROC curve is a curve drawn with FPR as abscissa and TPR as ordinate. As shown in the figure, each point on the curve corresponds to FPR and TPR at different thresholds. (The meaning of TPRate is the proportion of all samples of true category 1 that are predicted to be category 1. The meaning of FPRate is the proportion of all samples with true category 0 that are predicted to be category 1. AUC means that a positive sample and a negative sample are randomly selected from the sample. The probability that the classifier predicts the positive sample to be positive is P1, and the probability that the negative sample is positive is P2. AUC means the probability that P1 > P2).
Figure 5
Figure 5
Expression pattern of immune checkpoint-related mRNAs in AMI and control groups. (A) Comparison of expression levels of 8 immune checkpoint-related RNA. Immune checkpoint-related RNA between healthy controls and AMI patients. G1 represents AMI patients and G2 represents healthy controls. *p < 0.05, ***p < 0.001, the asterisk represents the degree of importance (*p). (B) Visualization of differentially expressed regulators in AMI. The AMI patients were marked cyan, and the healthy controls were marked pink. *p < 0.05, **p < 0.01, ***p < 0.001, the asterisk represents the degree of importance (*p). (C) Spearman correlation analysis of 8 immune checkpoint-related RNA in AMI. The higher the number in the circle, the stronger the correlation. The change in color on the right represents a positive or negative correlation.
Figure 6
Figure 6
Expression pattern of ferroptosis-related mRNAs in AMI and control groups. (A) Comparison of expression levels of 24 ferroptosis-related RNA. Ferroptosis-related RNA between healthy controls and AMI patients. G1 represents AMI patients and G2 represents healthy controls. *p < 0.05, **p < 0.01, ***p < 0.001, the asterisk represents the degree of importance (*p). (B) Visualization of differentially expressed regulators in AMI. The AMI patients were marked cyan, and the healthy controls were marked pink. *p < 0.05, **p < 0.01, ***p < 0.001, the asterisk represents the degree of importance (*p). (C) Spearman correlation analysis of 24 ferroptosis-related RNA in AMI. The higher the number in the circle, the stronger the correlation. The change in color on the right represents a positive or negative correlation.
Figure 7
Figure 7
Expression pattern of m6A RNA methylation regulators in AMI. (A) Comparison of expression levels of 18 m6A RNA methylation regulators between AMI patients and healthy controls. *p < 0.05, **p < 0.01, ***p < 0.001, the asterisk represents the degree of importance (*p). (B) Visualization of differentially expressed regulators in AMI. The AMI patients were marked cyan, and the healthy controls were marked pink. *p < 0.05, **p < 0.01, ***p < 0.001, the asterisk represents the degree of importance (*p). (C) Spearman correlation analysis of 18 m6A-related RNA in AMI. The higher the number in the circle, the stronger the correlation. The change in color on the right represents a positive or negative correlation.
Figure 8
Figure 8
Validation of differentially expressed genes in AMI. The figure (A–I) shows the expression of differentially expressed genes in the GSE66360 data sets in AMI and non-AMI patients. The blue square represents gene expression in the AMI group, and the red circle represents gene expression in the healthy control group.

Similar articles

Cited by

References

    1. Zhang L, Qin LQ, Cui HY, Liu AP, Wang PY. Prevalence of cardiovascular risk factors clustering among suburban residents in Beijing, China. Int J Cardiol. (2011) 151:46–9. 10.1016/j.ijcard.2010.04.056 - DOI - PubMed
    1. Mahmoudi M, Yu M, Serpooshan V, Wu JC, Langer R, Lee RT, et al. . Multiscale technologies for treatment of ischemic cardiomyopathy. Nat Nanotechnol. (2017) 12:845–55. 10.1038/nnano.2017.167 - DOI - PMC - PubMed
    1. Ramachandra CJA, Hernandez-Resendiz S, Crespo-Avilan GE, Lin YH, Hausenloy DJ. Mitochondria in acute myocardial infarction and cardioprotection. EBioMedicine. (2020) 57:102884. 10.1016/j.ebiom.2020.102884 - DOI - PMC - PubMed
    1. Heusch G, Gersh BJ. The pathophysiology of acute myocardial infarction and strategies of protection beyond reperfusion: a continual challenge. Eur Heart J. (2017) 38:774–84. 10.1093/eurheartj/ehw224 - DOI - PubMed
    1. Wang GK, Zhu JQ, Zhang JT Li Q, Li Y, He J, et al. . Circulating microRNA: a novel potential biomarker for early diagnosis of acute myocardial infarction in humans. Eur Heart J. (2010) 31:659–66. 10.1093/eurheartj/ehq013 - DOI - PubMed