

Integrated analysis on transcriptome and behaviors defines HTT repeat-dependent network modules in Huntington's disease
- PMID: 35224162
- PMCID: PMC8843892
- DOI: 10.1016/j.gendis.2021.05.004
Integrated analysis on transcriptome and behaviors defines HTT repeat-dependent network modules in Huntington's disease
Abstract
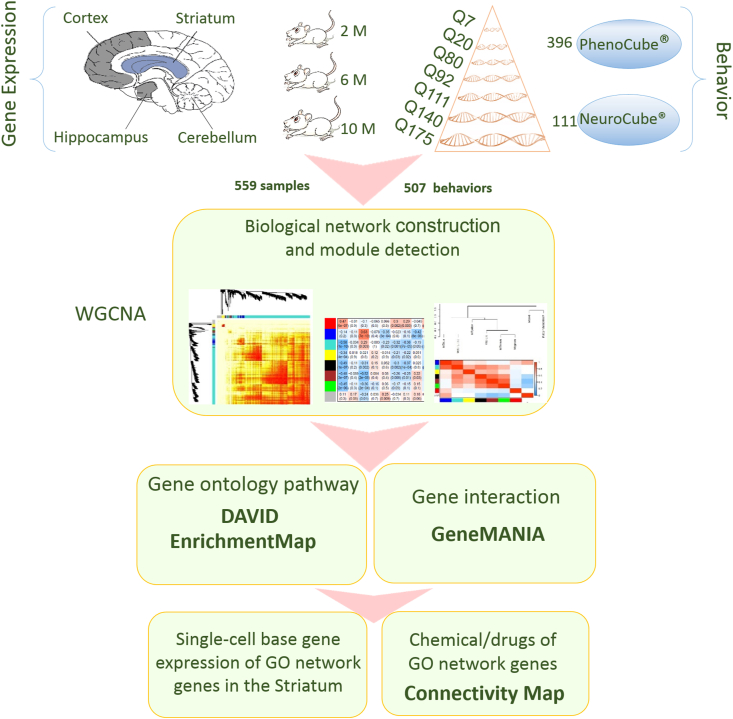
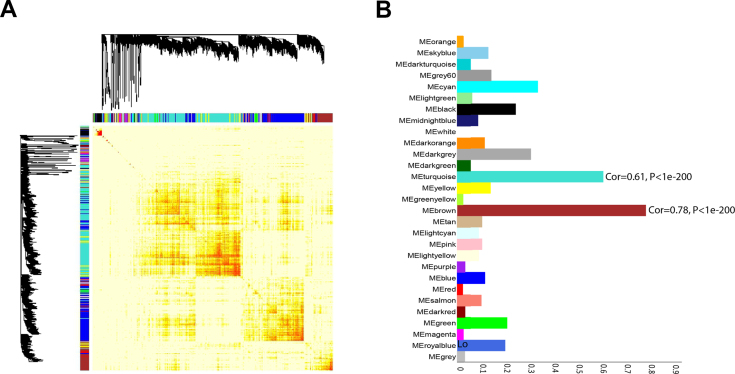
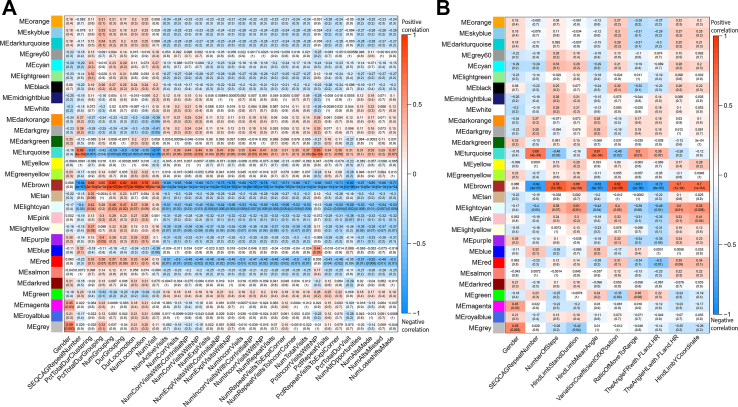
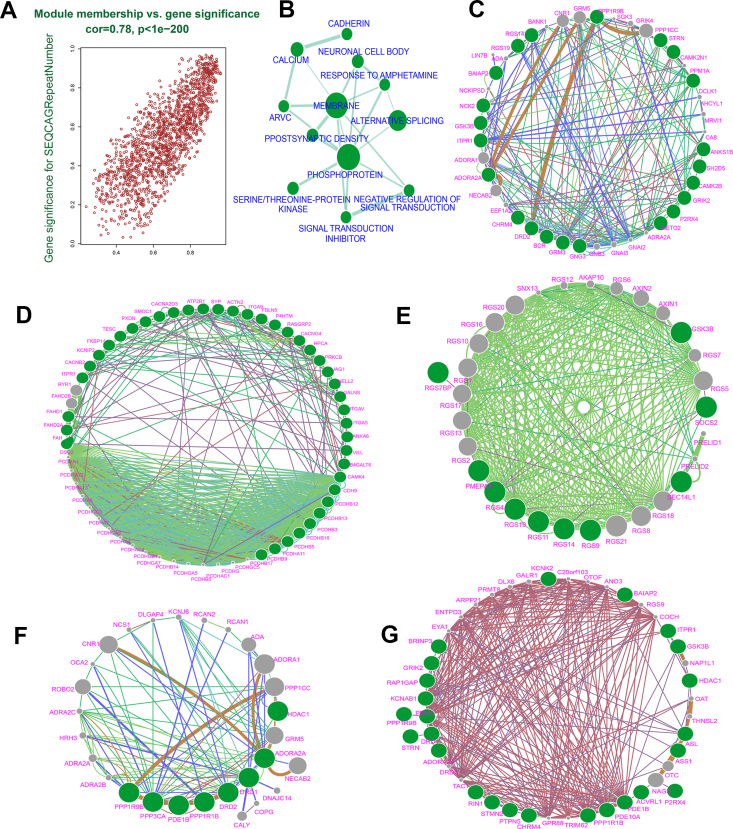
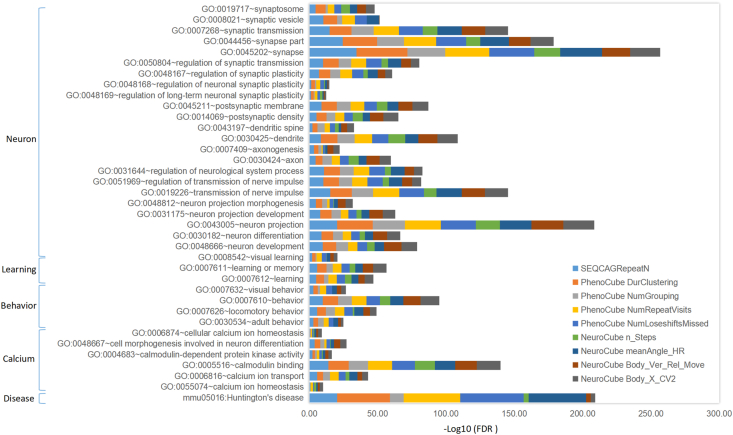
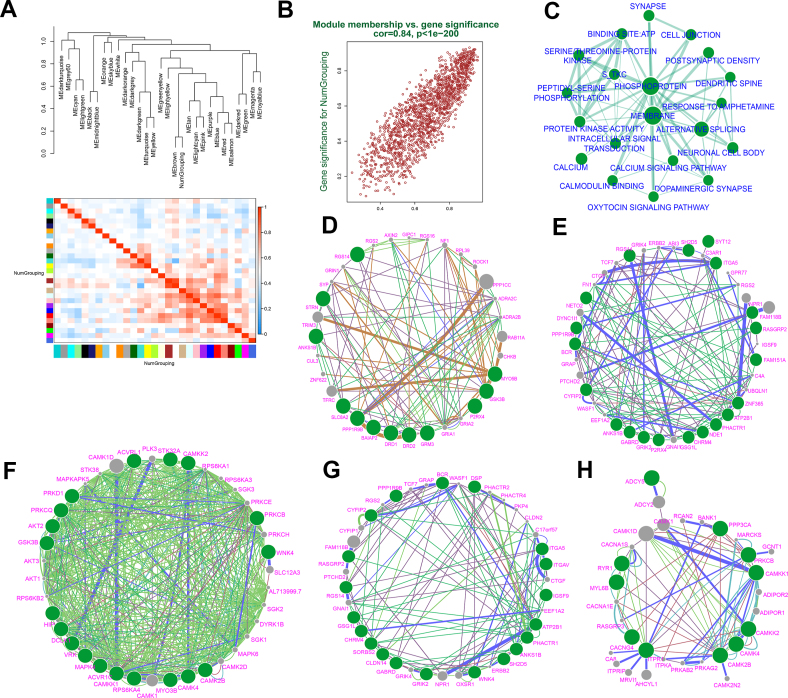
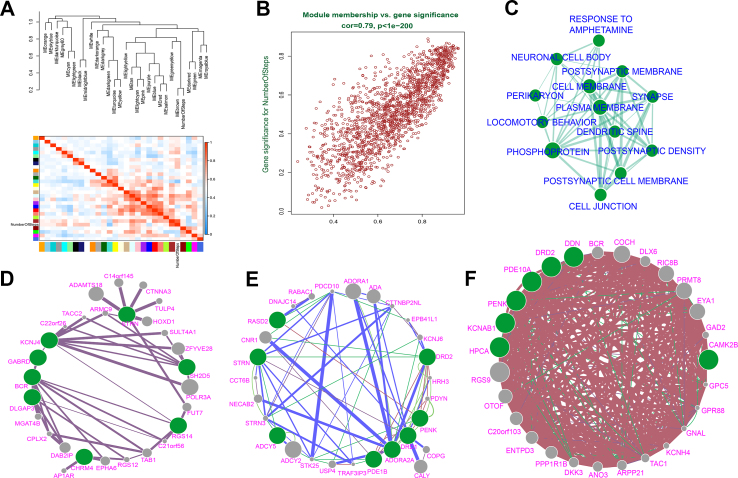
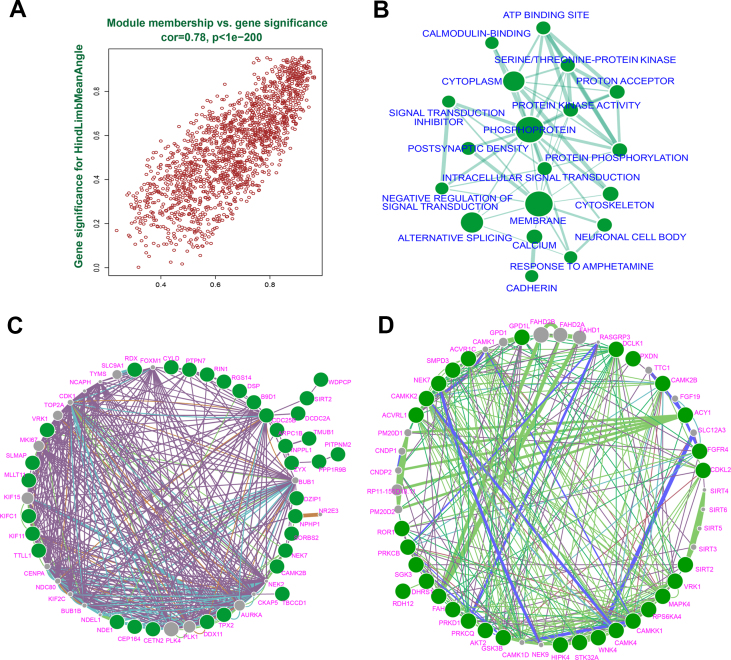
Huntington's disease (HD) is caused by a CAG repeat expansion in the huntingtin (HTT) gene. Knock-in mice carrying a CAG repeat-expanded Htt will develop HD phenotypes. Previous studies suggested dysregulated molecular networks in a CAG length genotype- and the age-dependent manner in brain tissues from knock-in mice carrying expanded Htt CAG repeats. Furthermore, a large-scale phenome analysis defined a behavioral signature for HD genotype in knock-in mice carrying expanded Htt CAG repeats. However, an integrated analysis correlating phenotype features with genotypes (CAG repeat expansions) was not conducted previously. In this study, we revealed the landscape of the behavioral features and gene expression correlations based on 445 mRNA samples and 445 microRNA samples, together with behavioral features (396 PhenoCube behaviors and 111 NeuroCube behaviors) in Htt CAG-knock-in mice. We identified 37 behavioral features that were significantly associated with CAG repeat length including the number of steps and hind limb stand duration. The behavioral features were associated with several gene coexpression groups involved in neuronal dysfunctions, which were also supported by the single-cell RNA sequencing data in the striatum and the spatial gene expression in the brain. We also identified 15 chemicals with significant responses for genes with enriched behavioral features, most of them are agonist or antagonist for dopamine receptors and serotonin receptors used for neurology/psychiatry. Our study provides further evidence that abnormal neuronal signal transduction in the striatum plays an important role in causing HD-related phenotypic behaviors and provided rich information for the further pharmacotherapeutic intervention possibility for HD.
Keywords: Behaviors; CAG repeat; Huntington's disease; Mice; Single-cell RNA sequencing; Small chemicals; Striatum; Transcriptome.
© 2021 Chongqing Medical University. Production and hosting by Elsevier B.V.
Figures

Similar articles
-
Novel BAC Mouse Model of Huntington's Disease with 225 CAG Repeats Exhibits an Early Widespread and Stable Degenerative Phenotype.J Huntingtons Dis. 2015;4(1):17-36. J Huntingtons Dis. 2015. PMID: 26333255 Free PMC article.
-
Promotion of somatic CAG repeat expansion by Fan1 knock-out in Huntington's disease knock-in mice is blocked by Mlh1 knock-out.Hum Mol Genet. 2020 Nov 4;29(18):3044-3053. doi: 10.1093/hmg/ddaa196. Hum Mol Genet. 2020. PMID: 32876667 Free PMC article.
-
Base editing strategies to convert CAG to CAA diminish the disease-causing mutation in Huntington's disease.bioRxiv [Preprint]. 2023 Apr 28:2023.04.28.538700. doi: 10.1101/2023.04.28.538700. bioRxiv. 2023. Update in: Elife. 2024 Jun 13;12:RP89782. doi: 10.7554/eLife.89782. PMID: 37162872 Free PMC article. Updated. Preprint.
-
Multiple clinical features of Huntington's disease correlate with mutant HTT gene CAG repeat lengths and neurodegeneration.J Neurol. 2019 Mar;266(3):551-564. doi: 10.1007/s00415-018-8940-6. Epub 2018 Jun 28. J Neurol. 2019. PMID: 29956026 Review.
-
Huntington's disease mouse models: unraveling the pathology caused by CAG repeat expansion.Fac Rev. 2021 Oct 21;10:77. doi: 10.12703/r/10-77. eCollection 2021. Fac Rev. 2021. PMID: 34746930 Free PMC article. Review.
Cited by
-
Ferroptosis: underlying mechanisms and involvement in neurodegenerative diseases.Apoptosis. 2024 Feb;29(1-2):3-21. doi: 10.1007/s10495-023-01902-9. Epub 2023 Oct 17. Apoptosis. 2024. PMID: 37848673 Review.
-
Deep Sc-RNA sequencing decoding the molecular dynamic architecture of the human retina.Sci China Life Sci. 2023 Mar;66(3):496-515. doi: 10.1007/s11427-021-2163-1. Epub 2022 Sep 15. Sci China Life Sci. 2023. PMID: 36115892
-
How does the age of control individuals hinder the identification of target genes for Huntington's disease?Front Genet. 2024 Jun 20;15:1377237. doi: 10.3389/fgene.2024.1377237. eCollection 2024. Front Genet. 2024. PMID: 38978875 Free PMC article.
-
Multiplexed spatial transcriptomics methods and the application of expansion microscopy.Front Cell Dev Biol. 2024 Jul 22;12:1378875. doi: 10.3389/fcell.2024.1378875. eCollection 2024. Front Cell Dev Biol. 2024. PMID: 39105173 Free PMC article. Review.
-
The molecular landscape of neurological disorders: insights from single-cell RNA sequencing in neurology and neurosurgery.Eur J Med Res. 2023 Nov 16;28(1):529. doi: 10.1186/s40001-023-01504-w. Eur J Med Res. 2023. PMID: 37974227 Free PMC article. Review.
References
-
- Bates G.P., Dorsey R., Gusella J.F., et al. Huntington disease. Nat Rev Dis Primers. 2015;1:15005. - PubMed
-
- Barker R.A., Mason S.L. Neurodegenerative disease: mapping the natural history of Huntington disease. Nat Rev Neurol. 2014;10(1):12–13. - PubMed
-
- Cattaneo E., Zuccato C., Tartari M. Normal huntingtin function: an alternative approach to Huntington's disease. Nat Rev Neurosci. 2005;6(12):919–930. - PubMed
-
- Sadri-Vakili G., Cha J.H. Mechanisms of disease: histone modifications in Huntington's disease. Nat Clin Pract Neurol. 2006;2(6):330–338. - PubMed
-
- Pouladi M.A., Morton A.J., Hayden M.R. Choosing an animal model for the study of Huntington's disease. Nat Rev Neurosci. 2013;14(10):708–721. - PubMed
LinkOut - more resources
Full Text Sources
