. 2022 Mar:23:100711.
doi: 10.1016/j.mtchem.2021.100711. Epub 2021 Dec 30.

Engineering hairy cellulose nanocrystals for chemotherapy drug capture

Affiliations

Engineering hairy cellulose nanocrystals for chemotherapy drug capture

Sarah A E Young et al. Mater Today Chem. 2022 Mar.

Abstract

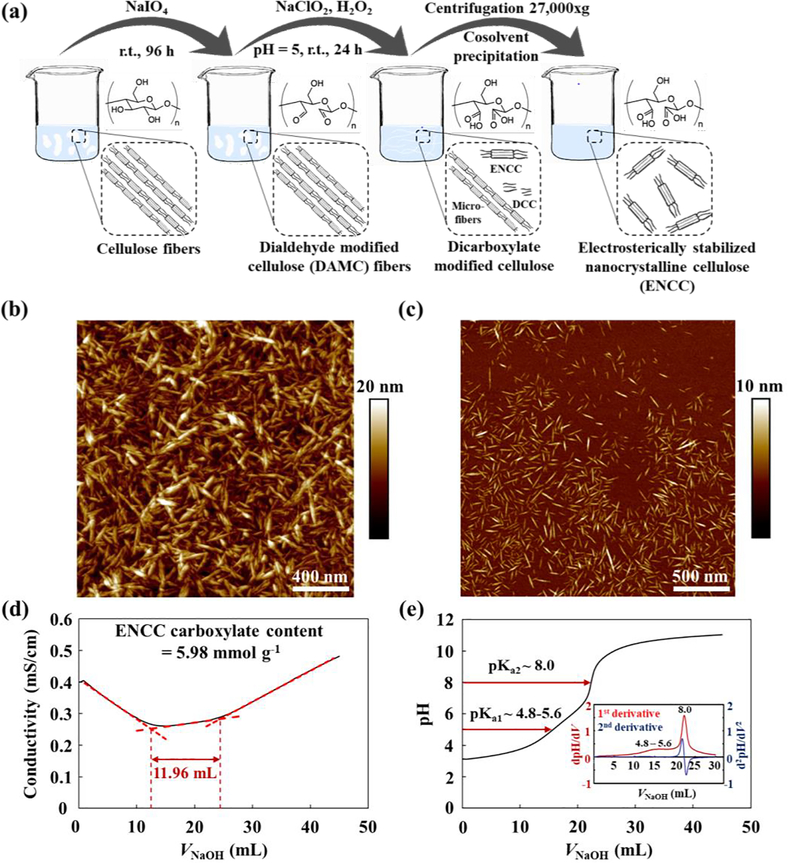
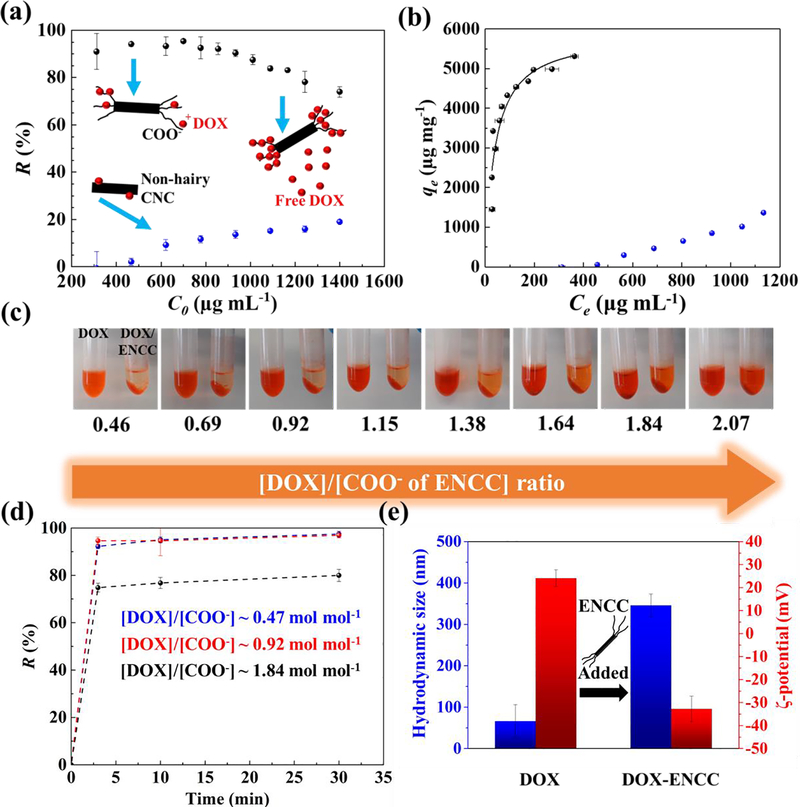
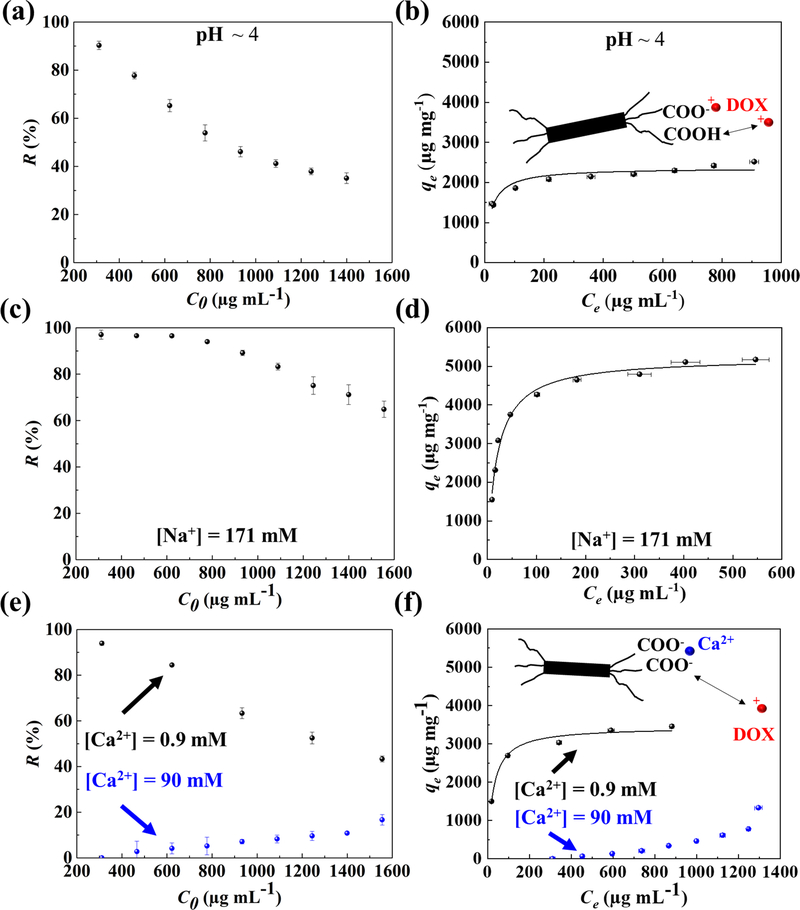
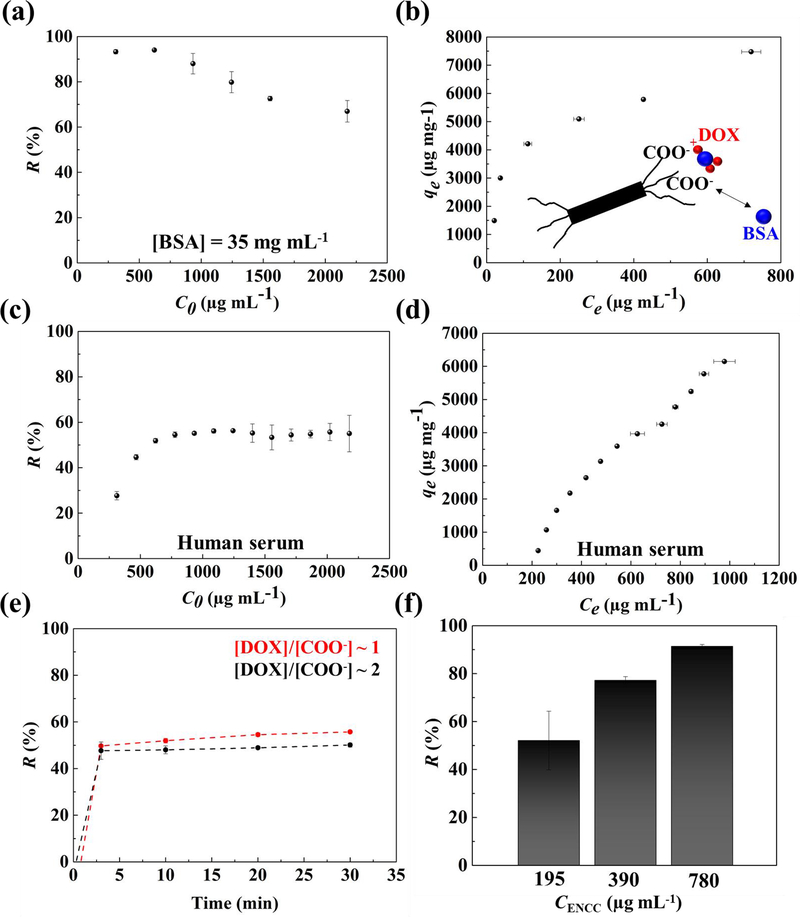
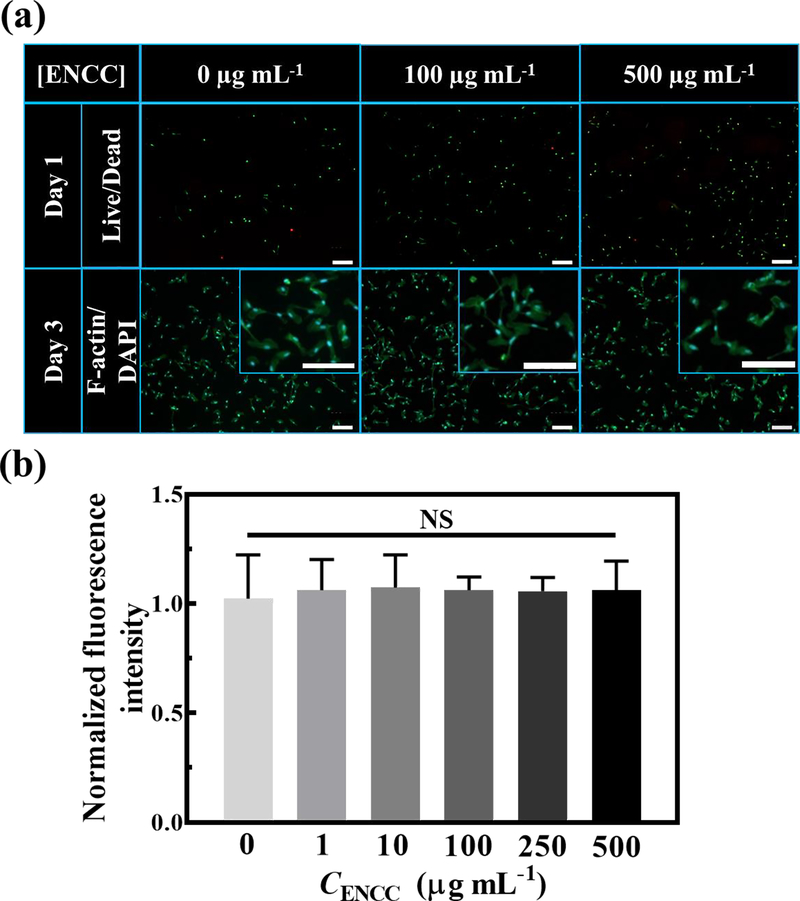
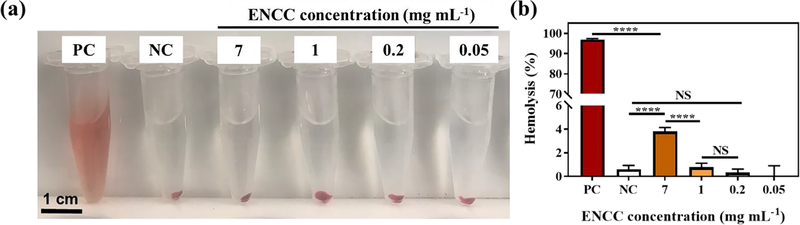
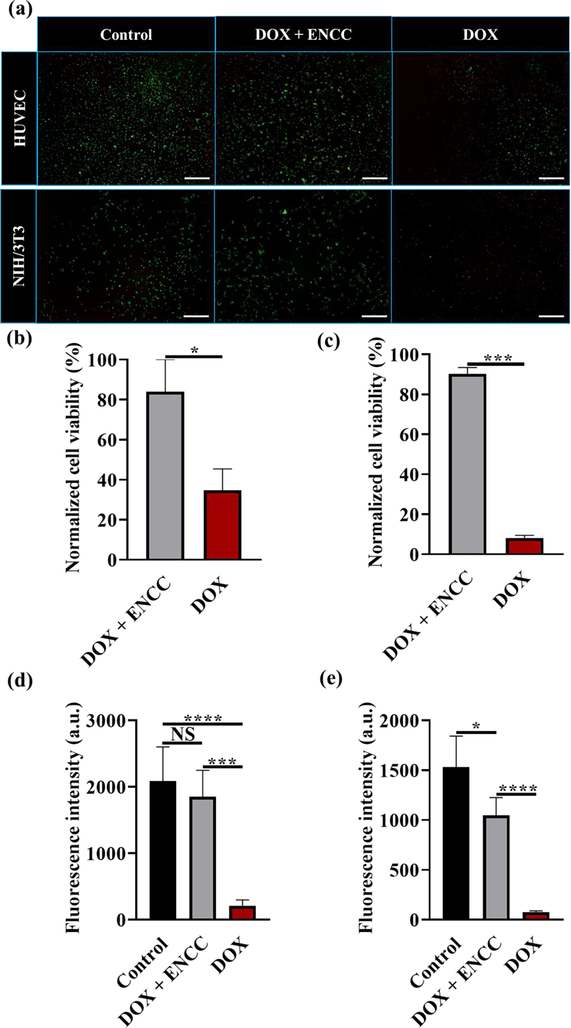
Cancer is one of the leading causes of death worldwide, affecting millions of people every year. While chemotherapy remains one of the most common cancer treatments in the world, the severe side effects of chemotherapy drugs impose serious concerns to cancer patients. In many cases, the chemotherapy can be localized to maximize the drug effects; however, the drug systemic circulation induces undesirable side effects. Here, we have developed a highly efficient cellulose-based nanoadsorbent that can capture more than 6000 mg of doxorubicin (DOX), one of the most widely used chemotherapy drugs, per gram of the adsorbent at physiological conditions. Such drug capture capacity is more than 3200% higher than other nanoadsorbents, such as DNA-based platforms. We show how anionic hairy cellulose nanocrystals, also known as electrosterically stabilized nanocrystalline cellulose (ENCC), bind to positively charged drugs in human serum and capture DOX immediately without imposing any cytotoxicity and hemolytic effects. We elucidate how ENCC provides a remarkable platform for biodetoxification at varying pH, ionic strength, ion type, and protein concentration. The outcome of this research may pave the way for developing the next generation in vitro and in vivo drug capture additives and devices.

Keywords: Cellulose nanocrystal; bioadsorbent; blood purification; chemotherapy; doxorubicin; drug capture; nanocellulose.


Conflict of interest statement

Declaration of interests The authors declare that they have no known competing financial interests or personal relationships that could have appeared to influence the work reported in this paper.

Figures

Fig. 1.
Fig. 1.. ENCC synthesis and characterization.
(a) ENCC synthesis involving two-step oxidation using periodate to initially open the glucose ring from C2-C3 bond, converting them to dialdehyde groups, followed by chlorite-mediated oxidation to carboxylate groups. AFM images of (b) CNC and (c) ENCC. Titration of ENCC (20 mg) based on (d) conductivity and (e) pH versus added base (NaOH, 10 mM) volume. The inset in panel (e) shows the first and second derivatives of pH versus NaOH volume.
Fig. 2.
Fig. 2.. Drug capture in aqueous media.
(a) DOX removal R = (C0Ce)/C0 by ENCC or CNC in DPBS versus initial DOX concentration C0, obtained from measuring the equilibrium DOX concentration Ce using a microvolume UV-vis spectrophotometer. (b) DOX capture capacity of ENCC (black symbols) or CNC (blue symbols) defined as qe = (C0Ce) V/mENCC versus equilibrium DOX concentration Ce and the corresponding Langmuir fit (curve). Sample volume V ~ 500 μL. The DOX removal capacity of ENCC in DPBS is >5200 μg mg−1, and CNC is unable to effectively capture DOX due to the lack of high-density anionic groups. The background error is corrected. (c) Optical images of DOX solutions with concentrations ranging from ~ 300 μg mL−1 to ~1400 μg mL−1 before and after the addition of ENCC with a final concentration ~ 195 μg mL−1. This wide range of concentrations corresponds to a broad ratio of DOX to the carboxylate content of ENCC (~ 0.46–2.07). (d) Time-dependent DOX capture using ENCC, showing an extremely fast drug removal taking place almost immediately after ENCC-DOX contact. Here, DOX concentration [DOX] ~ 311, 622, and 1244 μg mL−1, and ENCC concentration [ENCC] ~ 195 μg mL−1, and the ratio of DOX to the COO of ENCC ~ 0.47, 0.92, 1.82 mol mol−1. (e) Colloidal properties of DOX significantly change upon adsorption onto ENCC. Hydrodynamic size of DOX aggregates ~ 66 nm increases to ~ 350 nm, an indication of ENCC-mediated aggregation. The ζ-potential of colloidal DOX changes from ~ +24 mV to ~ −32 mV as a result of adsorption to the negatively-charged ENCC. Note that [DOX]/[COO] ~ 0.1, therefore ENCC (concentration ~ 100 μg mL−1) is not saturated, forming stable colloidal aggregates.
Fig. 3.
Fig. 3.. Effects of pH and ionic strength on ENCC-mediated DOX capture.
(a) DOX removal percentage versus initial DOX concentration, and (b) DOX capture capacity of ENCC versus equilibrium DOX concentration at pH ~ 4. Decreasing pH to 4 resulted in the protonation of carboxylic acid groups, which decreased the available DOX binding sites on ENCC, decreasing the removal percentage and capture capacity. The capture capacity at pH ~ 4 is less than half of that at pH ~ 7.4 (Fig. 2b). The effect of monovalent ion, Na+, on the (c) removal percentage and (d) capture capacity of ENCC, showing no significant impact because the equilibrium of carboxylate groups is not affected by monovalent ions. Effect of divalent ion, Ca2+, on the (e) removal percentage and (f) capture capacity of ENCC. The presence of 0.9 and 90 mM of Ca2+ decreased the DOX capture capacity of ENCC by a factor of 35% and 600%, respectively. This proves that the main drug capture mechanism is DOX-ENCC electrostatic attraction, disturbed by the divalent ion-mediated bridging of ENCC. In panels b, d, and f, the curve shows the Langmuir fit.
Fig. 4.
Fig. 4.. ENCC-mediated DOX capture in physiological media.
Effect of BSA on the DOX (a) removal percentage and (b) capture capacity of ENCC, showing that the serum albumin not only does not impair the drug capture capability of ENCC, but also enhances the removal capacity as a result of DOX-protein binding. The DOX (c) removal percentage and (d) capture capacity of ENCC in human serum. The DOX capture capacity of ENCC in human serum is remarkably high, possibly as a synergistic effect of drug-protein complex formation. (e) The drug capture time scale in human serum is extremely short, allowing for almost immediate removal of the chemotherapy drug. (f) Increasing the ENCC concentration increases the DOX removal capacity, allowing for almost complete elimination of the drug.
Fig. 5.
Fig. 5.. ENCC cytotoxicity.
(a) Effect of ENCC concentration on the HUVECs, shown with live (green)/dead (red) and F-actin (green)/DAPI (blue) staining after 24 h and 72 h post nanoparticle exposure, respectively. Magnified F-actin/DAPI images are shown in the insets. Almost all the cells are viable and have undergone spreading and elongation with no significant damage to their nuclei. The scale bars are 200 μm. (b) Metabolic activity of HUVECs after 72 h exposure to various concentrations of ENCC normalized with the metabolic activity in the absence of ENCC, obtained using the PrestoBlue™ assay. The unchanged metabolic activity of HUVECs show that ENCC is not toxic against endothelial cells.
Fig. 6.
Fig. 6.. Assessment of the hemolytic properties of ENCC.
(a) Optical images of blood exposed to varying concentrations of ENCC compared with the negative control (NC, PEG) and positive control (PC, Triton X-100). The disruption of RBC is seen as stable red color in the supernatant post-centrifugation. Up to 7 mg mL−1 of ENCC does not have any significant effect on the color of supernatant attesting to the integrity of RBCs. (b) Quantification of hemolysis percentage via measuring the absorbance of supernatant. While the positive control vigorously disrupts the RBCs resulting in >95% hemolysis, up to 7 mg mL−1 of ENCC yields less than 4% hemolysis, which is below the accepted threshold (5%).
Fig. 7.
Fig. 7.. In vitro biodetoxification effect of ENCC.
(a) Live/Dead staining of HUVECs and NIH/3T3 fibroblasts after 8 h culturing in cell culture media (control), ENCC (1 mg mL−1)-treated DOX (400 μg mL−1)-containing media, and untreated DOX (400 μg mL−1)-containing media. The scale bars are 200 μm. Normalized viability of (b) HUVECs and (c) NIH/3T3 fibroblasts calculated from analyzing the fluorescence images in panel (a). Metabolic activity of (d) HUVECs and (e) NIH/3T3 cultured in similar conditions as (a), measured using the PrestoBlue™ cell viability reagent.

References

    1. Cancer Statistics, Natl. Cancer Inst. (2020). https://www.cancer.gov/about-cancer/understanding/statistics.
    1. Pearce A, Haas M, Viney R, Pearson S-A, Haywood P, Brown C, Ward R, Incidence and severity of self-reported chemotherapy side effects in routine care: A prospective cohort study, PLoS One. 12 (2017) e0184360. doi:10.1371/journal.pone.0184360. - DOI - PMC - PubMed
    1. Siegel RL, Miller KD, Fuchs HE, Jemal A, Cancer Statistics, 2021, CA. Cancer J. Clin. 71 (2021) 7–33. doi:10.3322/caac.21654. - DOI - PubMed
    1. Waldman AD, Fritz JM, Lenardo MJ, A guide to cancer immunotherapy: from T cell basic science to clinical practice, Nat. Rev. Immunol. 20 (2020) 651–668. doi:10.1038/s41577-020-0306-5. - DOI - PMC - PubMed
    1. Shao K, Singha S, Clemente-casares X, Tsai S, Yang Y, Nanoparticle-based immunotherapy for cancer, ACS Nano. 9 (2015) 16–30. doi:10.1021/nn5062029. - DOI - PubMed

LinkOut - more resources