

Burden of Covid-19 restrictions: National, regional and global estimates
- PMID: 35224471
- PMCID: PMC8856030
- DOI: 10.1016/j.eclinm.2022.101305
Burden of Covid-19 restrictions: National, regional and global estimates
Abstract
Background: A growing literature has documented the high global morbidity, mortality and mental health burden associated with the current Covid-19 pandemic. In this paper, we aimed to quantify the total utility and quality of life loss resulting from Covid-19-related government restrictions imposed at the national, regional and global levels.
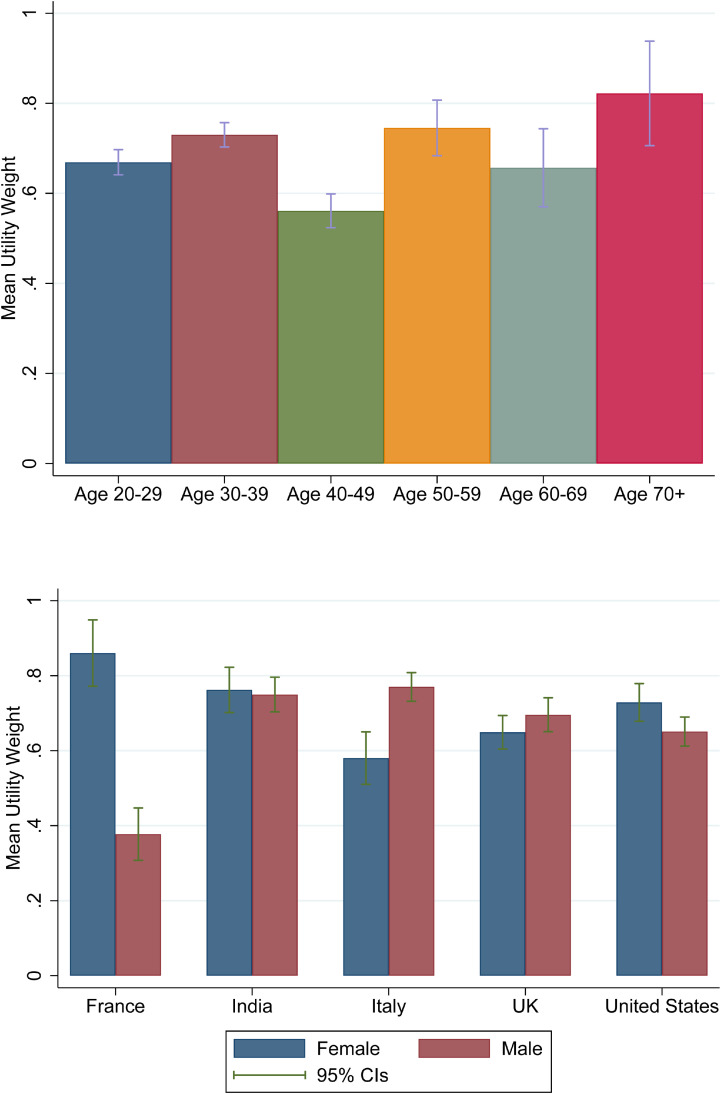
Methods: We conducted quality of life online surveys in France, India, Italy, UK and the United States of America between June 21st and September 13th 2021, and used regression models to estimate the average quality of life loss due to light and severe restrictions in these countries. We then combined estimated disutility weights from the pooled sample with the latest data on Covid-19 restrictions exposure in each country to estimate the total disutility generated by restrictions at the national, regional and global level. We also embedded a discrete choice experiment (DCE) into the online survey to estimate average willingness to pay to avoid specific restrictions.
Findings: A total of 947 surveys were completed. Thirty-five percent of respondents were female, and 69.5% were between 18 and 39 years old. The weighted average utility weight was 0.71 (95% CIs 0.69-0.74) for light restrictions, and 0.65 (0.63-0.68) for severe restrictions. At the global scale, this implies a total loss of 3259 million QALYs (95% 3021, 3496) as of September 6th, 2021, with the highest burden in lower and upper middle-income countries. Utility losses appear to be particularly large for closures of schools and daycares as well as restaurants and bars, and seem relatively small for wearing masks and travel restrictions.
Interpretation: The results presented here suggest that the QALY losses due to restrictions are substantial. Future mitigation strategies should try to balance potential reductions in disease transmission achievable through specific measures against their respective impact on quality of life. Additional research is needed to determine differences in restriction-specific disutilities across countries, and to determine optimal policy responses to similar future disease threats.
Funding: No funding was received for this project.
Keywords: Cost-effectiveness; Covid-19; QALY; Quality of life; Restrictions.
© 2022 The Author(s).
Conflict of interest statement
All three authors declare not conflicts of interest.
Figures


References
-
- Hale T., Angrist N., Goldszmidt R., et al. A global panel database of pandemic policies (Oxford COVID-19 government response tracker) Nat Hum Behav. 2021;5(4):529–538. - PubMed
-
- Pandey V. Coronavirus: how India descended into Covid-19 chaos. BBC News. 2021;Sect. https://www.bbc.com/news/world-asia-india-56977653.
-
- Courtemanche C., Garuccio J., Le A., Pinkston J., Yelowitz A. Strong social distancing measures in the United States reduced the COVID-19 growth rate: study evaluates the impact of social distancing measures on the growth rate of confirmed COVID-19 cases across the United States. Health Aff. 2020;39(7):1237–1246. - PubMed
LinkOut - more resources
Full Text Sources
