

Multicentre appraisal of amyotrophic lateral sclerosis biofluid biomarkers shows primacy of blood neurofilament light chain
- PMID: 35224491
- PMCID: PMC8870425
- DOI: 10.1093/braincomms/fcac029
Multicentre appraisal of amyotrophic lateral sclerosis biofluid biomarkers shows primacy of blood neurofilament light chain
Abstract
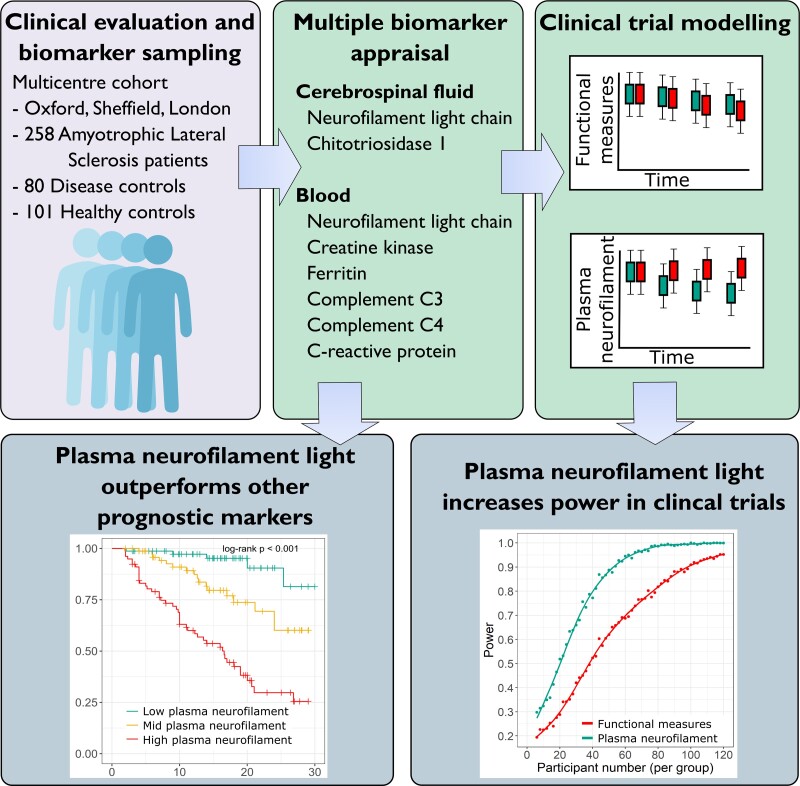
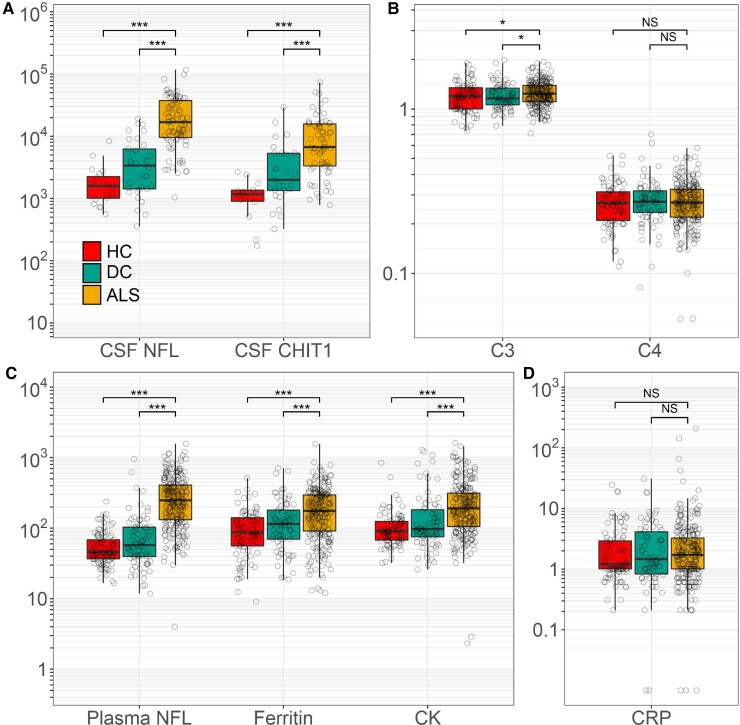
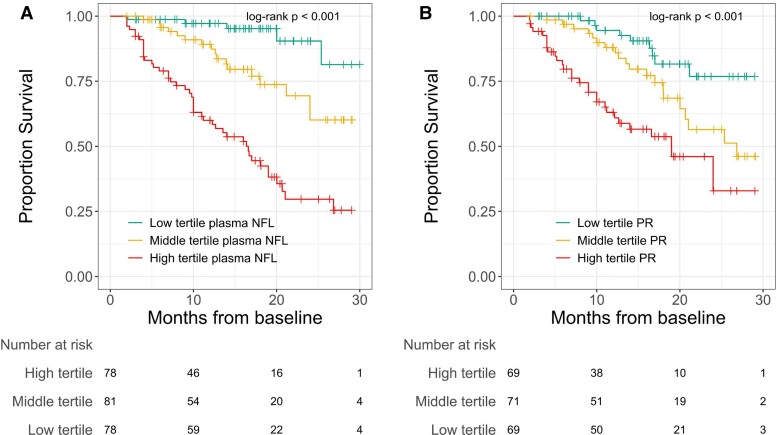
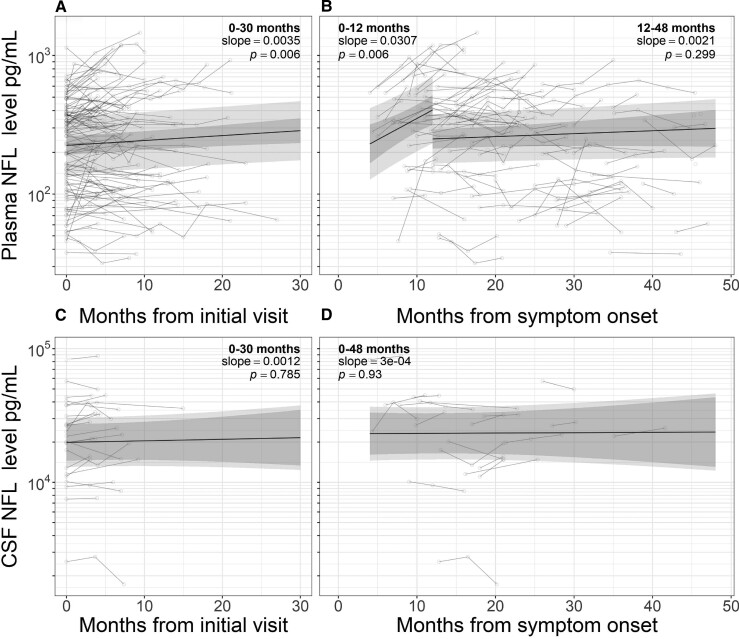
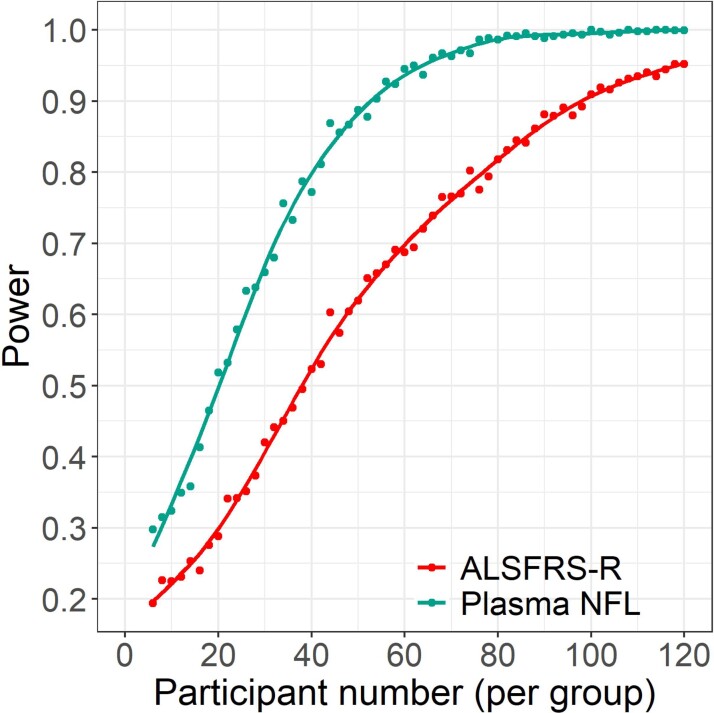
The routine clinical integration of individualized objective markers of disease activity in those diagnosed with the neurodegenerative disorder amyotrophic lateral sclerosis is a key requirement for therapeutic development. A large, multicentre, clinic-based, longitudinal cohort was used to systematically appraise the leading candidate biofluid biomarkers in the stratification and potential therapeutic assessment of those with amyotrophic lateral sclerosis. Incident patients diagnosed with amyotrophic lateral sclerosis (n = 258), other neurological diseases (n = 80) and healthy control participants (n = 101), were recruited and followed at intervals of 3-6 months for up to 30 months. Cerebrospinal fluid neurofilament light chain and chitotriosidase 1 and blood neurofilament light chain, creatine kinase, ferritin, complement C3 and C4 and C-reactive protein were measured. Blood neurofilament light chain, creatine kinase, serum ferritin, C3 and cerebrospinal fluid neurofilament light chain and chitotriosidase 1 were all significantly elevated in amyotrophic lateral sclerosis patients. First-visit plasma neurofilament light chain level was additionally strongly associated with survival (hazard ratio for one standard deviation increase in log10 plasma neurofilament light chain 2.99, 95% confidence interval 1.65-5.41, P = 0.016) and rate of disability progression, independent of other prognostic factors. A small increase in level was noted within the first 12 months after reported symptom onset (slope 0.031 log10 units per month, 95% confidence interval 0.012-0.049, P = 0.006). Modelling the inclusion of plasma neurofilament light chain as a therapeutic trial outcome measure demonstrated that a significant reduction in sample size and earlier detection of disease-slowing is possible, compared with using the revised Amyotrophic Lateral Sclerosis Functional Rating Scale. This study provides strong evidence that blood neurofilament light chain levels outperform conventional measures of disease activity at the group level. The application of blood neurofilament light chain has the potential to radically reduce the duration and cost of therapeutic trials. It might also offer a first step towards the goal of more personalized objective disease activity monitoring for those living with amyotrophic lateral sclerosis.
Keywords: amyotrophic lateral sclerosis; biomarker; motor neuron disease; neurofilament; trial.
© The Author(s) 2022. Published by Oxford University Press on behalf of the Guarantors of Brain.
Figures
References
-
- Westeneng HJ, Debray TPA, Visser AE, et al. . Prognosis for patients with amyotrophic lateral sclerosis: Development and validation of a personalised prediction model. Lancet Neurol. 2018;17(5):423–433. - PubMed
-
- McDermott CJ. Clinical trials in amyotrophic lateral sclerosis. Curr Opin Neurol. 2019;32(5):758–763. - PubMed
-
- Gaetani L, Blennow K, Calabresi P, Di Filippo M, Parnetti L, Zetterberg H. Neurofilament light chain as a biomarker in neurological disorders. J Neurol Neurosurg Psychiatry. 2019;90(8):870–881. - PubMed
Grants and funding
- MR/S006508/1/MRC_/Medical Research Council/United Kingdom
- FRATTA/JAN15/946-795/MNDA_/Motor Neurone Disease Association/United Kingdom
- TURNER/OCT18/989-797/MNDA_/Motor Neurone Disease Association/United Kingdom
- NECTAR/OCT15/974-797/MNDA_/Motor Neurone Disease Association/United Kingdom
- MR/T006927/1/MRC_/Medical Research Council/United Kingdom
LinkOut - more resources
Full Text Sources
Research Materials
Miscellaneous