. 2022 Feb 11;2(1):vbac003.
doi: 10.1093/bioadv/vbac003. eCollection 2022.

Compositional Data Analysis using Kernels in mass cytometry data

Affiliations

Compositional Data Analysis using Kernels in mass cytometry data

Pratyaydipta Rudra et al. Bioinform Adv. .

Abstract

Motivation: Cell-type abundance data arising from mass cytometry experiments are compositional in nature. Classical association tests do not apply to the compositional data due to their non-Euclidean nature. Existing methods for analysis of cell type abundance data suffer from several limitations for high-dimensional mass cytometry data, especially when the sample size is small.

Results: We proposed a new multivariate statistical learning methodology, Compositional Data Analysis using Kernels (CODAK), based on the kernel distance covariance (KDC) framework to test the association of the cell type compositions with important predictors (categorical or continuous) such as disease status. CODAK scales well for high-dimensional data and provides satisfactory performance for small sample sizes (n < 25). We conducted simulation studies to compare the performance of the method with existing methods of analyzing cell type abundance data from mass cytometry studies. The method is also applied to a high-dimensional dataset containing different subgroups of populations including Systemic Lupus Erythematosus (SLE) patients and healthy control subjects.

Availability and implementation: CODAK is implemented using R. The codes and the data used in this manuscript are available on the web at http://github.com/GhoshLab/CODAK/.

Contact: prudra@okstate.edu.

Supplementary information: Supplementary data are available at Bioinformatics Advances online.


Figures

Fig. 1.
Fig. 1.
Hierarchical tree structure of the cell types from the SLE study 2. See Supplementary Materials for a full list of the cell subpopulations. It is of interest to (i) test if the compositional profile of the cell types is associated with the disease groups, i.e. if there is differential abundance of any of the cell types between SLE patients and controls; and (ii) if yes, which cell types contribute the most to the association
Fig. 2.
Fig. 2.
Motivation of the KDC approach for the first SLE study: the densities for the kernel similarity measures are plotted when comparing the two disease groups (first panel) and when comparing the two stimulation conditions. The red curve shows the similarity of observations within the same group (conditions) and the blue curve shows the similarity of observations between groups (conditions)
Fig. 3.
Fig. 3.
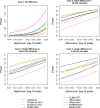
Comparison of statistical power for binary predictor adjusting for a binary covariate. The black dashed line in the first plot shows the nominal level α and the gray dashed line shows two times α. Only the methods with reasonable control of type-I error are shown in the other three plots
Fig. 4.
Fig. 4.
Comparison of CODAK with GLMM and diffcyt-voom for various effect sizes. For every simulation scenario, the true Aitchison distance (AD) and true maximum log odds ratio are plotted. The colors represent the method with a higher statistical power for that scenario. It is evident that CODAK favors higher AD while the other methods favor strong effects for individual components. Scenarios AD > 1 or |log(OR)|>0.5 are not shown since all methods had perfect power in such cases
Fig. 5.
Fig. 5.
Comparison of statistical power for binary predictor. The black dashed line in the first plot shows the nominal level α and the gray dashed line shows two times α. Only the methods with reasonable control of type-I error are shown in the other three plots. The power for the LRT-permutation is shown for one choice of α due to the high computation time
Fig. 6.
Fig. 6.
Comparison of statistical power for binary predictor adjusting for a binary covariate with repeated measures. The black dashed line in the first plot shows the nominal level α and the gray dashed line shows two times α. Only the methods with reasonable control of type-I error are shown in the other three plots
Fig. 7.
Fig. 7.
The values of the dcorLOO statistic for testing the difference in cell type abundance when comparing SLE versus healthy controls at T0 and T6

Similar articles

Cited by

References

    1. Aghaeepour N. et al. (2013) Critical assessment of automated flow cytometry data analysis techniques. Nat. Methods, 10, 228–238. - PMC - PubMed
    1. Aitchison J. (1982) The statistical analysis of compositional data. J. R. Stat. Soc. B, 44, 139–160.
    1. Aitchison J. et al. (2000) Logratio analysis and compositional distance. Math. Geol., 32, 271–275.
    1. Anderson M.J. (2014) Permutational multivariate analysis of variance (PERMANOVA). Wiley Statsref, 1–15.
    1. Anderson M.J., Legendre P. (1999) An empirical comparison of permutation methods for tests of partial regression coefficients in a linear model. J. Stat. Comput. Simul., 62, 271–303.