

Testing the assumptions of customized intrauterine growth charts using national birth studies
- PMID: 35224718
- PMCID: PMC9564604
- DOI: 10.1111/aogs.14335
Testing the assumptions of customized intrauterine growth charts using national birth studies
Abstract
Introduction: Customized intrauterine growth charts are widely used for growth monitoring and research. They are based on three assumptions: (1) estimated fetal weight (EFW) has a normal distribution with a constant coefficient of variation at all gestational ages; (2) Hadlock's growth curve accurately describes the relation between EFW and gestational ages; (3) associations between EFW and the fetal and maternal characteristics included in the customization model (fetal sex, pre-pregnancy weight, height, parity) are proportional throughout pregnancy. The aim of this study was to test whether these underlying assumptions are verified.
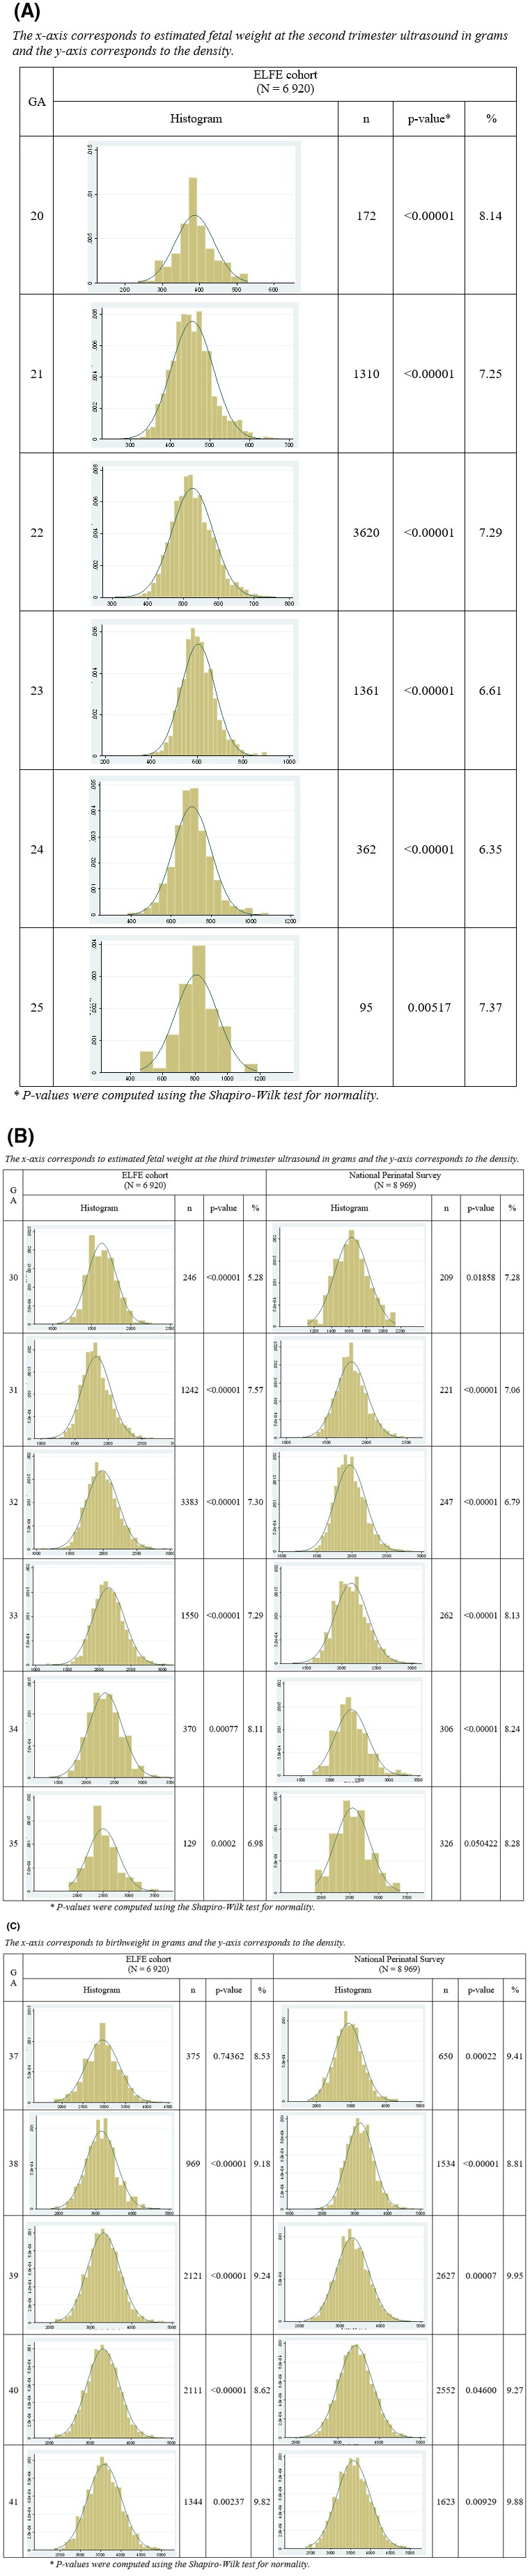
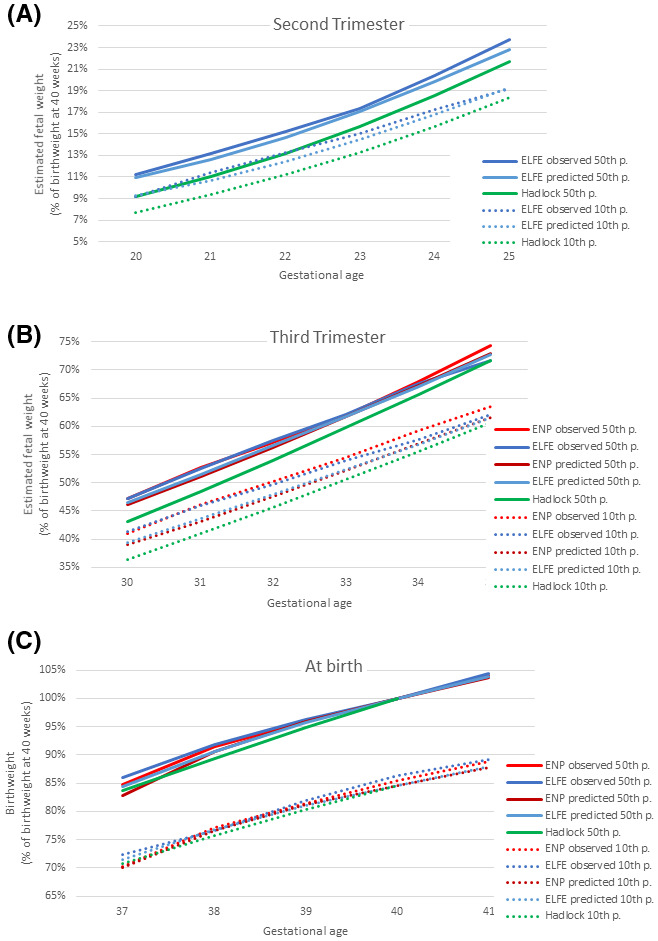
Material and methods: Data came from (1) the French Longitudinal Study of Children (ELFE) cohort, which recruited births after 32 weeks' gestation in 349 maternity hospitals in France in 2011, and (2) the National Perinatal Survey, which included births from all French maternity hospitals in 2016. The study population included, respectively, 6 920 and 8 969 singleton non-malformed term live births with data on customization characteristics and EFW. We computed the coefficient of variation by gestational age and then modeled the association of gestational age, maternal and fetal characteristics with EFW at the second and third trimester ultrasound and with birthweight using linear regression. To assess the proportionality of the impact of maternal and fetal characteristics, we computed the percent change in weight associated with these characteristics at these three time points.
Results: The coefficient of variation was close to 12% at each gestational age, but EFW was not normally distributed, leading to small but systematic underestimation of fetuses under the 10th percentile. Weights representing the 50th and 10th percentiles based on Hadlock's growth trajectory were lower than observed or predicted weights. Most characteristics more strongly impacted weight at birth than during pregnancy. In the French Longitudinal study of Children (ELFE) cohort, boys were 1.8% (95% confidence interval [CI] 1.3-2.4) heavier than girls in the third trimester, whereas this percentage was 4.6% (95% CI 4.0-5.2) at birth. In the National Perinatal Survey, these percentages were 2.3% (95% CI 1.8-2.8) and 4.3% (95% CI 3.8-4.8).
Conclusions: These results from two independent sources revealed discrepancies between routine clinical EFW data used for growth monitoring and the customized growth model's assumptions.
Keywords: customization; fetal growth; fetal growth restriction; growth charts; small for gestational age.
© 2022 The Authors. Acta Obstetricia et Gynecologica Scandinavica published by John Wiley & Sons Ltd on behalf of Nordic Federation of Societies of Obstetrics and Gynecology (NFOG).
Conflict of interest statement
None.
Figures
Similar articles
-
Which fetal growth charts should be used in France? Position of the French College of Obstetricians and Gynecologists (CNGOF).Int J Gynaecol Obstet. 2024 Aug;166(2):783-789. doi: 10.1002/ijgo.15404. Epub 2024 Jan 30. Int J Gynaecol Obstet. 2024. PMID: 38288863
-
Unisex vs sex-specific estimated fetal weight charts for fetal growth monitoring: a population-based study.Am J Obstet Gynecol MFM. 2022 Jan;4(1):100527. doi: 10.1016/j.ajogmf.2021.100527. Epub 2021 Nov 8. Am J Obstet Gynecol MFM. 2022. PMID: 34763120
-
A new customized fetal growth standard for African American women: the PRB/NICHD Detroit study.Am J Obstet Gynecol. 2018 Feb;218(2S):S679-S691.e4. doi: 10.1016/j.ajog.2017.12.229. Am J Obstet Gynecol. 2018. PMID: 29422207 Free PMC article.
-
The World Health Organization fetal growth charts: concept, findings, interpretation, and application.Am J Obstet Gynecol. 2018 Feb;218(2S):S619-S629. doi: 10.1016/j.ajog.2017.12.010. Am J Obstet Gynecol. 2018. PMID: 29422204 Review.
-
Fetal growth standards: the NICHD fetal growth study approach in context with INTERGROWTH-21st and the World Health Organization Multicentre Growth Reference Study.Am J Obstet Gynecol. 2018 Feb;218(2S):S641-S655.e28. doi: 10.1016/j.ajog.2017.11.593. Epub 2017 Dec 22. Am J Obstet Gynecol. 2018. PMID: 29275821 Free PMC article. Review.
References
-
- Baschat AA, Viscardi RM, Hussey‐Gardner B, Hashmi N, Harman C. Infant neurodevelopment following fetal growth restriction: Relationship with antepartum surveillance parameters. Ultrasound Obstet Gynecol. 2009;33:44‐50. - PubMed
-
- Flenady V, Koopmans L, Middleton P, et al. Major risk factors for stillbirth in high‐income countries: A systematic review and meta‐analysis. Lancet. 2011;377:1331‐1340. - PubMed
-
- Ganzevoort W, Mensing Van Charante N, Thilaganathan B, et al. How to monitor pregnancies complicated by fetal growth restriction and delivery before 32 weeks: post‐hoc analysis of TRUFFLE study. Ultrasound Obstet Gynecol. 2017;49:769‐777. - PubMed
MeSH terms
Grants and funding
- EHESP
- Santé Publique France
- French Ministry of Health (Direction de la Recherche, des Études, de l'Évaluation et des Statistiques, Direction Générale de la Santé and Direction Générale de l'Organisation des Soins)
- National Family Allowance Fund
- Ministère de la Culture
- French Agency for Public Health
- Ministry of Health
- Ministry of Environment
- Ministry of Higher Education and Research
- IRESP-TGIR-2009-01/French National Institute for Research in Public Health
- ANR-19-COHO-0001/Agence Nationale de la Recherche
- ANR-11-EQPX-0038/Agence Nationale de la Recherche
- >Ministry of Environment
LinkOut - more resources
Full Text Sources
