Extending the susceptible-exposed-infected-removed (SEIR) model to handle the false negative rate and symptom-based administration of COVID-19 diagnostic tests: SEIR-fansy
- PMID: 35224743
- PMCID: PMC9035093
- DOI: 10.1002/sim.9357
Extending the susceptible-exposed-infected-removed (SEIR) model to handle the false negative rate and symptom-based administration of COVID-19 diagnostic tests: SEIR-fansy
Abstract
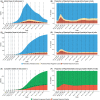
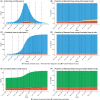
False negative rates of severe acute respiratory coronavirus 2 diagnostic tests, together with selection bias due to prioritized testing can result in inaccurate modeling of COVID-19 transmission dynamics based on reported "case" counts. We propose an extension of the widely used Susceptible-Exposed-Infected-Removed (SEIR) model that accounts for misclassification error and selection bias, and derive an analytic expression for the basic reproduction number as a function of false negative rates of the diagnostic tests and selection probabilities for getting tested. Analyzing data from the first two waves of the pandemic in India, we show that correcting for misclassification and selection leads to more accurate prediction in a test sample. We provide estimates of undetected infections and deaths between April 1, 2020 and August 31, 2021. At the end of the first wave in India, the estimated under-reporting factor for cases was at 11.1 (95% CI: 10.7,11.5) and for deaths at 3.58 (95% CI: 3.5,3.66) as of February 1, 2021, while they change to 19.2 (95% CI: 17.9, 19.9) and 4.55 (95% CI: 4.32, 4.68) as of July 1, 2021. Equivalently, 9.0% (95% CI: 8.7%, 9.3%) and 5.2% (95% CI: 5.0%, 5.6%) of total estimated infections were reported on these two dates, while 27.9% (95% CI: 27.3%, 28.6%) and 22% (95% CI: 21.4%, 23.1%) of estimated total deaths were reported. Extensive simulation studies demonstrate the effect of misclassification and selection on estimation of and prediction of future infections. A R-package SEIRfansy is developed for broader dissemination.
Keywords: R package SEIRfansy; compartmental models; infection fatality rate; reproduction number; selection bias; sensitivity; undetected infections.
© 2022 The Authors. Statistics in Medicine published by John Wiley & Sons Ltd.
Conflict of interest statement
The author declares that there is no conflict of interest that could be perceived as prejudicing the impartiality of the research reported.
Figures


Update of
-
EXTENDING THE SUSCEPTIBLE-EXPOSED-INFECTED-REMOVED(SEIR) MODEL TO HANDLE THE HIGH FALSE NEGATIVE RATE AND SYMPTOM-BASED ADMINISTRATION OF COVID-19 DIAGNOSTIC TESTS: SEIR-fansy.medRxiv [Preprint]. 2020 Sep 25:2020.09.24.20200238. doi: 10.1101/2020.09.24.20200238. medRxiv. 2020. Update in: Stat Med. 2022 Jun 15;41(13):2317-2337. doi: 10.1002/sim.9357. PMID: 32995829 Free PMC article. Updated. Preprint.
Similar articles
-
A comparison of five epidemiological models for transmission of SARS-CoV-2 in India.BMC Infect Dis. 2021 Jun 7;21(1):533. doi: 10.1186/s12879-021-06077-9. BMC Infect Dis. 2021. PMID: 34098885 Free PMC article.
-
EXTENDING THE SUSCEPTIBLE-EXPOSED-INFECTED-REMOVED(SEIR) MODEL TO HANDLE THE HIGH FALSE NEGATIVE RATE AND SYMPTOM-BASED ADMINISTRATION OF COVID-19 DIAGNOSTIC TESTS: SEIR-fansy.medRxiv [Preprint]. 2020 Sep 25:2020.09.24.20200238. doi: 10.1101/2020.09.24.20200238. medRxiv. 2020. Update in: Stat Med. 2022 Jun 15;41(13):2317-2337. doi: 10.1002/sim.9357. PMID: 32995829 Free PMC article. Updated. Preprint.
-
Estimation of the reproduction number and early prediction of the COVID-19 outbreak in India using a statistical computing approach.Epidemiol Health. 2020;42:e2020028. doi: 10.4178/epih.e2020028. Epub 2020 May 9. Epidemiol Health. 2020. PMID: 32512670 Free PMC article.
-
Universal screening for SARS-CoV-2 infection: a rapid review.Cochrane Database Syst Rev. 2020 Sep 15;9(9):CD013718. doi: 10.1002/14651858.CD013718. Cochrane Database Syst Rev. 2020. PMID: 33502003 Free PMC article.
-
Thoracic imaging tests for the diagnosis of COVID-19.Cochrane Database Syst Rev. 2020 Sep 30;9:CD013639. doi: 10.1002/14651858.CD013639.pub2. Cochrane Database Syst Rev. 2020. Update in: Cochrane Database Syst Rev. 2020 Nov 26;11:CD013639. doi: 10.1002/14651858.CD013639.pub3. PMID: 32997361 Updated.
Cited by
-
A mathematical model to assess the impact of testing and isolation compliance on the transmission of COVID-19.Infect Dis Model. 2023 Jun;8(2):427-444. doi: 10.1016/j.idm.2023.04.005. Epub 2023 Apr 20. Infect Dis Model. 2023. PMID: 37113557 Free PMC article.
-
Discussion on "Regression Models for Understanding COVID-19 Epidemic Dynamics with Incomplete Data".J Am Stat Assoc. 2021;116(536):1583-1586. doi: 10.1080/01621459.2021.1982721. Epub 2021 Dec 16. J Am Stat Assoc. 2021. PMID: 39439741 Free PMC article. No abstract available.
-
Overcoming bias in estimating epidemiological parameters with realistic history-dependent disease spread dynamics.Nat Commun. 2024 Oct 9;15(1):8734. doi: 10.1038/s41467-024-53095-7. Nat Commun. 2024. PMID: 39384847 Free PMC article.
-
Integro-differential approach for modeling the COVID-19 dynamics - Impact of confinement measures in Italy.Comput Biol Med. 2021 Dec;139:105013. doi: 10.1016/j.compbiomed.2021.105013. Epub 2021 Nov 2. Comput Biol Med. 2021. PMID: 34741908 Free PMC article.
-
A comparison of five epidemiological models for transmission of SARS-CoV-2 in India.BMC Infect Dis. 2021 Jun 7;21(1):533. doi: 10.1186/s12879-021-06077-9. BMC Infect Dis. 2021. PMID: 34098885 Free PMC article.
References
-
- Johns Hopkins University . COVID‐19 dashboard by the Center for Systems Science and Engineering (CSSE) at Johns Hopkins University (JHU); 2020. https://gisanddata.maps.arcgis.com/apps/opsdashboard/index.html#/bda7594740fd40299423467b48e9ecf6. Accessed April 7, 2020.
Publication types
MeSH terms
Grants and funding
LinkOut - more resources
Full Text Sources
Medical
Miscellaneous
