. 2022 Feb 11:(180):10.3791/63395.
doi: 10.3791/63395.

Efficient SARS-CoV-2 Quantitative Reverse Transcriptase PCR Saliva Diagnostic Strategy utilizing Open-Source Pipetting Robots

Affiliations

Efficient SARS-CoV-2 Quantitative Reverse Transcriptase PCR Saliva Diagnostic Strategy utilizing Open-Source Pipetting Robots

Rachel E Ham et al. J Vis Exp. .

Abstract

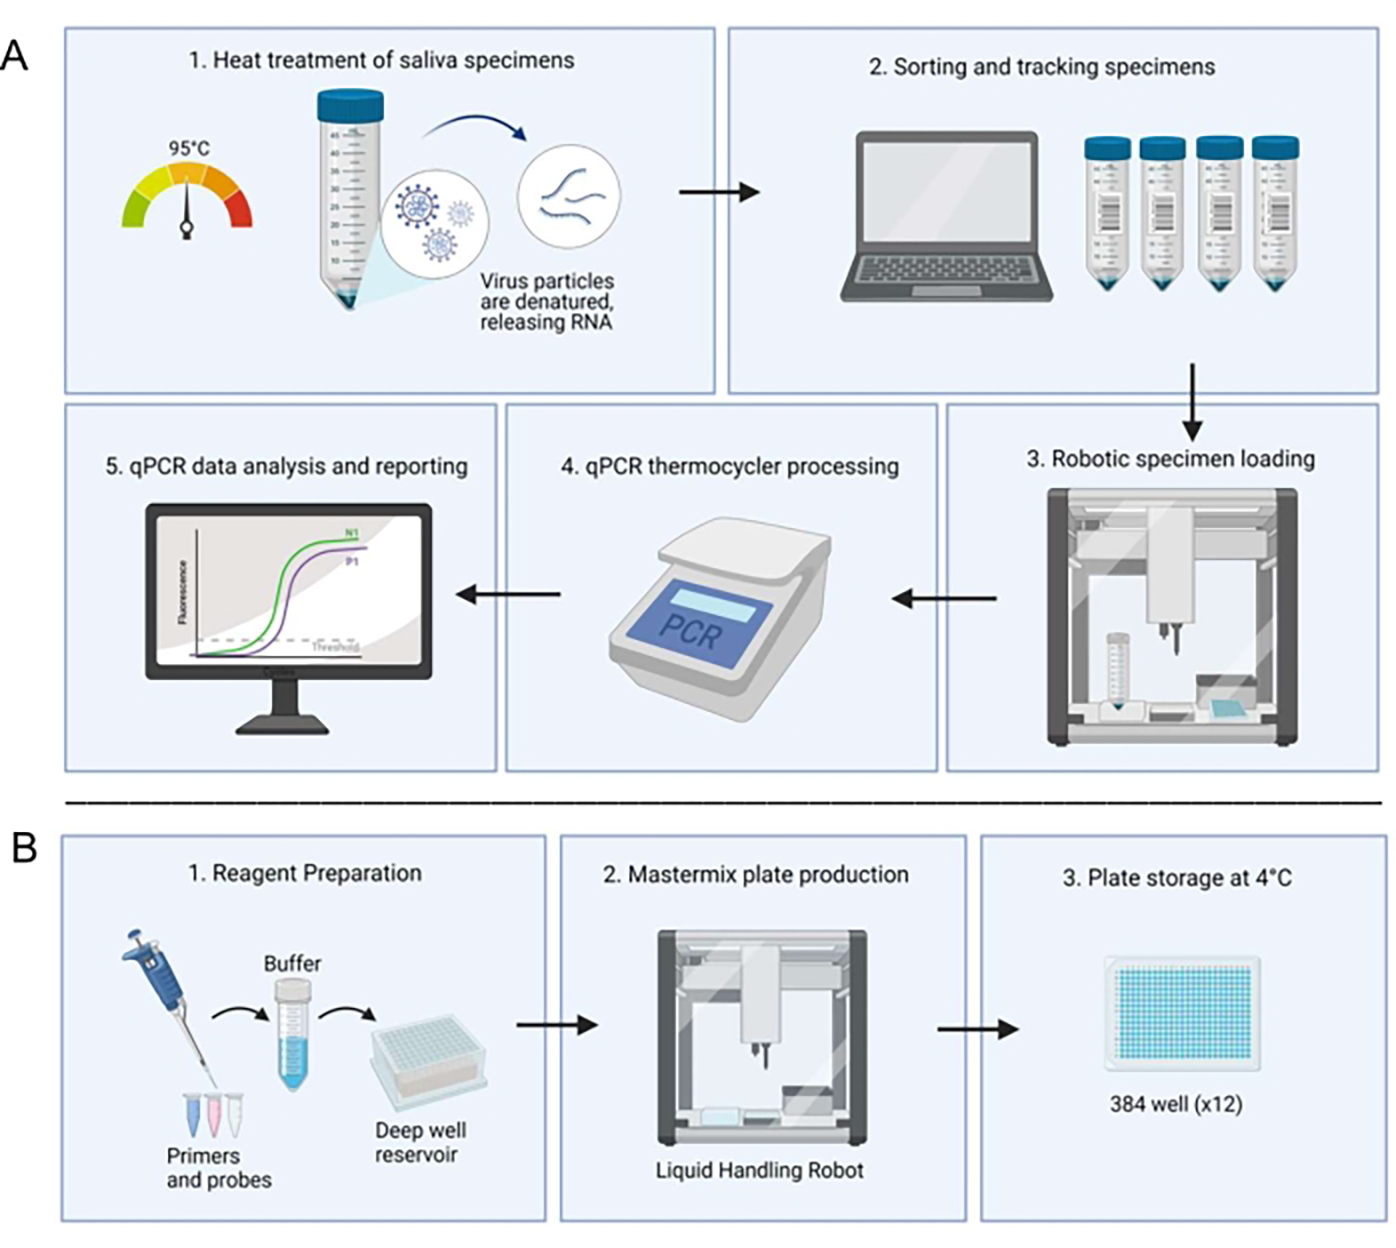
The emergence of the recent SARS-CoV-2 global health crisis introduced key challenges for epidemiological research and clinical testing. Characterized by a high rate of transmission and low mortality, the COVID-19 pandemic necessitated accurate and efficient diagnostic testing, particularly in closed populations such as residential universities. Initial availability of nucleic acid testing, like nasopharyngeal swabs, was limited due to supply chain pressure which also delayed reporting of test results. Saliva-based reverse transcriptase quantitative polymerase chain reaction (RT-qPCR) testing has shown to be comparable in sensitivity and specificity to other testing methods, and saliva collection is less physically invasive to participants. Consequently, we developed a multiplex RT-qPCR diagnostic assay for population surveillance of Clemson University and the surrounding community. The assay utilized open-source liquid handling robots and thermocyclers instead of complex clinical automation systems to optimize workflow and system flexibility. Automation of saliva-based RT-qPCR enables rapid and accurate detection of a wide range of viral RNA concentrations for both large- and small-scale testing demands. The average turnaround for the automated system was < 9 h for 95% of samples and < 24 h for 99% of samples. The cost for a single test was $2.80 when all reagents were purchased in bulk quantities.


Figures

Figure 1:
Figure 1:. Laboratory workflow utilizing the saliva-based RT-qPCR diagnostic system.
(A) Samples are collected and heat-treated at 95 °C for 30 min. Treated samples are sorted and tracked with patient information through an in-house spreadsheet system. A liquid handling robot loads samples into duplicate wells of prepared master mix plates. A technician manually loads the controls, seals the plate, and places the plate in a thermocycler for processing. Results are analyzed through an automated computer system and verified by a technician. (B) A technician prepares reagents for the master mix which are added to a deep well reservoir in a sterile biosafety cabinet. Filled deep well reservoirs are loaded into a dedicated liquid handling robot. Completed plates are sealed with foil, labeled, and stored at 4 °C.
Figure 2:
Figure 2:. Layouts used for the liquid handling robot.
(A) Deck layout for master mix plate preparation robot(s). With an eight-channel pipette, the robot is programmed to pick up pipette tips, aspirate master mix from a 96-well deep well reservoir, dispense master mix into empty 384-well plates, and eject the pipette tips into a waste bin. This is repeated for six plates per run. (B) Deck setup for sample loading robot(s). With a single-channel pipette, the robot is programmed to pick up a pipette tip, aspirate a saliva sample, dispense a saliva sample into duplicate wells of a 384-well master mix plate, and eject the pipette tip into a waste bin. This is repeated for 48 samples per run. (C) Sample tube loading order for 3D printed racks. Red arrows indicate loading order within a rack, and the white boxed numbers indicate the loading order of the entire set of racks. The entire setup will load 188 samples in duplicate into a 384-well plate.
Figure 3:
Figure 3:. Sample resulting flowchart.
Samples with valid P1 and positive N1 were determined to be human saliva samples positive for SARS-CoV-2. Valid and positive/negative sample results were considered conclusive. Samples that did not produce conclusive results in the first run were categorized as Rerun (denoted RR) or N1 Rerun (denoted N1 RR). Rerun samples had no valid P1 amplification, and N1 Rerun samples had positive N1 amplification in a single replicate. If no valid P1 amplification could be produced by a subsequent manual run, or both replicates had N1 Ct values above the positive threshold (Ct >33), the sample results were considered inconclusive. For clinical purposes, patient samples that did not arrive at the lab, had an insufficient quantity of saliva to pipette or were damaged were considered invalid.
Figure 4:
Figure 4:. RT-qPCR detection of N1 (SARS-CoV-2) synthetic RNA and P1 (Hs_RPP30) synthetic DNA.
Standard curves were plotted with standard deviations to determine the range of accurate detection using this probe/primer combination. (A) The mean Ct values (n =4) obtained in respective dilutions were plotted against the estimated quantity of synthetic RNA (1×100 to 1×10⁴ RNA copies in 10 μL of RT-qPCR reaction). (B) The mean Ct values (n =3) obtained in respective dilutions were plotted against the estimated quantity of synthetic DNA (1 × 100 to 1 × 10⁴ gene copies in 10 μL of RT-qPCR reaction).
Figure 5:
Figure 5:. Comparison between manual and automated saliva transfer SARS-CoV-2 (N1) Ct values.
The known SARS-CoV-2 positive saliva samples (n =20) were loaded in duplicate into an RT-qPCR master mix plate by a liquid handling robot. The samples have a Ct value ranging from 18–32 for N1. The same samples were then manually loaded into duplicate wells in a different plate location. (A) N1 Ct values obtained from unique samples using both the robot and manual sample loading were transposed to determine inter-assay variability between manual and robot loading. (B) Intra-assay variability was also determined by using transposed replicate of N1 Ct values obtained from both robot and manual sample loading.
Figure 6:
Figure 6:. Evaluation of heat treatment methods for viscosity reduction in saliva.
SARS-CoV-2 negative saliva was collected from a single source and aliquots were heat-treated for either 0 min, 30 min, or 60 min at 95 °C. P1 Ct values from technical replicates (n =12) of each condition were plotted to determine variability between treatment methods. Pairwise comparisons between groups were evaluated with an unpaired t-test (*** indicates p <0.001, * indicates p <0.05).

References

    1. Zhu N, et al. A novel coronavirus from patients with pneumonia in China, 2019. New England Journal Medicine. 382 (8), 727–733 (2020). - PMC - PubMed
    1. Chen J Pathogenicity and transmissibility of 2019-nCoV-A quick overview and comparison with other emerging viruses. Microbes and Infection. 22 (2), 69–71 (2020). - PMC - PubMed
    1. Petersen E et al. Comparing SARS-CoV-2 with SARS-CoV and influenza pandemics. The Lancet. Infectious Diseases. 20 (9), e238–244 (2020). - PMC - PubMed
    1. Honein MA et al. Summary of Guidance for Public Health Strategies to Address High Levels of Community Transmission of SARS-CoV-2 and Related Deaths, December 2020. MMWR. Morbidity and Mortality Weekly Report. 69 (49), 1860–1867 (2020). - PMC - PubMed
    1. World Health Organization. Surveillance strategies for COVID-19 human infection: interim guidance, 10 May 2020. World Health Organization. https://apps.who.int/iris/handle/10665/332051 (2020).

Publication types