. 2022 Feb;32(2):e12987.
doi: 10.1111/ina.12987.

Reduction of exposure to simulated respiratory aerosols using ventilation, physical distancing, and universal masking

Affiliations

Reduction of exposure to simulated respiratory aerosols using ventilation, physical distancing, and universal masking

Jayme P Coyle et al. Indoor Air. 2022 Feb.

Abstract

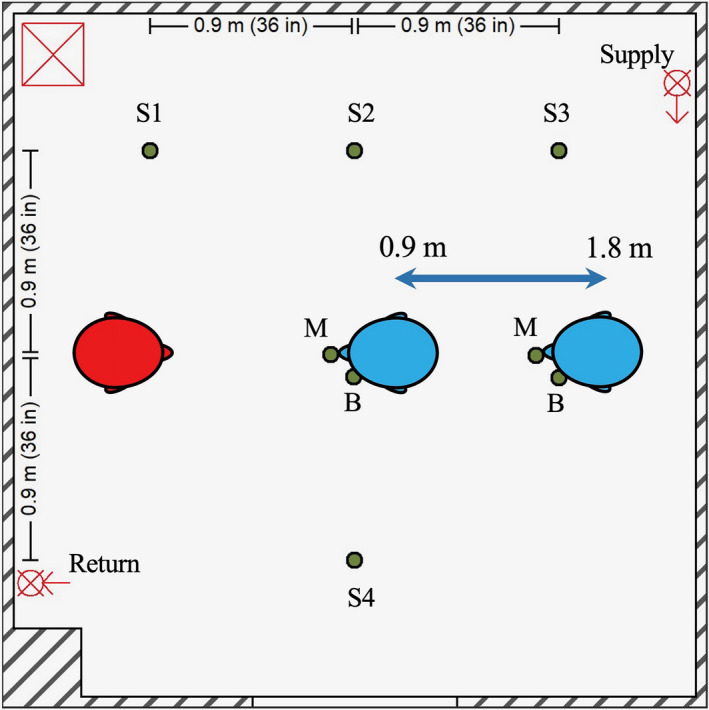
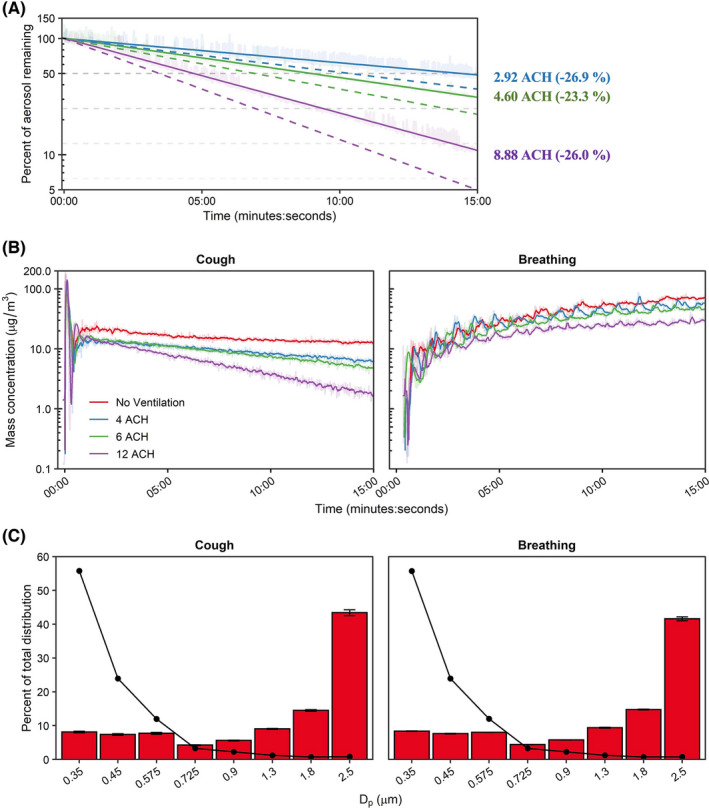
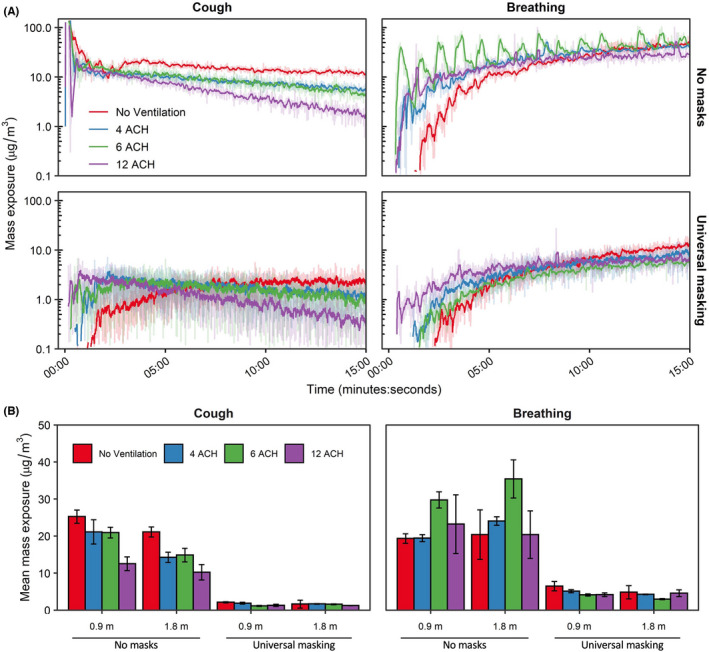
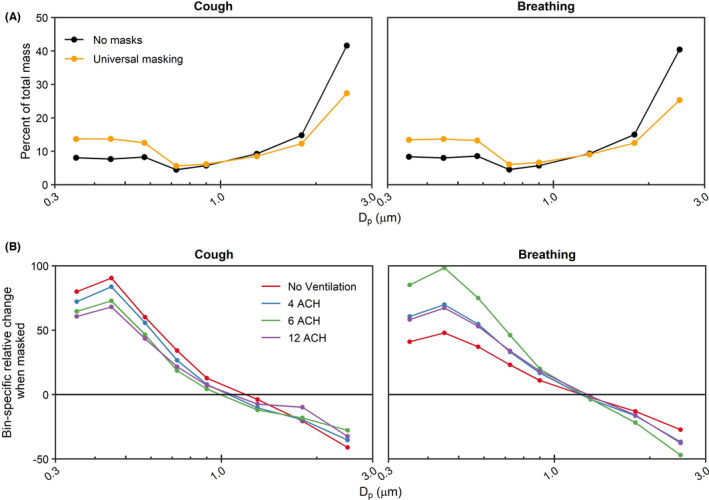
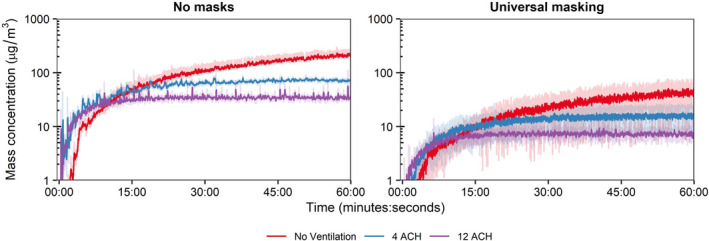
To limit community spread of SARS-CoV-2, CDC recommends universal masking indoors, maintaining 1.8 m of physical distancing, adequate ventilation, and avoiding crowded indoor spaces. Several studies have examined the independent influence of each control strategy in mitigating transmission in isolation, yet controls are often implemented concomitantly within an indoor environment. To address the influence of physical distancing, universal masking, and ventilation on very fine respiratory droplets and aerosol particle exposure, a simulator that coughed and exhaled aerosols (the source) and a second breathing simulator (the recipient) were placed in an exposure chamber. When controlling for the other two mitigation strategies, universal masking with 3-ply cotton masks reduced exposure to 0.3-3 µm coughed and exhaled aerosol particles by >77% compared to unmasked tests, whereas physical distancing (0.9 or 1.8 m) significantly changed exposure to cough but not exhaled aerosols. The effectiveness of ventilation depended upon the respiratory activity, that is, coughing or breathing, as well as the duration of exposure time. Our results demonstrate that a layered mitigation strategy approach of administrative and engineering controls can reduce personal inhalation exposure to potentially infectious very fine respiratory droplets and aerosol particles within an indoor environment.

Keywords: exposure reduction; physical distancing; universal masking; ventilation.


Conflict of interest statement

The authors declare that they have no known competing financial interests or personal relationships that could have appeared to influence the work reported in this paper.

Figures

FIGURE 1
FIGURE 1
Experimental setup and simulators. Diagram of environmental chamber setup showing positions of the aerosol source simulator (red), recipient simulators (blue; position adjustable between 0.9 and 1.8 m), and OPCs (green dots) for area measurements (S1–4) and personal breathing zone measurements at the mouth (M) and beside the head (B) of the recipient. The room air supply (at the ceiling) and return (near the floor) for the HEPA system are each shown with a circle and “X.” The HEPA filter and blower unit are demarcated by the red square containing an “X”
FIGURE 2
FIGURE 2
Ventilation and aerosol characterization. (A) Environmental chamber particle decay rates across HEPA ventilation settings. Dashed lines indicate the theoretical decay rate for each examined ventilation rate; solid lines indicate effective rates determined. Enumerated effective air exchange rates shown at the end time‐point with percent error from theoretical (negative value indicates lower than theoretical). (B) Mean chamber mass concentration‐time curves of simulated very fine respiratory droplets and aerosol particles for the examined respiratory actions and ventilation rates. (C) Bin‐specific particle distributions as determined by mass (bars) and by number of particles (line). The median particle diameter (Dp) indicates the bin. Results are the arithmetic mean ± standard deviation of three independent experiments. Error bars for the number of particles (line) too small to visualize. ACH, Air changes per hour
FIGURE 3
FIGURE 3
Aerosol mass exposure of the recipient. (A) Mass exposure concentration over time across the matrix of modalities, masking status, and ventilation for the 1.8 m physical distance. Results for the 0.9 m physical distance are provided in the Figure S3. Data are the arithmetic mean of three independent experiments. (B) Mean mass exposure over the 15‐min simulation period derived from the time curves. Results are the arithmetic mean ± standard deviation of three independent experiments. No statistical comparisons were made between individual groups. ACH, Air changes per hour
FIGURE 4
FIGURE 4
Aerosol size distribution shifts during masking. (A) Bin‐specific percent of mass distribution averaged across all ventilation rates. (B) Bin‐specific percent change of aerosol distribution stratified by ventilation rate. The median particle diameter (Dp) indicates the bin. Data are the arithmetic mean of three independent experiments. ACH, Air changes per hour
FIGURE 5
FIGURE 5
Extended breathing assessment. Mass exposure concentration‐time curves over 60 min for breathing at the 1.8 m physical distance and three ventilation rates. Results are the arithmetic mean ± standard deviation of three independent experiments. ACH, Air changes per hour

References

    1. Jones RM, Brosseau LM. Aerosol transmission of infectious disease. J Occup Environ Med. 2015;57(5):501‐508. - PubMed
    1. Leech JA, Nelson WC, Burnett RT, Aaron S, Raizenne ME. It's about time: a comparison of Canadian and American time‐activity patterns. J Expo Anal Environ Epidemiol. 2002;12(6):427‐432. - PubMed
    1. Qian H, Miao T, Liu L, Zheng X, Luo D, Li Y. Indoor transmission of SARS‐CoV‐2. Indoor Air. 2021;31(3):639‐645. - PubMed
    1. Nishiura H, Kobayashi T, Miyama T, et al. Estimation of the asymptomatic ratio of novel coronavirus infections (COVID‐19). Int J Infect Dis. 2020;94:154‐155. - PMC - PubMed
    1. Shen J, Kong M, Dong B, Birnkrant MJ, Zhang J. Airborne transmission of SARS‐CoV‐2 in indoor environments: a comprehensive review. Sci Technol Built Environ. 2021;27(10):1331‐1367.

Publication types