Meta-Analysis
. 2022 Apr 1;79(4):390-398.
doi: 10.1001/jamaneurol.2021.5598.

Neurologic Prognostication After Cardiac Arrest Using Brain Biomarkers: A Systematic Review and Meta-analysis

Affiliations
Meta-Analysis

Neurologic Prognostication After Cardiac Arrest Using Brain Biomarkers: A Systematic Review and Meta-analysis

Ryan L Hoiland et al. JAMA Neurol. .

Abstract

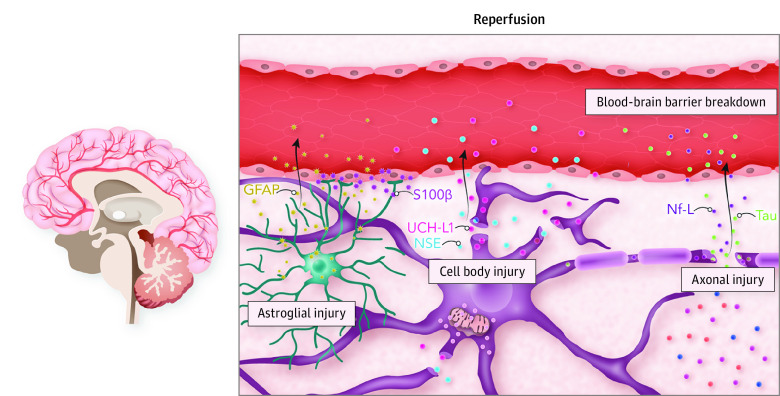
Importance: Brain injury biomarkers released into circulation from the injured neurovascular unit are important prognostic tools in patients with cardiac arrest who develop hypoxic ischemic brain injury (HIBI) after return of spontaneous circulation (ROSC).

Objective: To assess the neuroprognostic utility of bloodborne brain injury biomarkers in patients with cardiac arrest with HIBI.

Data sources: Studies in electronic databases from inception to September 15, 2021. These databases included MEDLINE, Embase, Evidence-Based Medicine Reviews, CINAHL, Cochrane Database of Systematic Reviews, and the World Health Organization Global Health Library.

Study selection: Articles included in this systmatic review and meta-analysis were independently assessed by 2 reviewers. We included studies that investigated neuron-specific enolase, S100 calcium-binding protein β, glial fibrillary acidic protein, neurofilament light, tau, or ubiquitin carboxyl hydrolase L1 in patients with cardiac arrest aged 18 years and older for neurologic prognostication. We excluded studies that did not (1) dichotomize neurologic outcome as favorable vs unfavorable, (2) specify the timing of blood sampling or outcome determination, or (3) report diagnostic test accuracy or biomarker concentration.

Data extraction and synthesis: Data on the study design, inclusion and exclusion criteria, brain biomarkers levels, diagnostic test accuracy, and neurologic outcome were recorded. This study was conducted in accordance with the Preferred Reporting Items for Systematic Reviews and Meta-Analyses (PRISMA) guideline.

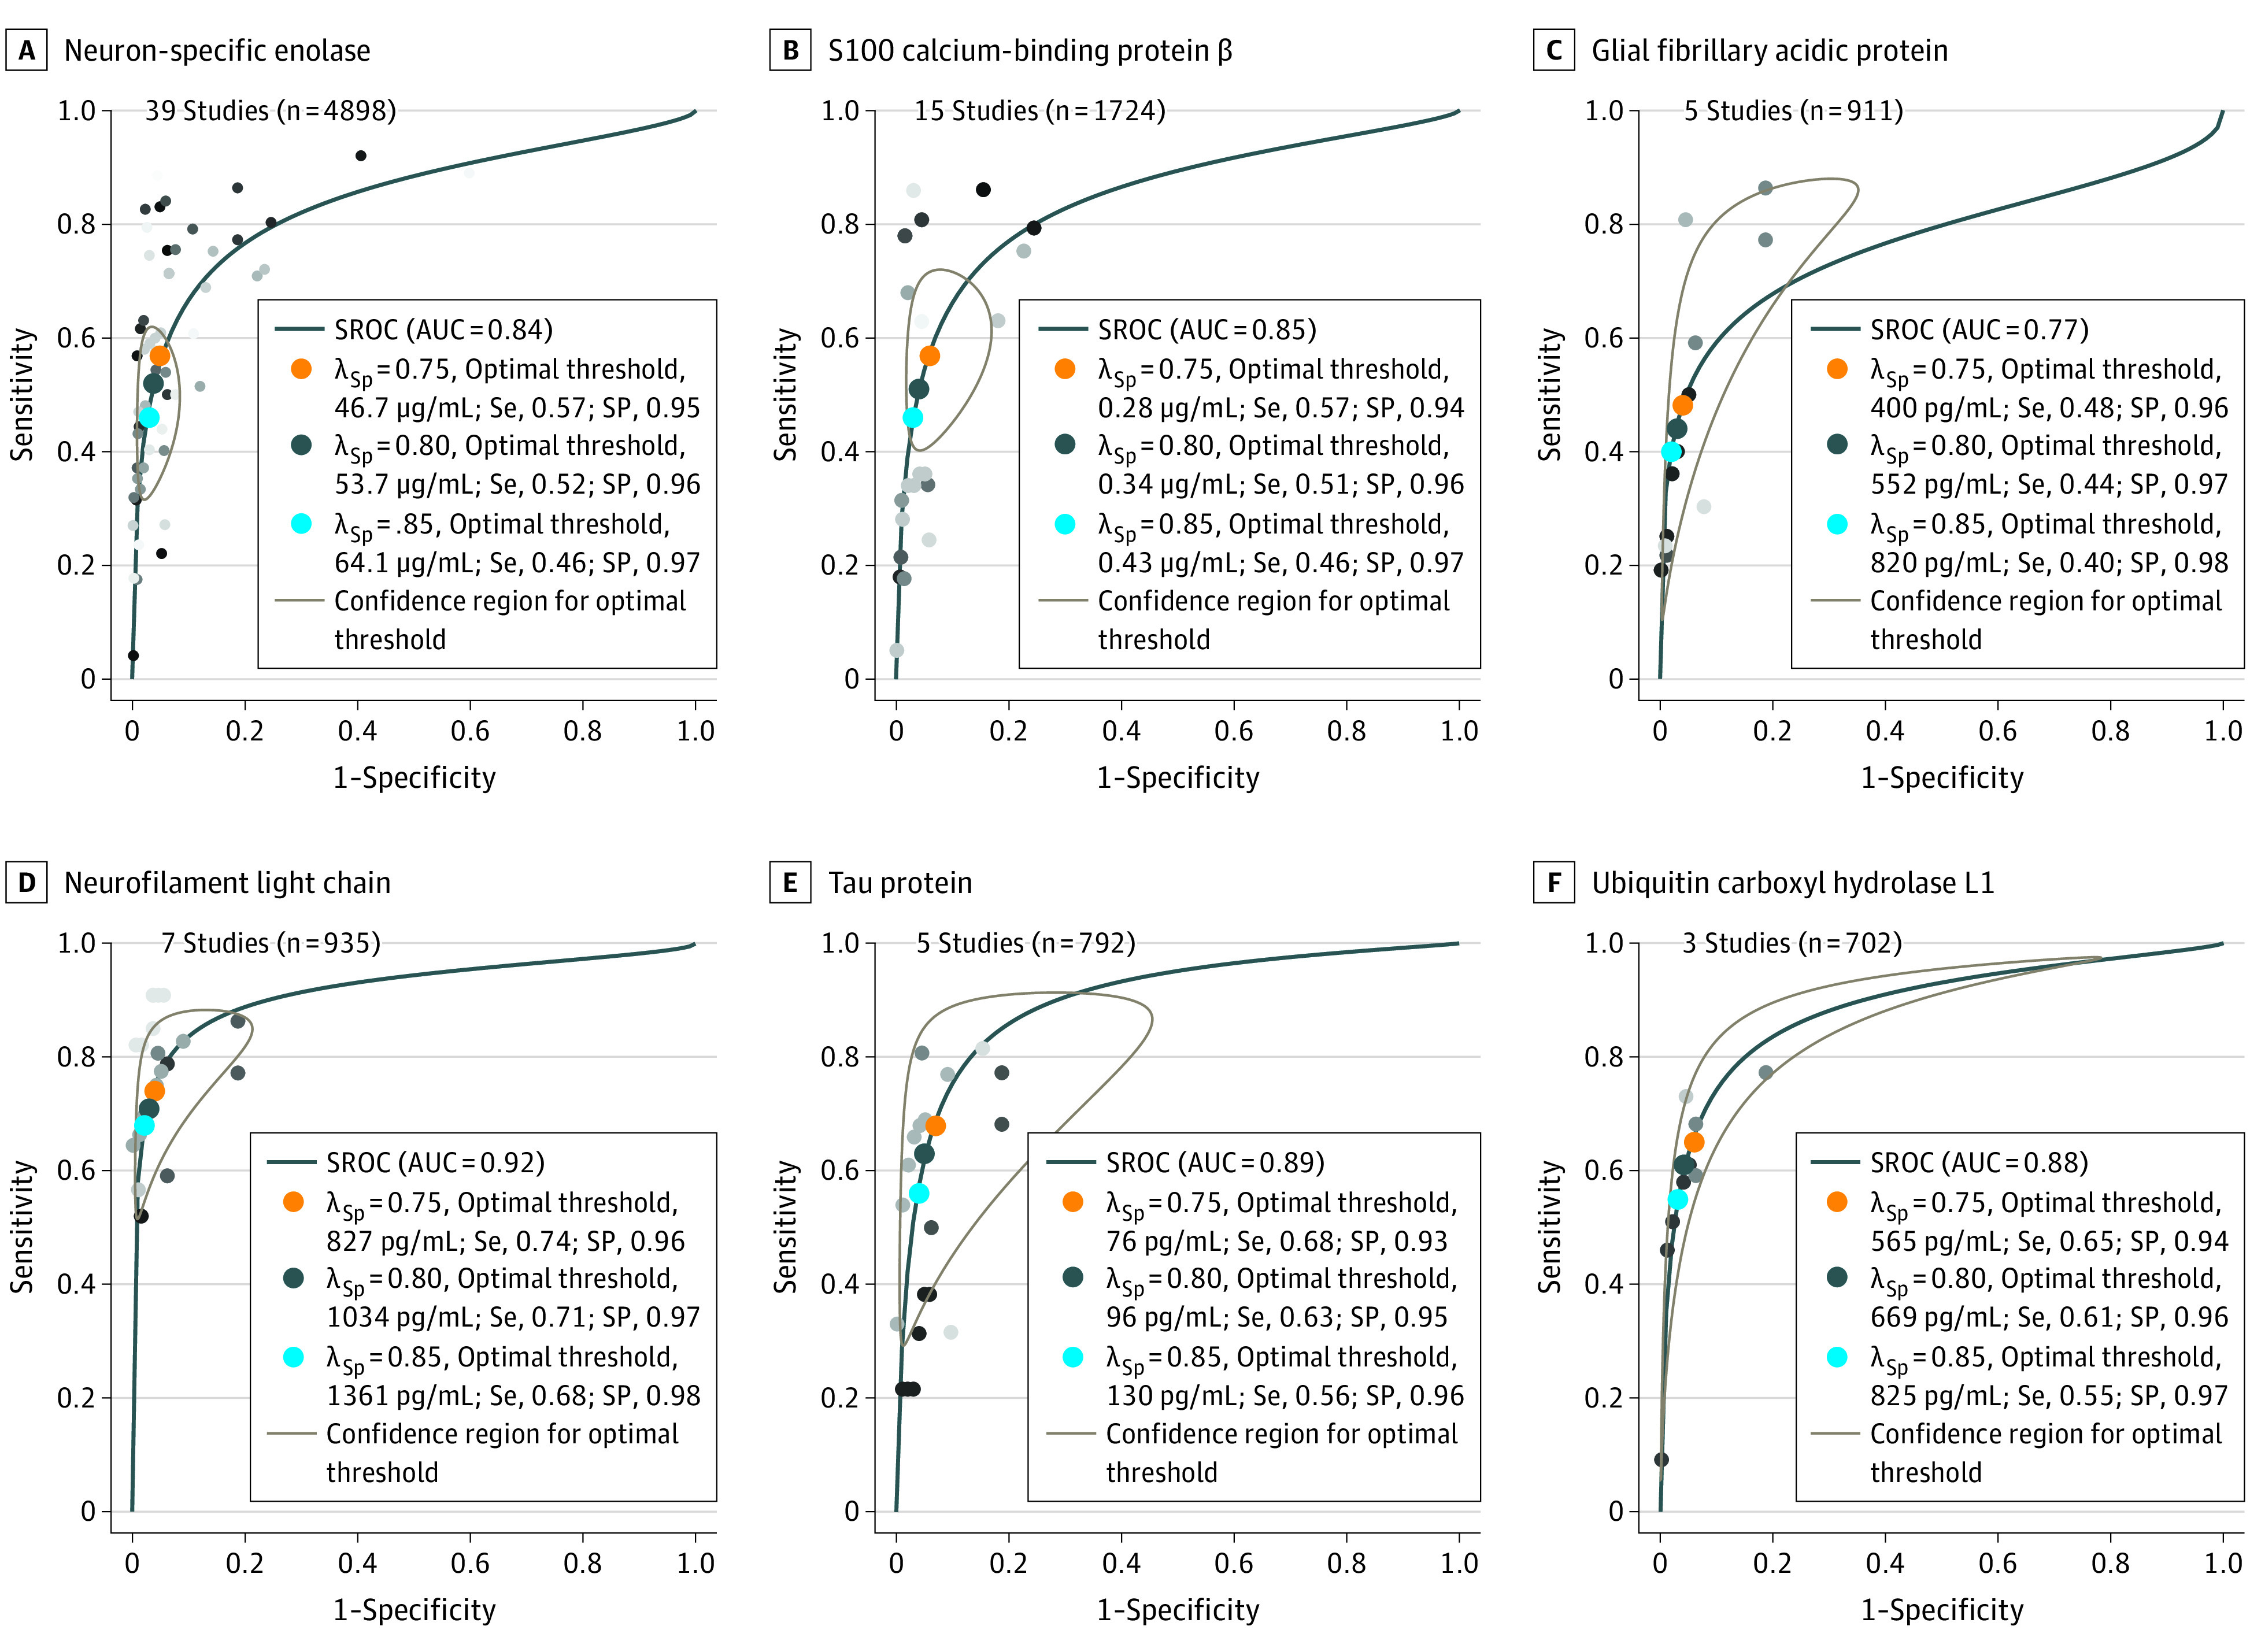
Main outcomes and measures: Summary receiver operating characteristic curve analysis was used to calculate the area under the curve, sensitivity, specificity, and optimal thresholds for each biomarker. Risk of bias and concerns of applicability were assessed with the Quality Assessment of Diagnostic Accuracy Studies (QUADAS-2) tool.

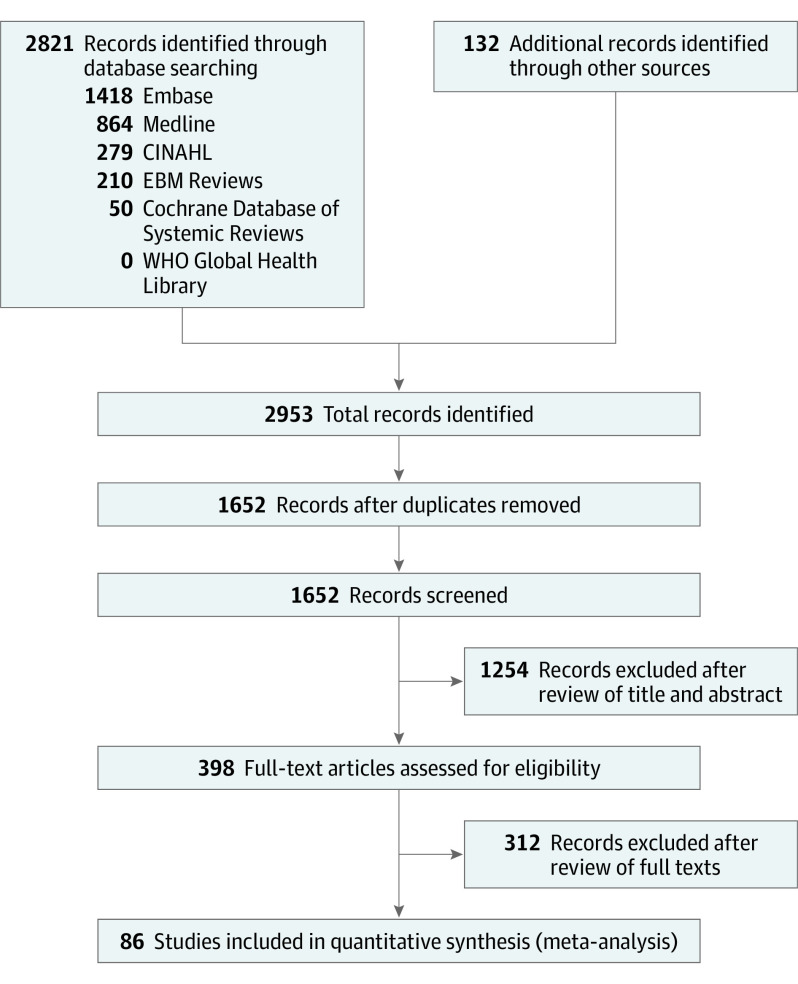
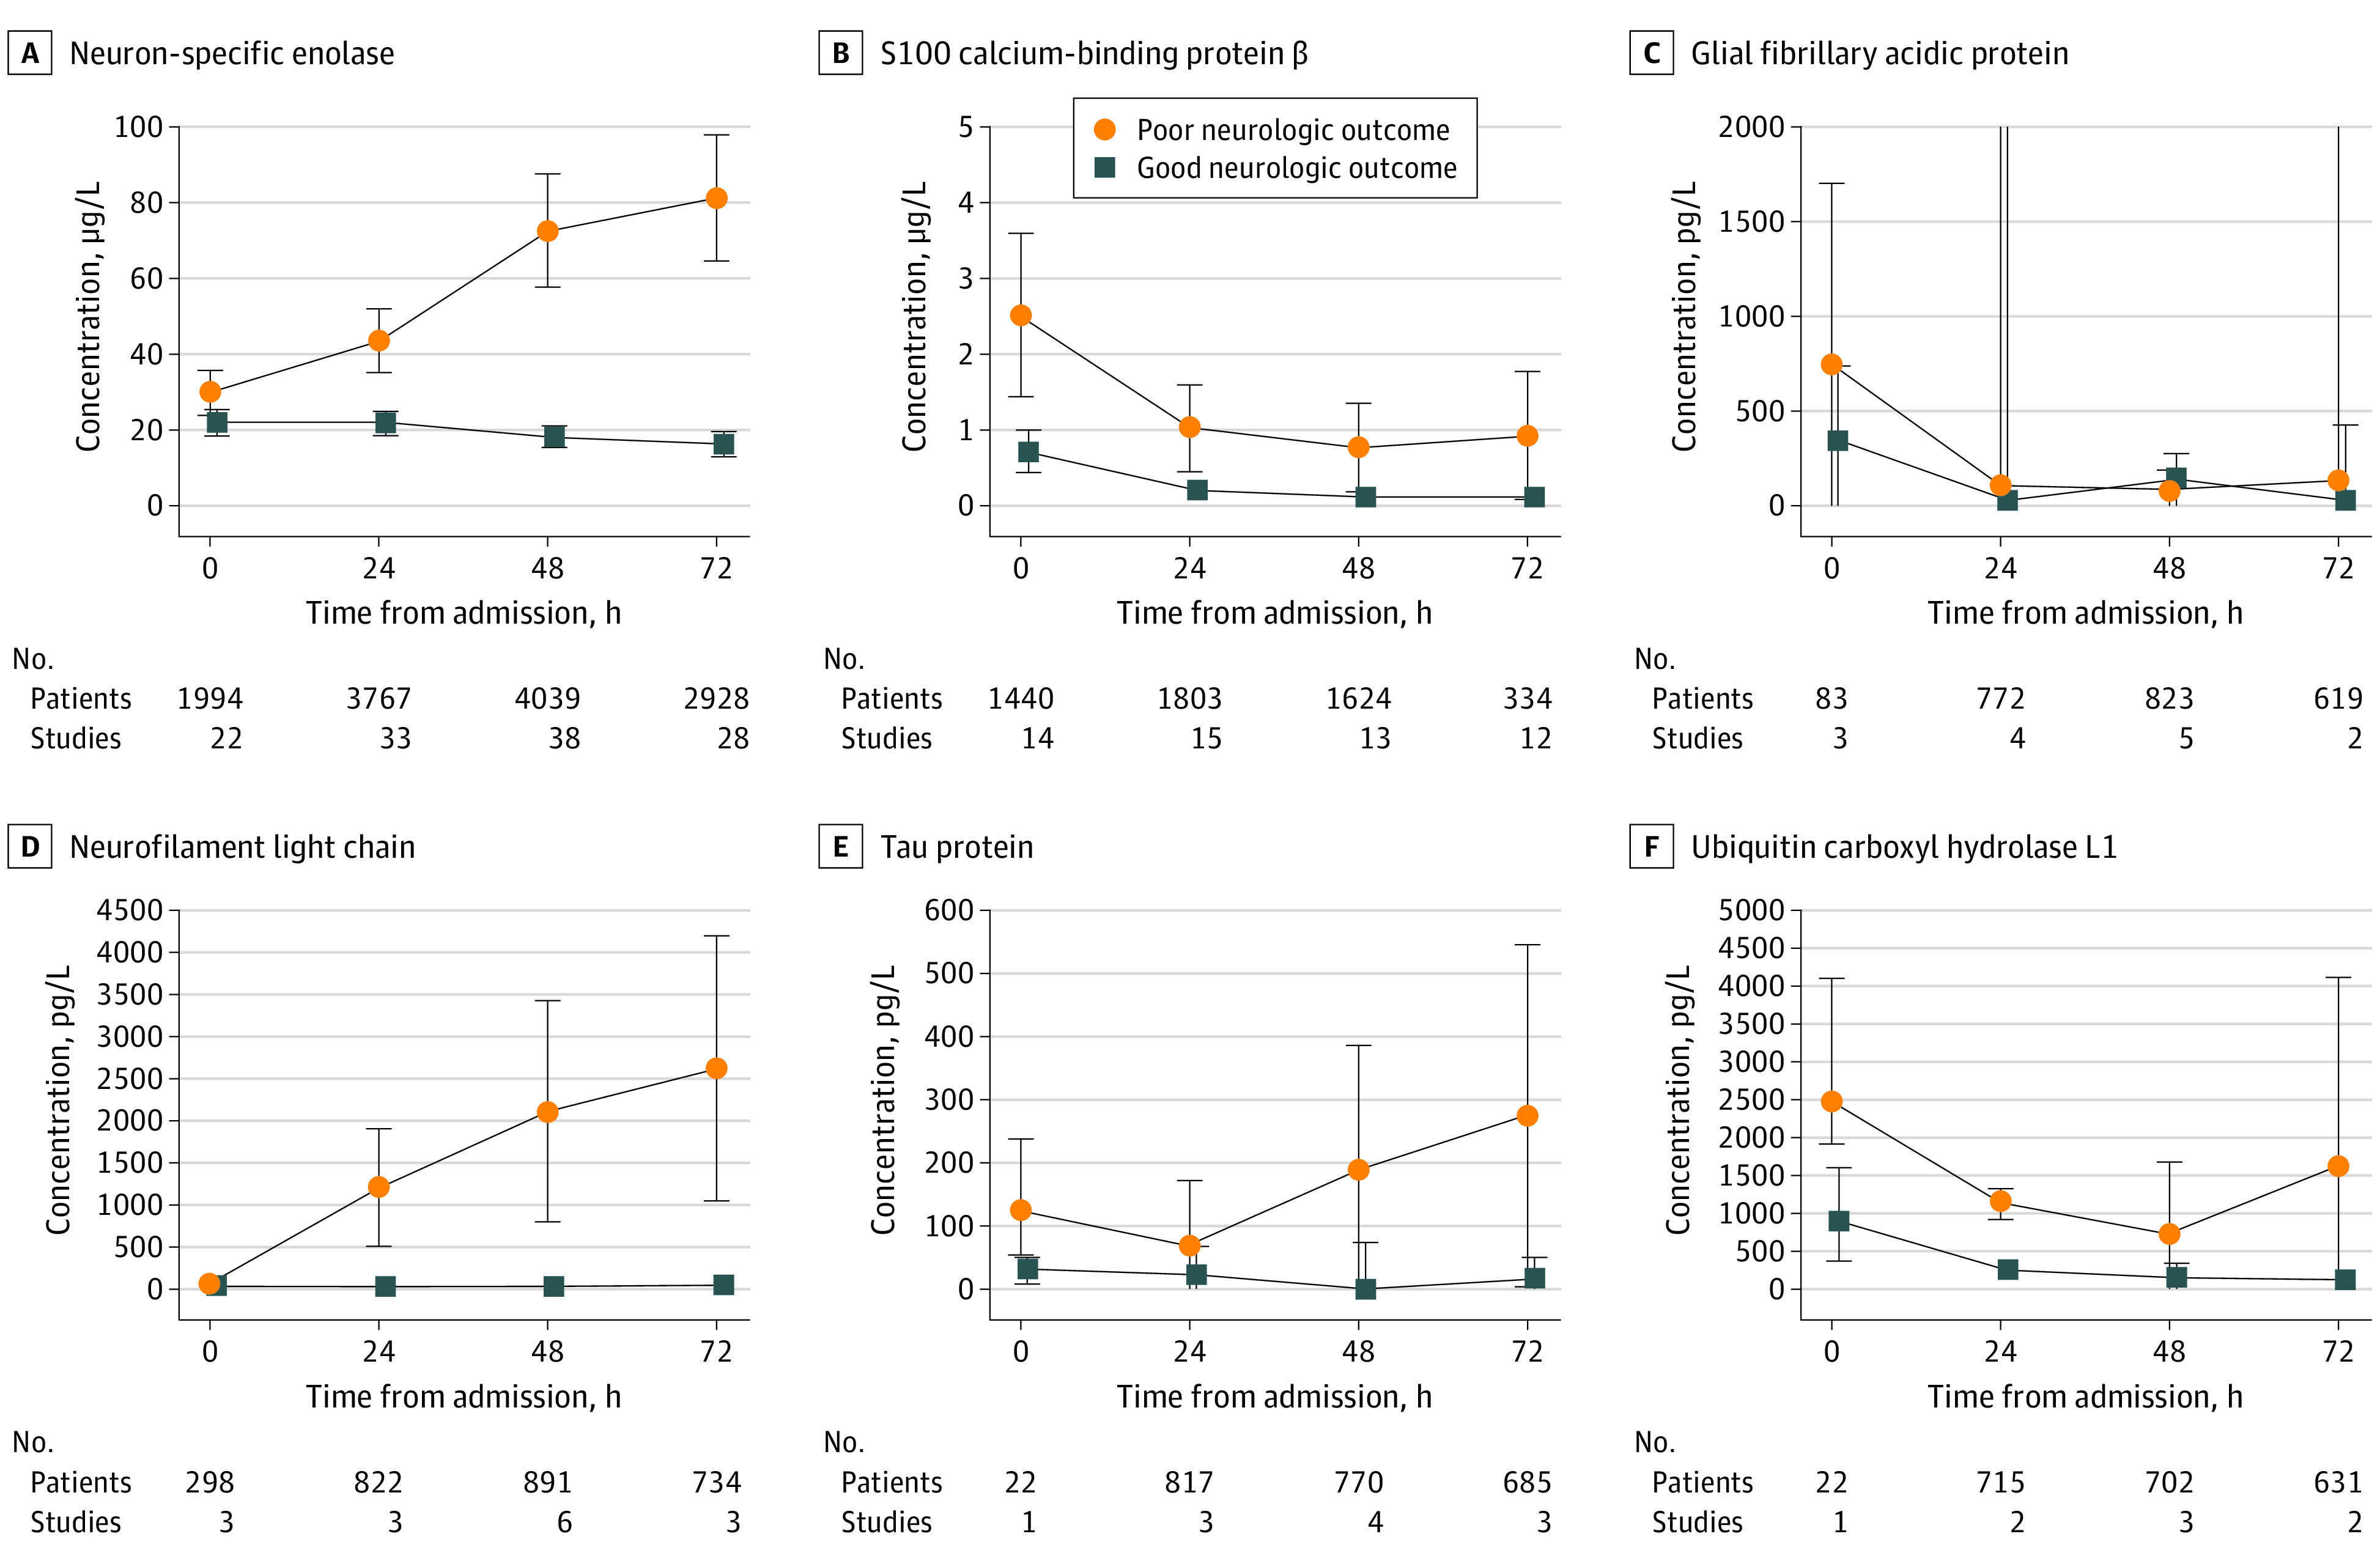
Results: We identified 2953 studies, of which 86 studies with 10 567 patients (7777 men [73.6] and 2790 women [26.4]; pooled mean [SD] age, 62.8 [10.2] years) were included. Biomarker analysis at 48 hours after ROSC demonstrated that neurofilament light had the highest predictive value for unfavorable neurologic outcome, with an area under the curve of 0.92 (95% CI, 0.84-0.97). Subgroup analyses of patients treated with targeted temperature management and those who specifically had an out-of-hospital cardiac arrest showed similar results (targeted temperature management, 0.92 [95% CI, 0.86-0.95] and out-of-hospital cardiac arrest, 0.93 [95% CI, 0.86-0.97]).

Conclusions and relevance: Neurofilament light, which reflects white matter damage and axonal injury, yielded the highest accuracy in predicting neurologic outcome in patients with HIBI at 48 hours after ROSC.

Trial registration: PROSPERO Identifier: CRD42020157366.


Conflict of interest statement

Conflict of Interest Disclosures: Dr Fordyce reported receiving grants from Bayer and personal fees from Bayer, Novo Nordisk, Boehringer Ingelheim, Sanofi, Amgen, and Novartis outside the submitted work. Dr Skrifvars reported receiving speaker fees and travel grants from Bard Medical (Ireland) outside the submitted work. Dr Sekhon reported receiving the Michael Smith Foundation for Health Research Health Professional Investigator award, Vancouver Coastal Health Research Institute Clinician Scientist award, and grant support from the Canadian Institute for Health Research. Dr Wellington reported receiving grants from the Canadian Institute for Health Research during the conduct of the study. Dr Griesdale is supported by the Michael Smith Foundation for Health Research Health Professional Investigator award. Dr Hoiland is funded by a Michael Smith Foundation for Health Research Trainee Fellowship, Craig H. Neilsen Foundation Post-Doctoral Fellowship, and the Darin Daniel Green Memorial Scholarship. No other disclosures were reported.

Figures

Figure 1.
Figure 1.. Preferred Reporting Items for Systematic Reviews and Meta-analyses Flow Diagram
This figure depicts the search strategy, records identified, as well as article exclusion following screening for eligibility.
Figure 2.
Figure 2.. Receiver Operating Characteristic Curves for the Diagnostic Accuracy of Brain Biomarkers for Predicting Unfavorable Outcome
Summary receiver operating characteristic (SROC) curves and their confidence intervals for each biomarker at 48 hours following return of spontaneous circulation are presented. Each individual dot represents a unique study. We estimated optimal thresholds for each biomarker for particular weights of specificity. We weighted specificity at 75% (orange dots), 80% (gray dots), and 85% (blue dots) with sensitivity weighted 25%, 20%, and 15%, respectively. For each weight of specificity, an optimal threshold on the SROC curve was calculated and is reported in the figure for each variable. The SROC area under the curve for each biomarker are neuron-specific enolase, 0.84 (95% CI, 0.77-0.91); S100 calcium binding protein β, 0.85 (95% CI, 0.76-0.92); glial fibrillary acidic protein, 0.77 (95% CI, 0.59-0.91); neurofilament light chain, 0.92 (95% CI, 0.84-0.97); tau, 0.89 (95% CI, 0.71-0.97); and ubiquitin carboxyl hydrolase L1, 0.88 (95% CI, 0.52-0.99). Concentration threshold and corresponding sensitivity to achieve 95% and 100% specificity for each biomarker are presented in eTable 3 in the Supplement. λSp indicates the weighting of specificity at either 75%, 80%, or 85% (see statistical analysis for details); AUC, area under the curve; Se, sensitivity; SP, specificity.
Figure 3.
Figure 3.. Group Differences in Brain Biomarkers Between Patients With Favorable and Unfavorable Neurologic Outcome
The median concentration and spread (IQR) are reported in patients with good (blue squares) and poor (orange circles) outcome at 0, 24, 48, and 72 hours following admission. The number of patients and studies included in the determination of the median and interquartile range for each point is noted within each graph.
Figure 4.
Figure 4.. The Neurovascular Unit and Brain Injury Biomarker Release
The neurovascular unit represents the principal anatomical and functional unit of the brain parenchyma where complex interplay occurs among neurons, the cerebral microvasculature, and surrounding glial cells to maintain homeostasis. The microvasculature is composed of the blood-brain barrier, which is partially formed by adjoining projections from astrocytes. Surrounding neuron cell bodies give rise to myelinated axons, which conduct signal transduction and facilitate communication with distinct anatomical locations in the brain. Following return of spontaneous circulation, ischemia-reperfusion injury pathophysiology occurs, and widespread injury across the neurovascular unit is reflected in the release of brain injury biomarkers into the bloodstream, which is facilitated by blood-brain barrier breakdown. Biomarkers reflecting astrocyte injury include glial fibrillary acidic protein (GFAP) and serum 100 calcium-binding protein β (S100β). Neuron cell body injury is reflected by release of neuron-specific enolase (NSE) and ubiquitin carboxyl hydrolase L1 (UCH-L1). In addition, axonal injury is reflected by release of neurofilament light (Nf-L) and tau. As such, the relative concentrations of the various biomarkers seen in the bloodstream can allude to signatures of damage to the neurovascular unit and its specific components.

Similar articles

Cited by

References

    1. Lemiale V, Dumas F, Mongardon N, et al. . Intensive care unit mortality after cardiac arrest: the relative contribution of shock and brain injury in a large cohort. Intensive Care Med. 2013;39(11):1972-1980. doi:10.1007/s00134-013-3043-4 - DOI - PubMed
    1. Laver S, Farrow C, Turner D, Nolan J. Mode of death after admission to an intensive care unit following cardiac arrest. Intensive Care Med. 2004;30(11):2126-2128. doi:10.1007/s00134-004-2425-z - DOI - PubMed
    1. Yan S, Gan Y, Jiang N, et al. . The global survival rate among adult out-of-hospital cardiac arrest patients who received cardiopulmonary resuscitation: a systematic review and meta-analysis. Crit Care. 2020;24(1):61. doi:10.1186/s13054-020-2773-2 - DOI - PMC - PubMed
    1. Andersen LW, Holmberg MJ, Berg KM, Donnino MW, Granfeldt A. In-hospital cardiac arrest: a review. JAMA. 2019;321(12):1200-1210. doi:10.1001/jama.2019.1696 - DOI - PMC - PubMed
    1. Graf J, Mühlhoff C, Doig GS, et al. . Health care costs, long-term survival, and quality of life following intensive care unit admission after cardiac arrest. Crit Care. 2008;12(4):R92. doi:10.1186/cc6963 - DOI - PMC - PubMed