. 2022 May 12;139(19):2983-2997.
doi: 10.1182/blood.2021014557.

BET-bromodomain and EZH2 inhibitor-treated chronic GVHD mice have blunted germinal centers with distinct transcriptomes

Affiliations

BET-bromodomain and EZH2 inhibitor-treated chronic GVHD mice have blunted germinal centers with distinct transcriptomes

Michael C Zaiken et al. Blood. .

Erratum in

Abstract

Despite advances in the field, chronic graft-versus-host-disease (cGVHD) remains a leading cause of morbidity and mortality following allogenic hematopoietic stem cell transplant. Because treatment options remain limited, we tested efficacy of anticancer, chromatin-modifying enzyme inhibitors in a clinically relevant murine model of cGVHD with bronchiolitis obliterans (BO). We observed that the novel enhancer of zeste homolog 2 (EZH2) inhibitor JQ5 and the BET-bromodomain inhibitor JQ1 each improved pulmonary function; impaired the germinal center (GC) reaction, a prerequisite in cGVHD/BO pathogenesis; and JQ5 reduced EZH2-mediated H3K27me3 in donor T cells. Using conditional EZH2 knockout donor cells, we demonstrated that EZH2 is obligatory for the initiation of cGVHD/BO. In a sclerodermatous cGVHD model, JQ5 reduced the severity of cutaneous lesions. To determine how the 2 drugs could lead to the same physiological improvements while targeting unique epigenetic processes, we analyzed the transcriptomes of splenic GCB cells (GCBs) from transplanted mice treated with either drug. Multiple inflammatory and signaling pathways enriched in cGVHD/BO GCBs were reduced by each drug. GCBs from JQ5- but not JQ1-treated mice were enriched for proproliferative pathways also seen in GCBs from bone marrow-only transplanted mice, likely reflecting their underlying biology in the unperturbed state. In conjunction with in vivo data, these insights led us to conclude that epigenetic targeting of the GC is a viable clinical approach for the treatment of cGVHD, and that the EZH2 inhibitor JQ5 and the BET-bromodomain inhibitor JQ1 demonstrated clinical potential for EZH2i and BETi in patients with cGVHD/BO.


Figures

None
Graphical abstract
Figure 1.
Figure 1.
JQ5 and JQ1 treat murine cGVHD/BO. Results are from BO cGVHD transplants. B10.BR mice were conditioned with 120 mg/kg Cytoxan (cyclophosphamide) (days −3, −2) and 7.6 Gy total body irradiation (TBI) (day −1). On day 0, recipients received 10 × 106 purified BM cells ± 73.5 × 10³ B6 purified T cells from C57BL/6. Groups included a BM-only negative control, a WT BM and T-cell–positive control, and mice that were given each treatment either JQ5 (75 mg/kg 3×/wk) or JQ1 (50 mg/kg 3× per week) from day 28 to day 49 posttransplant. Results shown are pooled from 3 transplant replicates. Results of pulmonary function tests taken on day 49 posttransplant include measures of resistance, elastance, and compliance. Significant improvement in pulmonary function across multiple parameters was observed with both JQ5 (A; n = 22/BM-only, n = 17/cGVHD, n = 15/JQ5) and JQ1 (B; n = 18/BM-only, n = 20/cGVHD, n = 18/JQ1) treatment. Representative images of cryopreserved lung sections from mice 49 days posttransplant. (C-D) Sections were stained with Masson trichrome and analyzed for collagen deposition. Quantification of the trichrome positive area is in the furthest right panel. This deposition is significantly reduced in both the JQ5-treated mice (C; n = 8/BM-only, n = 11/cGVHD, n = 8/JQ5) and the JQ1 treated mice (D; n = 7/BM-only, n = 8/cGVHD, n = 8/JQ1). (E-F) Sections were stained with anti IgG FITC and DAPI and show a reduction of IgG+ tissue in both JQ5-treated mice (E; n = 5/BM-only, n = 5/cGVHD, n = 4/JQ5) and the JQ1-treated mice (F; n = 5/BM-only, n = 5/cGVHD, n = 4/JQ1). Quantification of FITC+ area is shown in panels furthest to the right. All images are at ×200 magnification. Statistics shown are results of an unpaired t test with Bonferroni corrected P values when appropriate. *P < .05, **P < .01, ***P < .001, ****P < .0001.
Figure 1.
Figure 1.
JQ5 and JQ1 treat murine cGVHD/BO. Results are from BO cGVHD transplants. B10.BR mice were conditioned with 120 mg/kg Cytoxan (cyclophosphamide) (days −3, −2) and 7.6 Gy total body irradiation (TBI) (day −1). On day 0, recipients received 10 × 106 purified BM cells ± 73.5 × 10³ B6 purified T cells from C57BL/6. Groups included a BM-only negative control, a WT BM and T-cell–positive control, and mice that were given each treatment either JQ5 (75 mg/kg 3×/wk) or JQ1 (50 mg/kg 3× per week) from day 28 to day 49 posttransplant. Results shown are pooled from 3 transplant replicates. Results of pulmonary function tests taken on day 49 posttransplant include measures of resistance, elastance, and compliance. Significant improvement in pulmonary function across multiple parameters was observed with both JQ5 (A; n = 22/BM-only, n = 17/cGVHD, n = 15/JQ5) and JQ1 (B; n = 18/BM-only, n = 20/cGVHD, n = 18/JQ1) treatment. Representative images of cryopreserved lung sections from mice 49 days posttransplant. (C-D) Sections were stained with Masson trichrome and analyzed for collagen deposition. Quantification of the trichrome positive area is in the furthest right panel. This deposition is significantly reduced in both the JQ5-treated mice (C; n = 8/BM-only, n = 11/cGVHD, n = 8/JQ5) and the JQ1 treated mice (D; n = 7/BM-only, n = 8/cGVHD, n = 8/JQ1). (E-F) Sections were stained with anti IgG FITC and DAPI and show a reduction of IgG+ tissue in both JQ5-treated mice (E; n = 5/BM-only, n = 5/cGVHD, n = 4/JQ5) and the JQ1-treated mice (F; n = 5/BM-only, n = 5/cGVHD, n = 4/JQ1). Quantification of FITC+ area is shown in panels furthest to the right. All images are at ×200 magnification. Statistics shown are results of an unpaired t test with Bonferroni corrected P values when appropriate. *P < .05, **P < .01, ***P < .001, ****P < .0001.
Figure 2.
Figure 2.
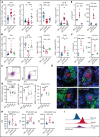
JQ1 and JQ5 impair the GC reaction in murine cGVHD/BO mice. (A-I) Transplants were performed as in Figure 1; groups are as defined in Figure 1. Results shown are pooled from 3 transplant replicates. (A-C) Flow cytometry analysis of mouse splenocytes taken 49 days posttransplant. TFH frequency is defined as % CXCR5+, PD1+ of FoxP3, CD4+ live splenocytes. TFRs are the CXCR5+, PD1+ percentage of FoxP3+, CD4+ live splenocytes. The TFR/TFH ratio is shown. GCBs are GL7+, FAShi percentage of the CD19+ live splenocytes. (A) JQ5 treatment resulted in a significant decrease in TFH and GCB frequencies and increase in TFR frequency and the TFR/TFH ratio (n = 23/BM-only, n = 18/cGVHD, n = 15/JQ5). (B) Similar results are shown for each population with JQ1 treatment, consistent with reduced GC reaction (n = 14/BM-only, n = 11/cGVHD, n = 7/JQ1). (C) Representative gating for (left) TFH and TFR cells and (right) GCB cells. BM-only contours are in blue, cGVHD contours are in red. (D) Representative images of cryopreserved spleen sections stained to show GCs from mice 49 days posttransplant. Sections are stained with DAPI (blue), peanut agglutinin (PNA) rhodamine (red), and CD4 FITC (green). Images are at ×200 magnification. (E-F) (Left) Number of GCs observed in each spleen section normalized for the area of spleen in each section. A GC was counted if it was a roughly circular region of PNA+ cells near a region of CD4+ cells. Right: quantification of the average size of GCs observed in each section. The GC size was determined as the area of the PNA+ region. For both JQ5 (E; n = 8/BM-only, n = 6/cGVHD, n = 5/JQ5) and JQ1 (F; n = 5/group), there was a significant reduction in both GC count and average size. (G) Flow cytometric analysis of single-cell lung suspensions taken from transplanted mice treated with each drug (n = 5/group). Left: total plasma cells are CD138+ lymphocytes, (center) immature plasma cells are B220+, CD19+ plasma cells, and (right) mature plasma cells are B220, CD19 plasma cells. Results show that both drugs significantly reduced the proportion of mature plasma cells in subject lungs. (H) Mean fluorescence intensity (MFI) quantification of flow cytometry analysis of H3K27me3 content of GC cell populations gated as in panel C (n per group as in panel A). (I) Representative histograms of GCB cells H3K27me3 content for BM-only, cGVHD, and JQ5-treated mouse-derived cells. For all panels, statistics shown are results of an unpaired t test with Bonferroni corrected P values, where appropriate. *P < .05, **P < .01, ***P < .001, ****P < .0001.
Figure 3.
Figure 3.
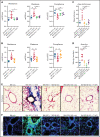
EZH2 expression in both donor T cells and B cells is necessary for cGVHD/BO. (A-D) Mice were transplanted as in Figure 1. Groups shown are defined by the contents of the graft given on day 0. BM (EZH2 KO) refers to T-cell-depleted BM from B6 EZH2 fl/fl CD19-Cre mice. T (EZH2 KO) refers to purified T cells from B6 EZH2 fl/fl CD4 Cre mice. Results shown are pooled from 2 transplant replicates. (A-B) Results of pulmonary function tests on mice 49 days posttransplant show significant improvement in pulmonary function if (A) BM or (B) T cells are obtained from EZH2 KO donors (n = 7/BM-only, n = 9/cGVHD, n = 7/BM [EZH2 KO] only, n = 9/BM [EZH2 KO] + T [WT], n = 6/BM [WT] + T [EZH2 KO]). (C,E) Representative images of cryopreserved lung sections from mice 49 days posttransplant (n = 4/BM-only, n = 6/cGVHD, n = 4/BM [EZH2 KO] only, n = 8/BM [EZH2 KO] + T [WT], n = 5/BM [WT] + T [EZH2 KO]). Sections were stained with Masson trichrome and analyzed for collagen deposition, which is significantly reduced in recipients of T cells or BM from EZH2 KO donors. (D,F) Representative images of cryopreserved lung sections from mice 49 days posttransplant (n = 5/BM-only, n = 8/cGVHD, n = 4/BM [EZH2 KO] only, n = 6/BM [EZH2 KO] + T [WT], n = BM [WT] + T [EZH2 KO]). Sections were stained with anti-IgG FITC and DAPI and show reduction of IgG+ tissue in both the EZH2 KO T cell and EZH2 KO BM transplanted samples. Quantification of FITC+ area is shown in panel C. All images are at ×200 magnification. Quantification of trichrome-positive area is shown in the left panel of D. Statistics shown are results of an unpaired t test with Bonferroni corrected P values when appropriate. *P < .05, **P < .01, ***P < .001, ****P < .0001. KO, knockout.
Figure 4.
Figure 4.
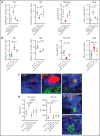
In BO cGVHD EZH2 is necessary for the GC reaction. (A-D) Transplants were performed as in Figure 1; groups are as defined in Figure 3. (A-B) Flow cytometry analysis of mouse splenocytes taken 49 days posttransplant. Cell populations for flow cytometry analysis are as defined in Figure 2. Results show that when EZH2 is knocked out in both the BM compartment (A) (n = 4/group) and T-cell compartment (B) (n = 14/BM-only, n = 13/cGVHD, n = 10/BM [WT] + T [EZH2 KO]) of the graft, there is a significant reduction in the TFH and GCB frequencies and a significant increase in the TFR/TFH ratio. (C) Representative images of cryopreserved spleen sections stained to show GCs from mice 49 days posttransplant. Sections are stained with DAPI (blue), PNA rhodamine (red), and CD4 FITC (green). Images are ×200 magnification. (D) Left panel shows the number of GCs observed in each spleen section normalized for the area of spleen in each section. Right panel is a quantification of the average size of GCs observed in each section. GCs were identified and quantified as in Figure 2. Quantification shows when EZH2 is knocked out in either the BM and T-cell compartments, there is a comparable reduction in both the GC count and average size. N = 8/BM-only, n = 6/cGVHD, n = 5/BM (EZH2 KO) only, n = 4/BM (EZH2 KO) + T (WT), n = 4/BM (WT) + T (EZH2 KO). For all panels, statistics shown are results of an unpaired t test with Bonferroni corrected P values, where appropriate. *P < .05, **P < .01, ***P < .001, ****P < .0001.
Figure 5.
Figure 5.
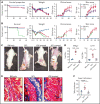
Treatment with JQ5, but not JQ1, can treat sclerodermatous cGVHD. (A-C) BALB/c mice were given TBI (700 cGy on day −1) followed by infusion of 107 B10.D2 BM ± 1.8 × 10⁶ CD4 and 0.9 × 10⁶ CD8 T cells (day 0). JQ5- and JQ1-treated mice received treatment as in Figure 1 from days 20 to 45 posttransplant, n = 25/group. (A-B) From left to right, graphs show impact of JQ5 treatment on recipient survival, mean weights, clinical scores, and skin scores. Arrows on clinical and skin score plots indicate time of treatment initiation. (A) Although JQ5 did not significantly improve either weights or survival proportion, treated mice showed significantly reduced clinical scores, and skin scores as early as 10 days after initial treatment. (B) JQ1 treatment shows evidence of toxicity within 7 days of beginning therapy with no mice surviving beyond 2 weeks after treatment initiation. (C) Representative images of sclerodermatous mice with or without treatment with each drug. Images taken 45 days posttransplant, except for JQ1-treated mouse, where image was taken 34 days posttransplant. (D) Flow cytometry analysis of cytokine production from transplanted mouse lymph nodes shows a significant reduction in inflammatory cytokine production with JQ5 treatment, indicative of reduced disease, n = 5 per group. (E) Representative images of cryopreserved skin cross sections from mice 45 days posttransplant. Sections were stained with Masson trichrome. Images are ×200 magnification. (F) Quantification of trichrome+ area of skin cross sections in panel C shows a significant reduction in trichrome-positive area with JQ5 treatment, n = 4 per group. This correlates to a reduction in skin collagen deposition with treatment. *P < .05, **P < .01, ***P < .001, ****P < .0001.
Figure 6.
Figure 6.
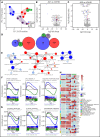
JQ5 and JQ1 impair GCB cells through distinct transcriptomic signatures. All results from analysis of sorted GCBs collected ∼49 days posttransplant in cGVHD/BO B6→B10.BR model. Four samples in each group are used for analysis; samples were chosen to be most representative of each treatment condition by pulmonary function test results. (A) Principal component analysis (PCA) of top 4 samples in each treatment condition, calculated with top 500 most variable genes. Treatment condition variation along the top 2 PCAs explains ∼48% of variance within the dataset. All groups cluster independently. (B-C) Volcano plot of differentially expressed genes in either (A) JQ1- or (B) JQ5-treated samples against vehicle-treated (cGVHD) samples. Differentially expressed genes called as having an adjusted value of P <.05, and a log2 fold change greater than 0.15. Twenty-four genes were differentially increased and 16 were reduced with JQ1, and 8 genes were differentially increased and 19 were reduced with JQ5. (D) Euler plots of overlapping differentially expressed genes in each of the 4 treatment conditions. Left plot is upregulated genes, whereas right is downregulated genes. (E) Gene set enrichment analysis (GSEA) network mapping of MsigDB hallmark gene sets in BM-only vs cGVHD comparison. Red nodes were increased with cGVHD vs BM-only samples, blue nodes were decreased. (F-G) Individual enrichment barcode plots for (F, left to right) MTORC1 signaling, Myc targets V1, oxidative phosphorylation; (G; left to right) allograft rejection, IL2-STAT5 signaling, and inflammatory response hallmark gene sets. On all plots, genes enriched in the treatment condition are on the left, whereas genes enriched in cGVHD are on the right. Gene sets in panel E JQ5 and JQ1 impacted enrichment differently, gene sets in panel F sets were enriched comparably. (H) Heatmap of high variance genes in major GSEA nodes described in panel D. Colors are blue for BM only, red for cGVHD, purple for JQ5 treated, and green for JQ1 treated (A,C,F-G).

Comment in

References

    1. Greinix HT. Chronic GVHD: progress in salvage treatment? Blood. 2017;130(21):2237-2238. - PubMed
    1. Flowers MED, Parker PM, Johnston LJ, et al. Comparison of chronic graft-versus-host disease after transplantation of peripheral blood stem cells versus bone marrow in allogeneic recipients: long-term follow-up of a randomized trial. Blood. 2002;100(2):415-419. - PubMed
    1. Lee SJ. Have we made progress in the management of chronic graft-vs-host disease? Best Pract Res Clin Haematol. 2010;23(4):529-535. - PMC - PubMed
    1. Socié G, Stone JV, Wingard JR, et al. ; Late Effects Working Committee of the International Bone Marrow Transplant Registry . Long-term survival and late deaths after allogeneic bone marrow transplantation. N Engl J Med. 1999;341(1):14-21. - PubMed
    1. Lee SJ, Klein JP, Barrett AJ, et al. Severity of chronic graft-versus-host disease: association with treatment-related mortality and relapse. Blood. 2002;100(2):406-414. - PubMed

Publication types

MeSH terms

Substances