

Molecular phylogeography and species distribution modelling evidence of 'oceanic' adaptation for Actinidia eriantha with a refugium along the oceanic-continental gradient in a biodiversity hotspot
- PMID: 35227218
- PMCID: PMC8883688
- DOI: 10.1186/s12870-022-03464-5
Molecular phylogeography and species distribution modelling evidence of 'oceanic' adaptation for Actinidia eriantha with a refugium along the oceanic-continental gradient in a biodiversity hotspot
Abstract
Background: Refugia is considered to be critical for maintaining biodiversity; while discerning the type and pattern of refugia is pivotal for our understanding of evolutionary processes in the context of conservation. Interglacial and glacial refugia have been studied throughout subtropical China. However, studies on refugia along the oceanic-continental gradient have largely been ignored. We used a liana Actinidia eriantha, which occurs across the eastern moist evergreen broad-leaved forests of subtropical China, as a case study to test hypotheses of refugia along the oceanic-continental gradient and 'oceanic' adaptation.
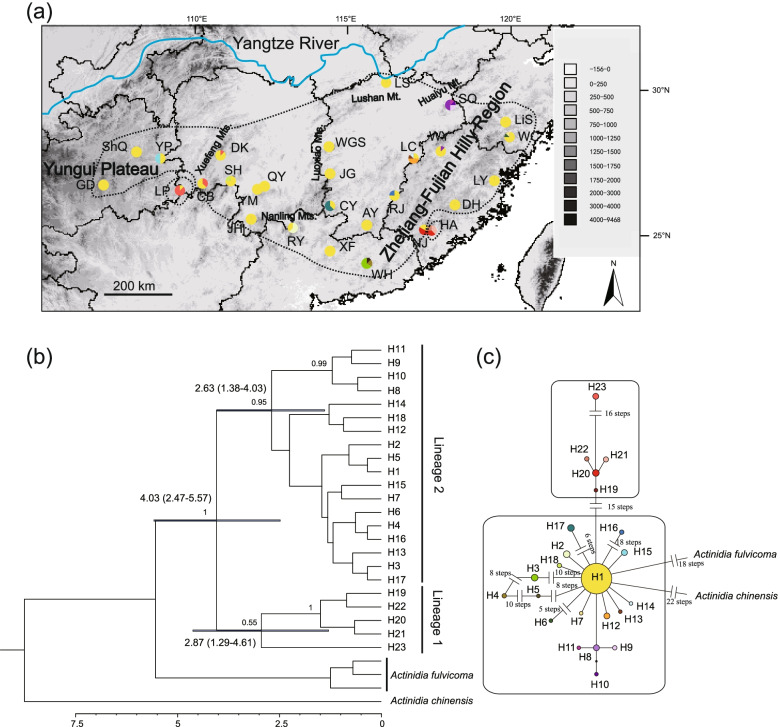
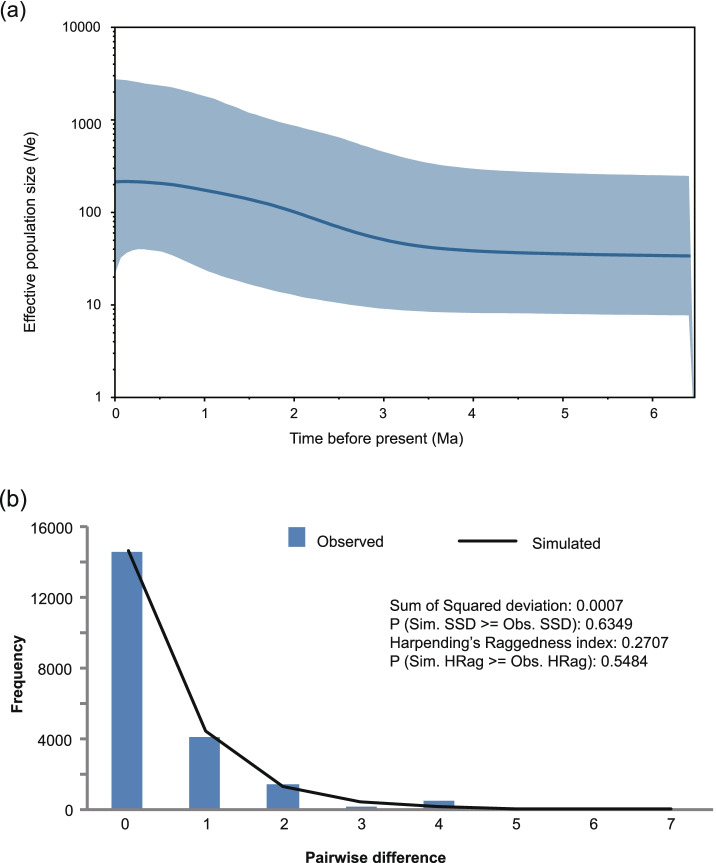
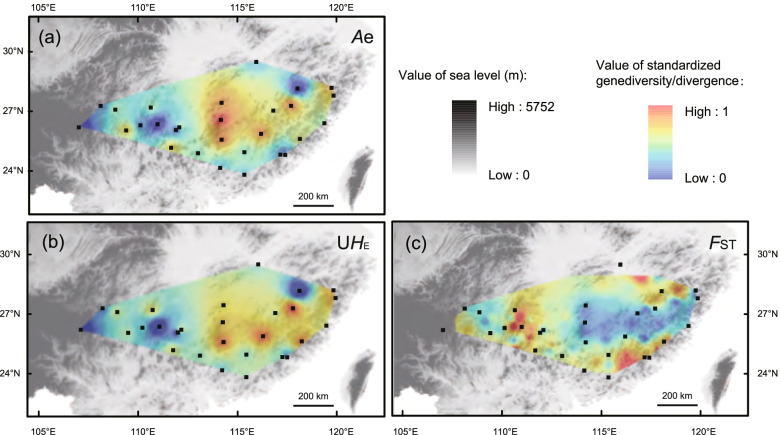
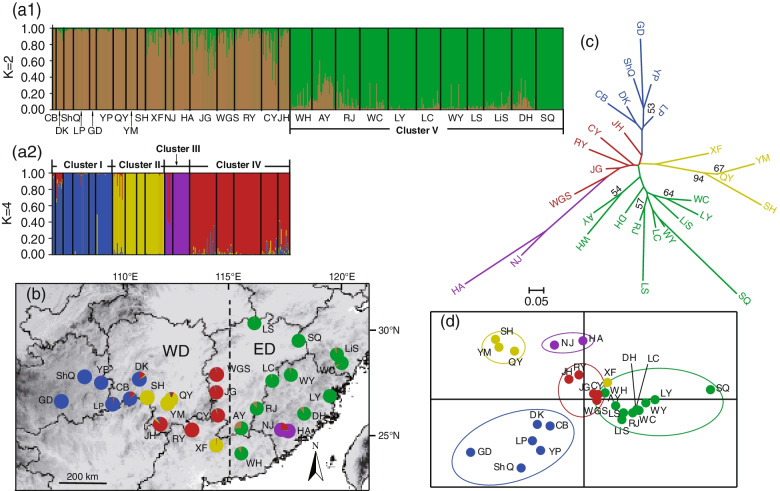
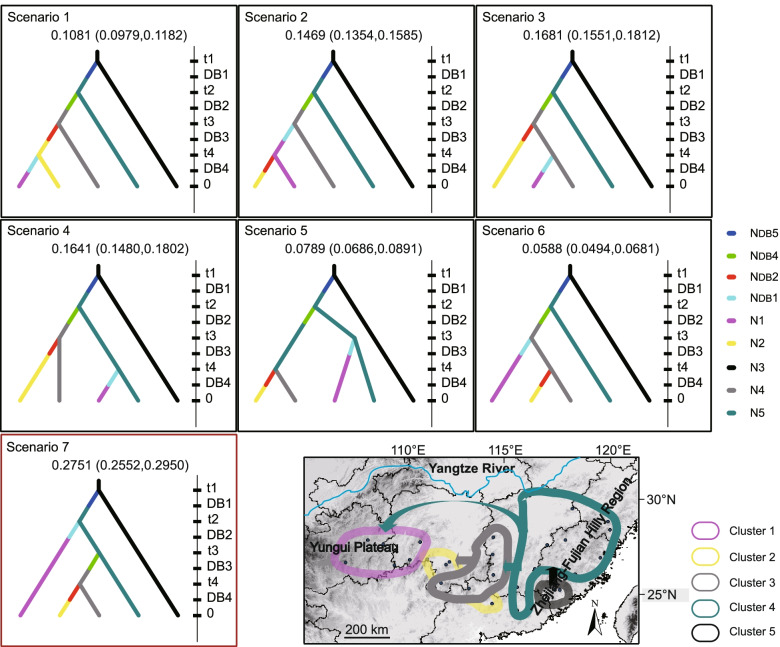
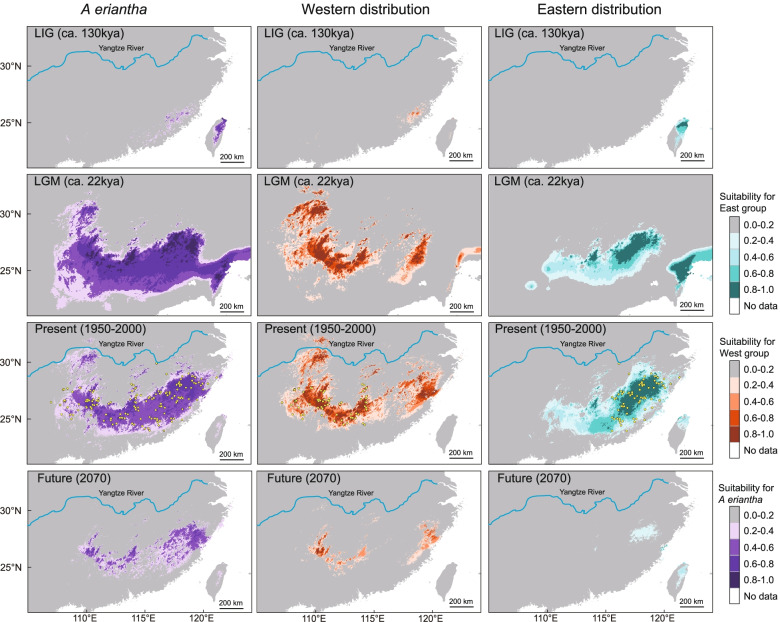
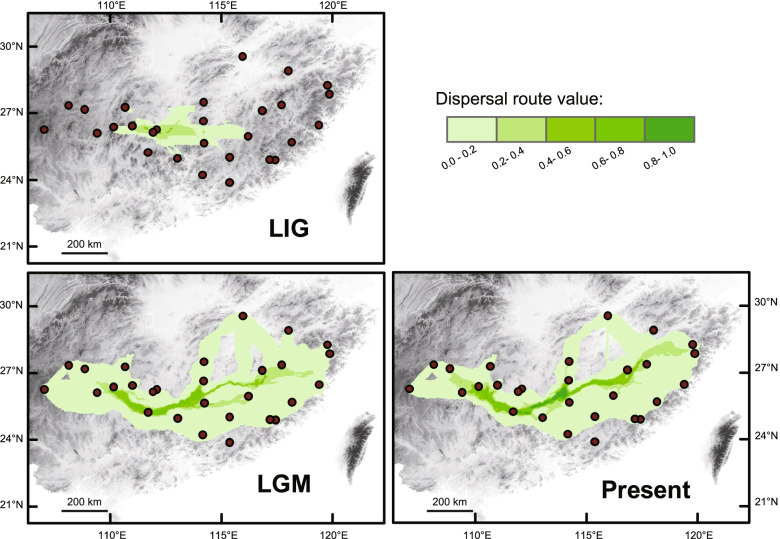
Results: The phylogeographic pattern of A. eriantha was explored using a combination of three cpDNA markers and 38 nuclear microsatellite loci, Species distribution modelling and dispersal corridors analysis. Our data showed intermediate levels of genetic diversity [haplotype diversity (hT) = 0.498; unbiased expected heterozygosity (UHE) = 0.510] both at the species and population level. Microsatellite loci revealed five clusters largely corresponding to geographic regions. Coalescent time of cpDNA lineages was dated to the middle Pliocene (ca. 4.03 Ma). Both geographic distance and climate difference have important roles for intraspecific divergence of the species. The Zhejiang-Fujian Hilly Region was demonstrated to be a refugium along the oceanic-continental gradient of the species and fit the 'refugia in refugia' pattern. Species distribution modelling analysis indicated that Precipitation of Coldest Quarter (importance of 44%), Temperature Seasonality (29%) and Mean Temperature of Wettest Quarter (25%) contributed the most to model development. By checking the isolines in the three climate layers, we found that A. eriantha prefer higher precipitation during the coldest quarter, lower seasonal temperature difference and lower mean temperature during the wettest quarter, which correspond to 'oceanic' adaptation. Actinidia eriantha expanded to its western distribution range along the dispersal corridor repeatedly during the glacial periods.
Conclusions: Overall, our results provide integrated evidence demonstrating that the Zhejiang-Fujian Hilly Region is a refugium along the oceanic-continental gradient of Actinidia eriantha in subtropical China and that speciation is attributed to 'oceanic' adaptation. This study gives a deeper understanding of the refugia in subtropical China and will contribute to the conservation and utilization of kiwifruit wild resources in the context of climate change.
Keywords: Actinidia eriantha; Climatic fluctuations; Oceanic–continental gradient; Phylogeography; Refugium; Subtropical China; ‘Oceanic’ adaptation.
© 2022. The Author(s).
Conflict of interest statement
The authors declare that they have no competing interests.
Figures
Similar articles
-
Phylogeography of Eomecon chionantha in subtropical China: the dual roles of the Nanling Mountains as a glacial refugium and a dispersal corridor.BMC Evol Biol. 2018 Feb 9;18(1):20. doi: 10.1186/s12862-017-1093-x. BMC Evol Biol. 2018. PMID: 29426277 Free PMC article.
-
Multiple glacial refugia for cool-temperate deciduous trees in northern East Asia: the Mongolian oak as a case study.Mol Ecol. 2015 Nov;24(22):5676-91. doi: 10.1111/mec.13408. Epub 2015 Oct 30. Mol Ecol. 2015. PMID: 26439083
-
Unravelling the evolutionary history and future prospects of endemic species restricted to former glacial refugia.Mol Ecol. 2015 Oct;24(20):5267-83. doi: 10.1111/mec.13379. Epub 2015 Oct 12. Mol Ecol. 2015. PMID: 26346923
-
Plant molecular phylogeography in China and adjacent regions: Tracing the genetic imprints of Quaternary climate and environmental change in the world's most diverse temperate flora.Mol Phylogenet Evol. 2011 Apr;59(1):225-44. doi: 10.1016/j.ympev.2011.01.012. Epub 2011 Feb 1. Mol Phylogenet Evol. 2011. PMID: 21292014 Review.
-
Between the Cape Fold Mountains and the deep blue sea: Comparative phylogeography of selected codistributed ectotherms reveals asynchronous cladogenesis.Evol Appl. 2022 Oct 27;15(12):1967-1987. doi: 10.1111/eva.13493. eCollection 2022 Dec. Evol Appl. 2022. PMID: 36540640 Free PMC article. Review.
Cited by
-
Deciphering the evolutionary imprints of Camellia oleifera Abel.: delineating its distinct phylogeographic structure and demographic history through microsatellite and plastid fragment.BMC Plant Biol. 2025 Apr 25;25(1):526. doi: 10.1186/s12870-025-06570-2. BMC Plant Biol. 2025. PMID: 40275177 Free PMC article.
-
Comparative analysis of the organelle genomes of three Rhodiola species provide insights into their structural dynamics and sequence divergences.BMC Plant Biol. 2023 Mar 22;23(1):156. doi: 10.1186/s12870-023-04159-1. BMC Plant Biol. 2023. PMID: 36944988 Free PMC article.
-
Phylogeographical patterns match the floristic subdivisions: the diversification history of a widespread herb in subtropical China.Ann Bot. 2024 Dec 31;134(7):1263-1276. doi: 10.1093/aob/mcae157. Ann Bot. 2024. PMID: 39230182
-
Phylogeographic analysis reveals extensive genetic variation of native grass Elymus nutans (Poaceae) on the Qinghai-Tibetan plateau.Front Plant Sci. 2024 Mar 11;15:1349641. doi: 10.3389/fpls.2024.1349641. eCollection 2024. Front Plant Sci. 2024. PMID: 38529066 Free PMC article.
-
The genomic and epigenetic footprint of local adaptation to variable climates in kiwifruit.Hortic Res. 2023 Feb 21;10(4):uhad031. doi: 10.1093/hr/uhad031. eCollection 2023 Apr. Hortic Res. 2023. PMID: 37799629 Free PMC article.
References
-
- Keppel G, Van Niel KP, Wardell-Johnson GW, Yates C, Byrne M, Mucina L, et al. Refugia: identifying and understanding safe havens for biodiversity under climate change. Glob Ecol Biogeogr. 2012;21:393–404.
-
- Heal B. The Arctic is an ecosystem. 2000.
-
- Avise JC. Phylogeography: the history and formation of species. Cambridge: Harvard University Press; 2000.
MeSH terms
Substances
LinkOut - more resources
Full Text Sources
