. 2022 Mar 1;14(1):24.
doi: 10.1186/s13073-022-01018-w.

DNA methylation reveals distinct cells of origin for pancreatic neuroendocrine carcinomas and pancreatic neuroendocrine tumors

Affiliations

DNA methylation reveals distinct cells of origin for pancreatic neuroendocrine carcinomas and pancreatic neuroendocrine tumors

Tincy Simon et al. Genome Med. .

Abstract

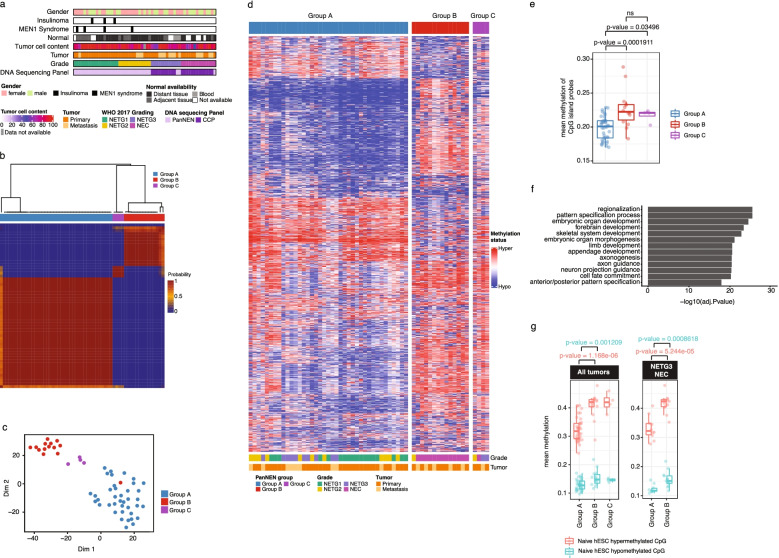
Background: Pancreatic neuroendocrine neoplasms (PanNENs) fall into two subclasses: the well-differentiated, low- to high-grade pancreatic neuroendocrine tumors (PanNETs), and the poorly-differentiated, high-grade pancreatic neuroendocrine carcinomas (PanNECs). While recent studies suggest an endocrine descent of PanNETs, the origin of PanNECs remains unknown.

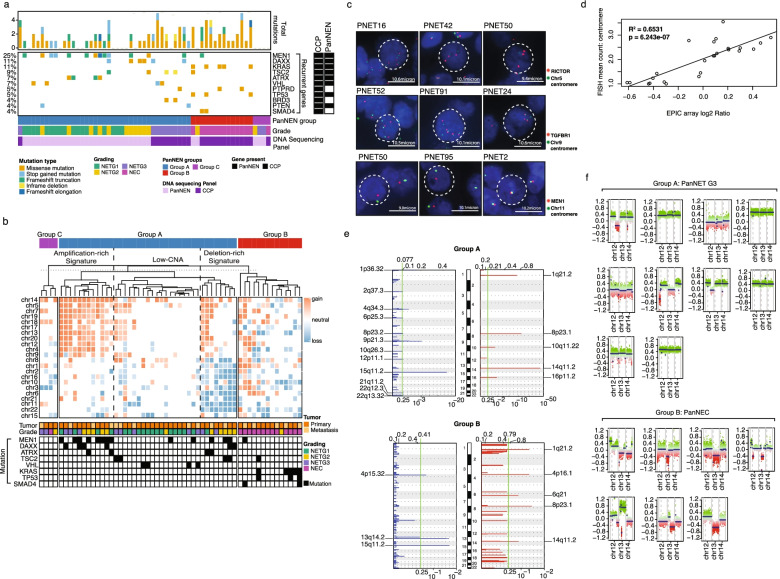
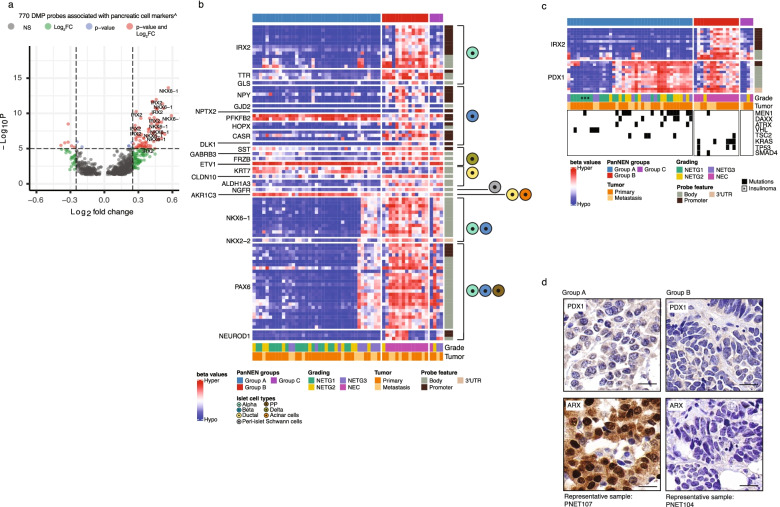
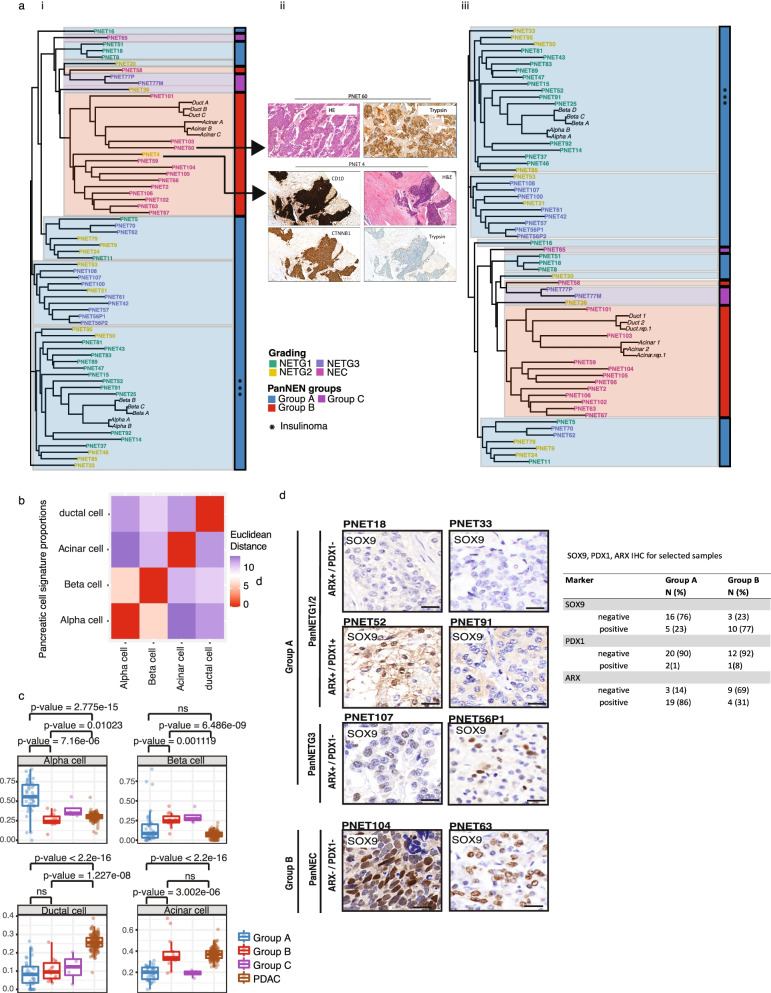
Methods: We performed DNA methylation analysis for 57 PanNEN samples and found that distinct methylation profiles separated PanNENs into two major groups, clearly distinguishing high-grade PanNECs from other PanNETs including high-grade NETG3. DNA alterations and immunohistochemistry of cell-type markers PDX1, ARX, and SOX9 were utilized to further characterize PanNECs and their cell of origin in the pancreas.

Results: Phylo-epigenetic and cell-type signature features derived from alpha, beta, acinar, and ductal adult cells suggest an exocrine cell of origin for PanNECs, thus separating them in cell lineage from other PanNENs of endocrine origin.

Conclusions: Our study provides a robust and clinically applicable method to clearly distinguish PanNECs from G3 PanNETs, improving patient stratification.

Keywords: Cell-of-origin; Epigenetics; Pancreatic neuroendocrine neoplasm.


Conflict of interest statement

DC has a patent pending: DNA methylation-based method for classifying tumor species (EP16710700.2). The remaining authors declare that they have no competing interests.

Figures

Fig. 1
Fig. 1
PanNENs subdivide into two main methylation groups. a Characterization of PanNEN cohort. WHO, World Health Organization; CCP, comprehensive cancer panel. b Unsupervised class discovery using 10,000 (10K) most variable methylation probes. Heatmap displays pairwise consensus values of the samples. c tSNE representation of PanNEN subgroups using 10K most variable probes. d. Heatmap displaying methylation status of 10K variable probes in each of the Groups A, B, and C. Methylation beta value was used to perform hierarchical clustering separately on each subgroup, identifying closely similar samples. Color range blue to red represents methylation beta value, columns indicate samples, and rows methylation probes. e Mean methylation of CpG island probes in PanNEN subgroups. Boxplot represents the distribution of mean methylation, each dot depicts a sample. f GO ontology analysis of 10K most variable probes, representing top 12 terms based on -Log10P-value. g Mean methylation of human Embryonic Stem Cells (hESC) associated hypermethylated and hypomethylated probes in PanNEN subgroups. Boxplot represents the distribution of hypermethylated (red) and hypomethylated (blue) CpG probes of hESC in cohort (left panel), or only in PanNETG3/ PanNEC samples from Group A and B respectively (right panel). Two-sample Wilcoxon test. Boxes show 25th and 75th percentiles and sample median as horizontal line, whiskers show maximum and minimum point
Fig. 2
Fig. 2
Genetic aberrations distinguish Group A and Group B. a Mutational landscape in PanNEN subgroups. Panel sequencing using in-house panel (PanNEN) and commercial cancer panel (CCP) Only genes mutated more than once are displayed here. Complete mutation profiles can be found in Additional file 2: Fig. S2b. Colors depict variant type (white spacing: no mutation identified). The DNA sequencing panel at the bottom depicts which targeted panel we used for the sample, while the ‘gene present’ annotation on the right side depicts whether the gene is present in the PanNEN panel or the CCP panel. Samples are sorted according to the PanNEN Groups; A, B and C. b Whole chromosomal aberrations in PanNEN subgroups. Hierarchical clustering of mean log2 ratios of chromosomal segments; dotted line represents cut-off used to identify amplification, low-CNA, and deletion-rich signatures; column annotation: tumor grade, tumor type and recurrently aberrated genes. c. Representative images of fluorescent in situ hybridization (FISH) validation. Red: gene probe. Green: centromere probe of chr5 (top panel), chr9 (middle panel), and chr11 (bottom panel). d Linear regression of mean copy number count of centromere derived from FISH (y-axis) and mean log2 ratios of chromosomal segments per autosome (x-axis); diagonal line: best fit model. R2 = 0.6531, p=6.232 × 10⁻⁷. e Focal aberrations in Group A (top panel) and Group B (bottom panel). Blue: focal copy number losses, red: focal copy number gain. Log2 ratio range at the top and q-value at the bottom of each graph. Green: q-value cut off at 0.25 to call significance. Significantly aberrated focal regions are identified. f Chromosome 12, 13, and 14 copy number status in NETG3 (top panel) and NEC (bottom panel). Intensity values of each bin are plotted in colored dots; each color indicates ‘methylated’ and ‘unmethylated’ channels of each CpG; segments are shown as horizontal blue lines
Fig. 3
Fig. 3
Cell marker analysis in PanNEN subgroups identifies endocrine features in Group A. a Differentially methylated probes (DMPs) associated with pancreatic cell markers (n=770 probes). Each point represents a DMP. Dotted line: intersect between -Log10 P value and the log2 fold change (FC) for a given probe. Cut-off for significance: -Log10 P-value > 5 (adjusted p-value: 10−6) and log2FC: >|0.25|. Red: probes passing both cut-offs; green: probes only passing the log2FC threshold; blue: probes with only have a significant p-value; gray: probes that did not pass any of the cut-offs; Significantly associated DMP probes of IRX2 and NKX6-1 are labeled. b Methylation beta value of significant DMPs of pancreatic cell markers. Heatmap displaying the methylation beta values of DMPs (row) in each sample (column). Pancreatic cell-types which the cell marker is associated with, according to PanglaoDB, are displayed on the right. c Methylation beta value of probes associated with IRX2 and PDX1. DMP probes of IRX2 and 10K probes associated with PDX1 (rows) for each sample. Lower panel depicts recurrently mutated genes. d Representative IHC of ARX and PDX1 in PanNEN subgroups. Scale bar: 20μm
Fig. 4
Fig. 4
Cell-of-origin analysis using normal cell type methylation profiles and SOX9 in PanNEN subgroups indicate exocrine lineage for Group B tumors. a (i) Phylo-epigenetic analysis of PanNEN tumors and normal pancreatic cell types. Pearson distance between the samples computed using differentially methylated CpGs between normal α-, β-, ductal and acinar cells (n = 46,500, adj. p value < 0.01 and |Δβ | > 0.2) and neighbor-joining tree estimation. (ii) IHC of outliers PNET4 and PNET 60, which were re-assessed and removed from phylo-epigenetic analysis (i). (iii) New phylo-epigenetic analysis without PNET4 and PNET60. b Euclidean distance between each cell type was computed and correlation matrix of the distances is displayed. Heatmap depicts the distance between a given normal cell-type pair. c Boxplot representing distribution of the proportion of atlas signatures of α-, β-, ductal and acinar cells (each main box) in the subgroups and PDACs; each dot depicts the proportion of atlas signatures of the respective cell type in a given sample. Two-sample Wilcoxon test. d IHC of SOX9. Representative images for each subgroup; scale bar: 20μm. Table depicts the total IHC score for Group A and Group B samples

References

    1. Taskin OC, et al. Pancreatic neuroendocrine neoplasms: current state and ongoing controversies on terminology, classification and prognostication. J Gastrointest Oncol. 2020;11:548. - PMC - PubMed
    1. Harris RE. Epidemiology of Chronic Disease: Global Perspectives. Jones & Bartlett Learning; 2019.
    1. Zhai H, et al. Pancreatic neuroendocrine tumours: Grade is superior to T, N, or M status in predicting outcome and selecting patients for chemotherapy:A retrospective cohort study in the SEER database. Int J Surg. 2019;66:103–109. - PubMed
    1. Lloyd RV, Osamura RY, Klöppel G, Rosai J. WHO Classification of Tumours of Endocrine Organs. International Agency for Research on Cancer; 2017.
    1. Zhang M-Y, He D, Zhang S. Pancreatic neuroendocrine tumors G3 and pancreatic neuroendocrine carcinomas: Differences in basic biology and treatment. World J Gastrointest Oncol. 2020;12:705. - PMC - PubMed