. 2022 Apr;21(4):100221.
doi: 10.1016/j.mcpro.2022.100221. Epub 2022 Feb 26.

Phosphoproteome Profiling of the Receptor Tyrosine Kinase MuSK Identifies Tyrosine Phosphorylation of Rab GTPases

Affiliations

Phosphoproteome Profiling of the Receptor Tyrosine Kinase MuSK Identifies Tyrosine Phosphorylation of Rab GTPases

Hanna G Budayeva et al. Mol Cell Proteomics. 2022 Apr.

Abstract

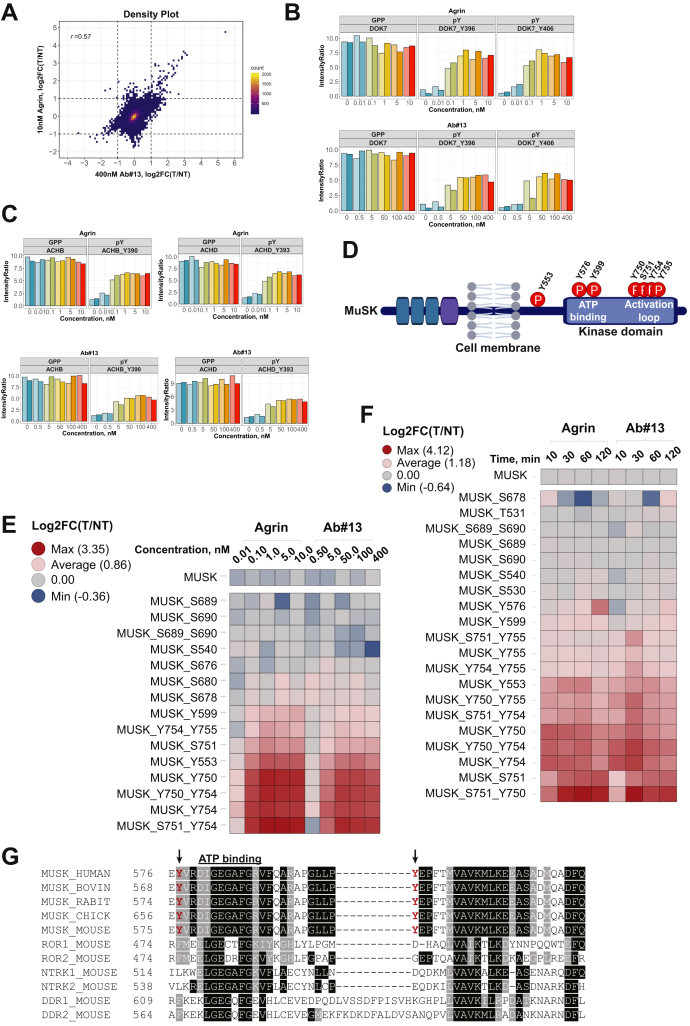
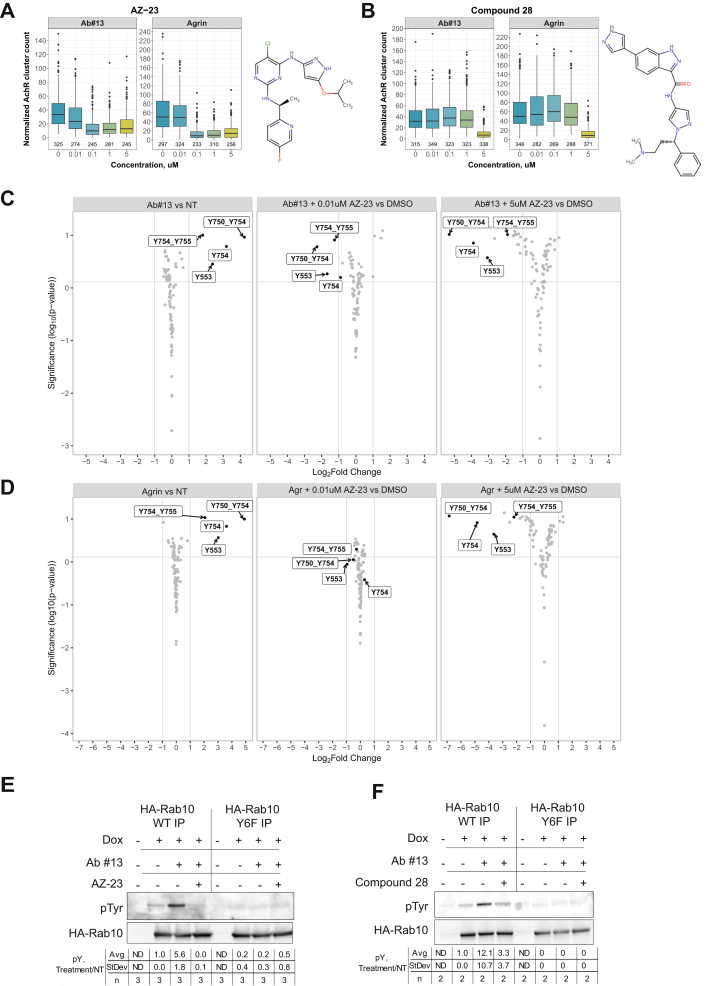
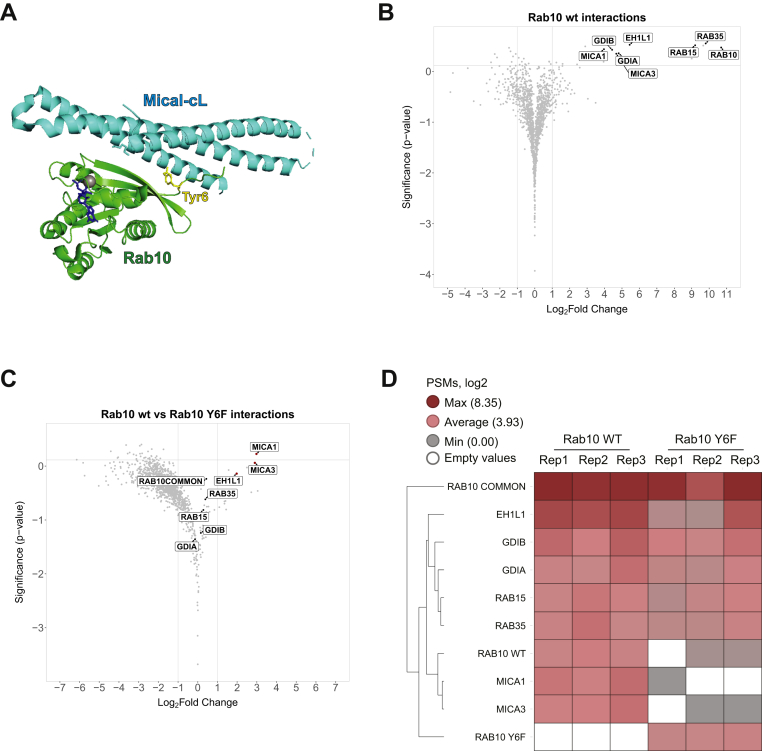
Muscle-specific receptor tyrosine kinase (MuSK) agonist antibodies were developed 2 decades ago to explore the benefits of receptor activation at the neuromuscular junction. Unlike agrin, the endogenous agonist of MuSK, agonist antibodies function independently of its coreceptor low-density lipoprotein receptor-related protein 4 to delay the onset of muscle denervation in mouse models of ALS. Here, we performed dose-response and time-course experiments on myotubes to systematically compare site-specific phosphorylation downstream of each agonist. Remarkably, both agonists elicited similar intracellular responses at known and newly identified MuSK signaling components. Among these was inducible tyrosine phosphorylation of multiple Rab GTPases that was blocked by MuSK inhibition. Importantly, mutation of this site in Rab10 disrupts association with its effector proteins, molecule interacting with CasL 1/3. Together, these data provide in-depth characterization of MuSK signaling, describe two novel MuSK inhibitors, and expose phosphorylation of Rab GTPases downstream of receptor tyrosine kinase activation in myotubes.

Keywords: Rab GTPases; c2c12; muscle-specific receptor tyrosine kinase; phosphoproteomics.


Conflict of interest statement

Conflict of interest The authors declare no competing interests.

Figures

None
Graphical abstract
Fig. 1
Fig. 1
An orthogonal approach for characterization of MuSK signaling utilizes time-resolved and dose-dependent phosphoproteome profiling in myotubes.A, C2C12 myotubes were treated with recombinant agrin (10 nM), MuSK Ab#13 (400 nM), or untreated (NT) for 16 h and acetylcholine receptor clusters stained with Bungarotoxin–Alexa Fluor 488 conjugate. Images were collected on In Cell Analyzer 6000. Representative images from three biological replicates are shown. B, C2C12 myotubes were treated with agrin or MuSK Ab#13 at indicated concentrations for 16 h and processed as in (A). Data are represented as cluster counts per myotube normalized to the number of nuclei per myotube. Median values are indicated within each box plot. Number of quantified myotubes per condition is indicated under the box plots (n = 3). C, a workflow for TMT-based relative quantification of time-resolved and dose-dependent changes in phosphorylation levels on S/T/Y and total protein levels. In the dose–response experiment, C2C12 myotubes were treated with agrin (0.01, 0.1, 1, 5, or 10 nM), MuSK agonist antibody (0.5, 5, 50, 100, and 400 nM), or untreated (NT) in differentiation media for 30 min (n = 2). In the time-course experiment, C2C12 myotubes were treated with recombinant agrin (10 nM) or MuSK Ab#13 (400 nM) for 10, 30, 60, and 120 min or untreated (NT) in differentiation media (n = 4). D, Venn diagrams showing the total number of phosphorylated proteins and the total number of phosphopeptide features quantified in four replicates of time course and two replicates of dose curve phosphorylation profiling experiments. For quantitative analysis, phosphopeptides containing the same phosphorylation site(s) but containing various other analytical modifications were collapsed under a single phosphopeptide feature. Phosphopeptides with at least one phosphosite with Ascore ≥10 (>90% probability of localizations) were included in the diagram. Fraction of the total identifications (IDs) are indicated in the parentheses. Ab, antibody; MuSK, muscle-specific receptor tyrosine kinase; NT, not treated; TMT, tandem mass tag.
Fig. 2
Fig. 2
Agrin and MuSK-activating antibodies induce similar phosphorylation cascades that include newly identified MuSK Y599 phosphorylation event.A, density plot comparing changes in site-specific phosphorylation induced by two MuSK agonists. r is Pearson correlation coefficient of log2FC between indicated conditions, n = 31,903 observations across duplicate experiments. B and C, relative TMT channel intensities for indicated global proteome profiling (GPP) and tyrosine phosphorylation (pY) quantified in duplicate experiments across indicated doses of agrin and Ab#13. D, coverage of MuSK phosphorylation sites that responded to agonist treatment. E and F, heatmaps of log2FC (agonist versus NT) in MuSK phosphorylation by site and total MuSK protein quantified in phosphoproteome and GPP analyses of agonist dose response in duplicate and time course in four replicates, respectively. G, sequence alignment of MuSK ATP-binding domain across species and closely related tyrosine kinases generated with the Clustal Omega program and BOXSHADE. Ab, antibody; FC, fold change; MuSK, muscle-specific receptor tyrosine kinase; NT, not treated; TMT, tandem mass tag.
Fig. 3
Fig. 3
Time-resolved phosphorylation cascade of MuSK activation.A, dose–response profiles of 119 phosphopeptide features reporting twofold or greater increase in at least one condition from both experiments performed in duplicate. Pearson correlation–based analysis was used to assign linear similarity coefficients relative to the DOK7 Y396 phosphorylation profile highlighted in green. B, schematic representation of time-resolved phosphorylation events downstream of MuSK activation by agrin and Ab#13. Plots for each node report log2 fold changes at indicated phosphosites relative to untreated cells across a time course of treatment with each agonist in four replicate experiments. Statistical modeling was performed with MSstatsTMT R package. Ab, Antibody; DOK7, docking protein 7; MuSK, muscle-specific receptor tyrosine kinase.
Fig. 4
Fig. 4
Tyrosine phosphorylation of endocytic Rabs.A, a heatmap of log2 fold changes in tyrosine phosphorylation of Rab proteins in C2C12 myotubes during a time course of MuSK activation by 10 nM agrin or 400 nM Ab#13 versus untreated control. Statistical analysis was performed with MSstatsTMT R package based on data from four replicate experiments. B, alignment of N-terminal sequences of Rab proteins identified in this study. Alignment was generated with the Clustal Omega program and BOXSHADE. C, C2C12 myotubes expressing Dox-inducible HA-Rab10wt or HA-Rab10Y6F were treated with 10 nM agrin or 400 nM Ab#13 for 1 h, followed by HA IP. HA-Rab10 tyrosine phosphorylation levels were probed with antiphosphotyrosine antibody, whereas anti-HA antibody was used as a loading control for HA-Rab10. Antibody specificity was confirmed in control samples without Dox stimulation. Statistics table indicates treated/NT (NT = +Dox, no treatment) pY ratios normalized to total HA-Rab10 levels, measured by ImageJ. Ab, antibody; HA, hemagglutinin; IP, immunoaffinity purification; MuSK, muscle-specific receptor tyrosine kinase; TMT, tandem mass tag.
Fig. 5
Fig. 5
MuSK inhibition affects Rab10 tyrosine phosphorylation.A and B, C2C12 myotubes were pretreated for 1 h with increasing concentrations of AZ-23 or compound 28 inhibitors, followed by treatment with 1 nM agrin or 5 nM Ab#13. Six hours after agonist treatment, AchR clusters were stained with anti-Bungarotoxin-Alexa Fluor 488. Total number of clusters per myotube was normalized to the number of nuclei stained with Hoescht. The median value per condition is indicated within the box plot, calculated based on three replicate experiments. The total number of quantified myotubes is indicated below the box plot. C and D, left panel, volcano plots of log2FC in site-specific phosphorylation of tyrosine kinases quantified by site in phosphoproteome profiling of C2C12 myotubes treated with 400 nM Ab#13 or 10 nM agrin, respectively, against untreated (NT) control. Right panels, log2FC in site-specific phosphorylation of tyrosine kinases by site in myotubes pretreated with indicated concentrations of AZ-23 or DMSO for 1 h, followed by treatment with each agonist for 30 min. Response of quantified MuSK phosphorylation sites is indicated in each plot. Statistical analysis of the data from two technical replicate experiments was performed using MSstatsTMT R package. E and F, C2C12 myotubes were treated with AZ-23, compound 28, or DMSO in the presence or the absence of MuSK Ab#13 for 1 h. Antiphosphotyrosine antibody was used to detect signal in each HA-Rab10 IP. Anti-HA antibody was used as a loading control for total HA-Rab10 levels. Statistics table indicates treated/NT (NT = +Dox, no treatment) pY ratios normalized to total HA-Rab10 levels, measured by ImageJ. Ab, antibody; AchR, acetylcholine receptor; DMSO, dimethyl sulfoxide; FC, fold change; HA, hemagglutinin; IP, immunoaffinity purification; MuSK, muscle-specific receptor tyrosine kinase.
Fig. 6
Fig. 6
Y6 mediates Rab10 interactions with adaptor proteins.A, crystal structure of Rab10 and Mical-cL complex with Rab10 Y6 highlighted in yellow (adapted from Ref. (35)). B and C, MS1 AUC-based interaction enrichment analysis of HA-Rab10wt interactions compared with control (no HA-Rab10 expression) (B) or HA-Rab10Y6F IP (C). Statistical analysis was performed using MSstats R package (n = 3). D, a heatmap of spectral counts per protein (PSMs, log2) quantified between Rab10wt and Rab10Y6F IPs in three replicate experiments. Rab10 COMMON denotes peptides that are common between Rab10wt and Rab10Y6F, whereas Rab10wt and Rab10Y6F indicate quantification of distinguishing peptides containing Y6 or the mutant Y6F, respectively. AUC, area under the curve; HA, hemagglutinin; IP, immunoaffinity purification; Mical-cL, Mical C-terminal-like protein; MS, mass spectrometry; PSM, peptide-to-spectrum match.

References

    1. Burden S., Huijbers M., Remedio L. Fundamental molecules and mechanisms for forming and maintaining neuromuscular synapses. Int. J. Mol. Sci. 2018;19:490. - PMC - PubMed
    1. Deenen J.C.W., Horlings C.G.C., Verschuuren J.J.G.M., Verbeek A.L.M., van Engelen B.G.M. The epidemiology of neuromuscular disorders: A comprehensive overview of the literature. J. Neuromuscul. Dis. 2015;2:73–85. - PubMed
    1. Herbst R. Musk function during health and disease. Neurosci. Lett. 2019;716:134676. - PubMed
    1. Kim N., Stiegler A.L., Cameron T.O., Hallock P.T., Gomez A.M., Huang J.H., Hubbard S.R., Dustin M.L., Burden S.J. Lrp4 is a receptor for agrin and forms a complex with MuSK. Cell. 2008;135:334–342. - PMC - PubMed
    1. Zhang B., Luo S., Wang Q., Suzuki T., Xiong W.C., Mei L. LRP4 serves as a coreceptor of agrin. Neuron. 2008;60:285–297. - PMC - PubMed

Publication types

LinkOut - more resources