. 2022 Mar:77:103902.
doi: 10.1016/j.ebiom.2022.103902. Epub 2022 Feb 26.

The ChAdOx1 vectored vaccine, AZD2816, induces strong immunogenicity against SARS-CoV-2 beta (B.1.351) and other variants of concern in preclinical studies

Affiliations

The ChAdOx1 vectored vaccine, AZD2816, induces strong immunogenicity against SARS-CoV-2 beta (B.1.351) and other variants of concern in preclinical studies

Alexandra J Spencer et al. EBioMedicine. 2022 Mar.

Abstract

Background: There is an ongoing global effort to design, manufacture, and clinically assess vaccines against SARS-CoV-2. Over the course of the ongoing pandemic a number of new SARS-CoV-2 virus isolates or variants of concern (VoC) have been identified containing mutations in key proteins.

Methods: In this study we describe the generation and preclinical assessment of a ChAdOx1-vectored vaccine (AZD2816) which expresses the spike protein of the Beta VoC (B.1.351).

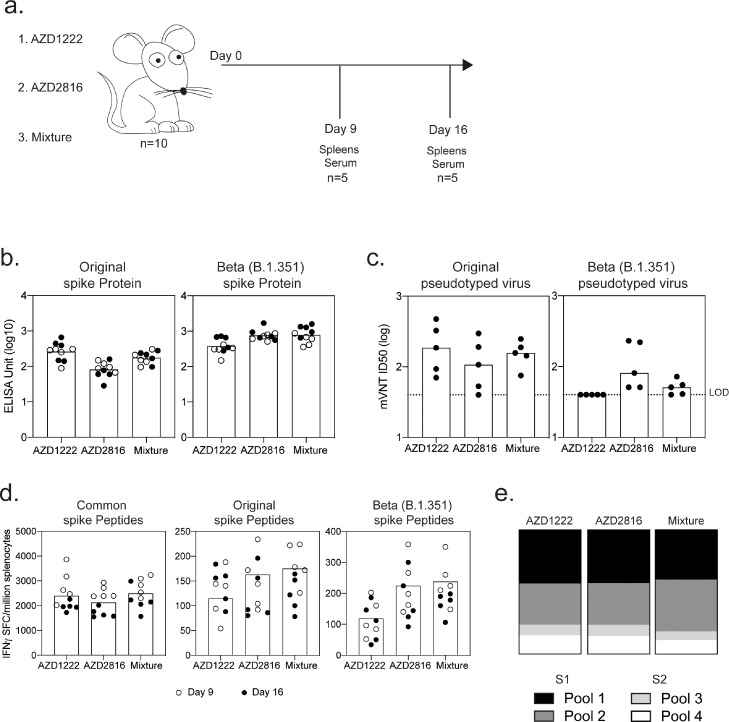
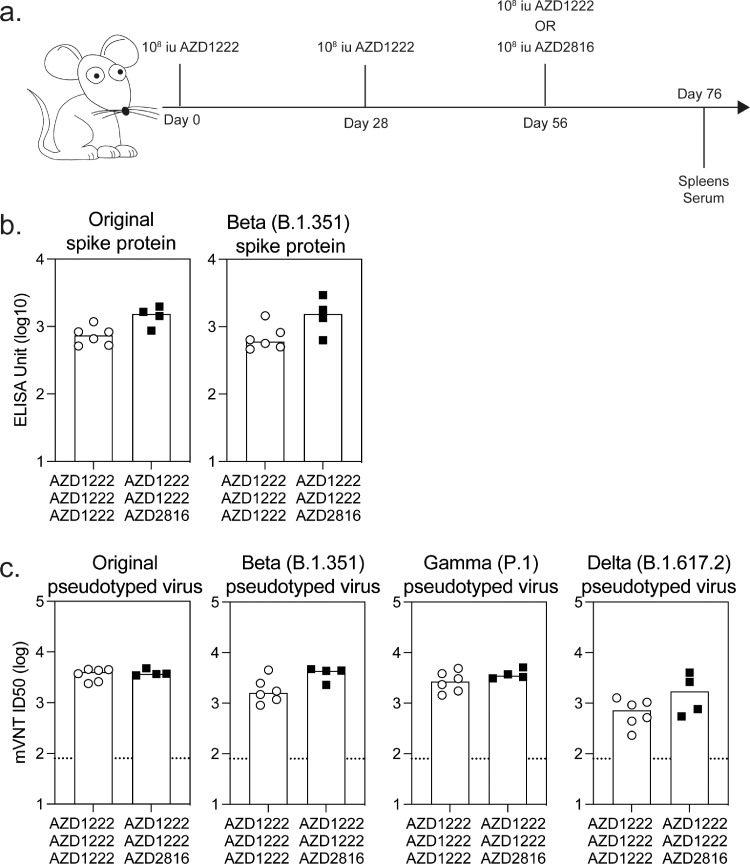
Findings: We demonstrate that AZD2816 is immunogenic after a single dose. When AZD2816 is used as a booster dose in animals primed with a vaccine encoding the original spike protein (ChAdOx1 nCoV-19/ [AZD1222]), an increase in binding and neutralising antibodies against Beta (B.1.351), Gamma (P.1) and Delta (B.1.617.2) is observed following each additional dose. In addition, a strong and polyfunctional T cell response was measured all booster regimens.

Interpretation: Real world data is demonstrating that one or more doses of licensed SARS-CoV-2 vaccines confer reduced protection against hospitalisation and deaths caused by divergent VoC, including Omicron. Our data support the ongoing clinical development and testing of booster vaccines to increase immunity against highly mutated VoC.

Funding: This research was funded by AstraZeneca with supporting funds from MRC and BBSRC.

Keywords: Antibodies; SARS CoV2; T cells; Vaccines; variants of concern.


Conflict of interest statement

Declaration of interests SCG is co-founder and board member of Vaccitech and named as an inventor on a patent covering use of ChAdOx1-vectored vaccines and a patent application covering the ChAdOx1 nCoV-19 (AZD1222) vaccine. TL is named as an inventor on a patent application covering the ChAdOx1 nCoV-19 (AZD1222) vaccine and was consultant to Vaccitech. PM was an employee of AstraZeneca, KR is an employee of AstraZeneca. HB was an employee of AstraZeneca and is a named inventor on a patent application covering the AZD2816 vaccine.

Figures

Fig 1
Figure 1
Schematic of SARS-CoV-2 spike protein and peptide pools used in studies Schematic is a graphical representation of spike protein indicating location of the signal sequence (SS), N-terminal domain (NTD), receptor binding domain (RBD, receptor binding motif (RBM), fusion peptide (FP), heptad repeat (HR) regions, transmembrane domain (TM) and cytoplasmic tail (CT). Peptide pools used to stimulate splenocytes were sub-divided into 4 pools to cover the S1 and S2 regions of spike. Amino acid changes between original and Beta (B.1.351) variant virus and encoded in the AZD2816 vaccine construct are indicated. Triangle represents deletion of amino acids.
Fig 2
Figure 2
Immune response following a single dose of ChAdOx1 vaccines (a.) BALB/c mice (n = 10) were vaccinated with 108 iu of AZD1222 (ChAdOx1 nCoV-19), AZD2816 (ChAdOx1 nCoV-19 Beta) or 108 iu of each vaccine mixed together. Mice (n = 5 per timepoint) were sacrificed 9 (open circles) or 16 (closed circles) days later to measure antibody and T cell responses. (b.) Spike-specific IgG levels measured in the serum of mice against original spike protein or Beta (B.1.351) spike protein. (c.) Microneutralisation titres mVNT (ID50) measured in the serum of mice day 16 post vaccination, against pseudotyped virus expressing original spike or Beta (B.1.351) protein. Limit of detection (LOD) in the assay is defined as a titre of 40. (d.) IFNγ secreting cells measured by ELISpot on day 9 or day 16, with splenocytes stimulated with pools of common peptides, original (WT) spike peptides or corresponding B.1.351 peptides covering the regions of difference between SARS-CoV-2 isolates. (e.) Proportion of IFNγ secreting cells measured against spike common peptides, sub-divided into S1 (pool 1 and pool 2) or S2 (pool 3 or pool 4) regions of spike protein.
Fig 3
Fig. 3
Immune response are boosted by immunisation with AZD2816 (a.) BALB/c mice (n = 5 or 6) received one dose of 108 iu of AZD1222 (ChAdOx1 nCoV-19) and were boosted with 108 iu of AZD1222 or AZD2816 (ChAdOx1 nCoV-19 Beta). All mice were sacrificed a further 3 weeks later and antibody responses measured in the serum and T cell responses in the spleen of mice. (b.) Graphs show the total IgG level measured by ELISA against original spike protein (WT) or B.1.351 spike protein. Data was log transformed and analysed with a two-way analysis of variance (repeated measure) and post-hoc positive test, no significance between groups (p < 0.05) was observed. (c.) Graphs show microneutralisation titres mVNT (ID50) measured against pseudotyped virus expressing original, Beta (B.1.351), Delta (B.1.617.2) or Gamma (P.1) spike protein. Limit of detection in the assay is defined as a titre of 80 (dotted line). Data was log transformed and analysed with a two-way analysis of variance (repeated measure) and post-hoc positive test, significance between groups (when p < 0.05) is indicated on the graph. (d.) Graphs show IFNγ secreting cells measured by ELISpot, with splenocytes stimulated with pools of common, original (WT) or Beta (B.1.351) peptides or frequency of cytokine producing CD4+ (middle) or CD8+ T cells (right).
Fig 4
Figure 4
Immune response are boosted by immunisation with AZD2816 (a.) BALB/c mice (n = 4 or 6) received two doses of 108 iu of AZD1222 (ChAdOx1 nCoV-19) 4 weeks apart and were boosted with 108 iu of AZD1222 or AZD2816 (ChAdOx1 nCoV-19 B.1.351). All mice were sacrificed a further 3 weeks later and antibody responses measured in the serum and T cell responses in the spleen of mice. (b.) Graphs show the total IgG level measured by ELISA against original spike protein (WT) or B.1.351 spike protein. Data was log transformed and analysed with a two-way analysis of variance (repeated measure) and post-hoc positive test, no significance between groups (p < 0.05) was observed. (c.) Graphs show microneutralisation titres mVNT (ID50) measured against pseudotyped virus expressing original (WT), Beta (B.1.351), Gamma (P.1) or Delta (B.1.617.2) spike protein. Limit of detection in the assay is defined as a titre of 80 (dotted line). Data was log transformed and analysed with a two-way analysis of variance (repeated measure) and post-hoc positive test (), no significance between groups (p < 0.05) was observed.
Fig 5
Figure 5
T cell responses following boost vaccination with AZD1222 or AZD2816 In the same experiment as described in Fig. 4, T cell responses in the spleen of mice 3 weeks after the final vaccination. (a.) Graphs show IFNγ secreting cells measured by ELISpot, with splenocytes stimulated with pools of common, original (WT) or Beta (B.1.351) peptides. Bar graph represents the proportion of IFNγ secreting cells measured against spike common peptides, sub-divided into S1 (pool 1 and pool 2) or S2 (pool 3 or pool 4) regions of spike protein. (b.) Graphs show the frequency of cytokine producing CD4+, total number (left) or proportion (right) of IFNγ+ or TNFα+ CD4+ T cells of a T effector (Tem), T effector memory (Tem) or T central memory cells (Tcm) phenotype, bars represent the median response per group. (c.) Graphs show the frequency of cytokine producing CD8+, total number (left) or proportion (right) of IFNγ+ or TNFα+ CD8+ T cells of a T effector (Tem), T effector memory (Tem) or T central memory cells (Tcm) phenotype, bars represent the median response per group.

Similar articles

Cited by

References

    1. Vasileiou E., Simpson C.R., Shi T., et al. Interim findings from first-dose mass COVID-19 vaccination roll-out and COVID-19 hospital admissions in Scotland: a national prospective cohort study. Lancet. 2021;397(10285):1646–1657. - PMC - PubMed
    1. Hall V.J., Foulkes S., Saei A., et al. COVID-19 vaccine coverage in health-care workers in England and effectiveness of BNT162b2 mRNA vaccine against infection (SIREN): a prospective, multicentre, cohort study. Lancet. 2021;397(10286):1725–1735. - PMC - PubMed
    1. Mahase E. Covid-19: one dose of vaccine cuts risk of passing on infection by as much as 50%, research shows. BMJ. 2021;373:n1112. - PubMed
    1. PHE. SARS-CoV-2 variants of concern and variants under investigation in England 2021 Available from: https://assets.publishing.service.gov.uk/government/uploads/system/uploa....
    1. Chung H., He S., Nasreen S., et al. Effectiveness of BNT162b2 and mRNA-1273 Covid-19 vaccines against symptomatic SARS-CoV-2 infection and severe covid-19 outcomes in Ontario, Canada: test negative design study. BMJ. 2021;374:n1943. - PMC - PubMed

Supplementary concepts