

Differential Electrographic Signatures Generated by Mechanistically-Diverse Seizurogenic Compounds in the Larval Zebrafish Brain
- PMID: 35228313
- PMCID: PMC8970338
- DOI: 10.1523/ENEURO.0337-21.2022
Differential Electrographic Signatures Generated by Mechanistically-Diverse Seizurogenic Compounds in the Larval Zebrafish Brain
Erratum in
-
Erratum: Pinion et al., "Differential Electrographic Signatures Generated by Mechanistically-Diverse Seizurogenic Compounds in the Larval Zebrafish Brain".eNeuro. 2022 Aug 4;9(4):ENEURO.0291-22.2022. doi: 10.1523/ENEURO.0291-22.2022. Print 2022 Jul-Aug. eNeuro. 2022. PMID: 35927003 Free PMC article. No abstract available.
Abstract
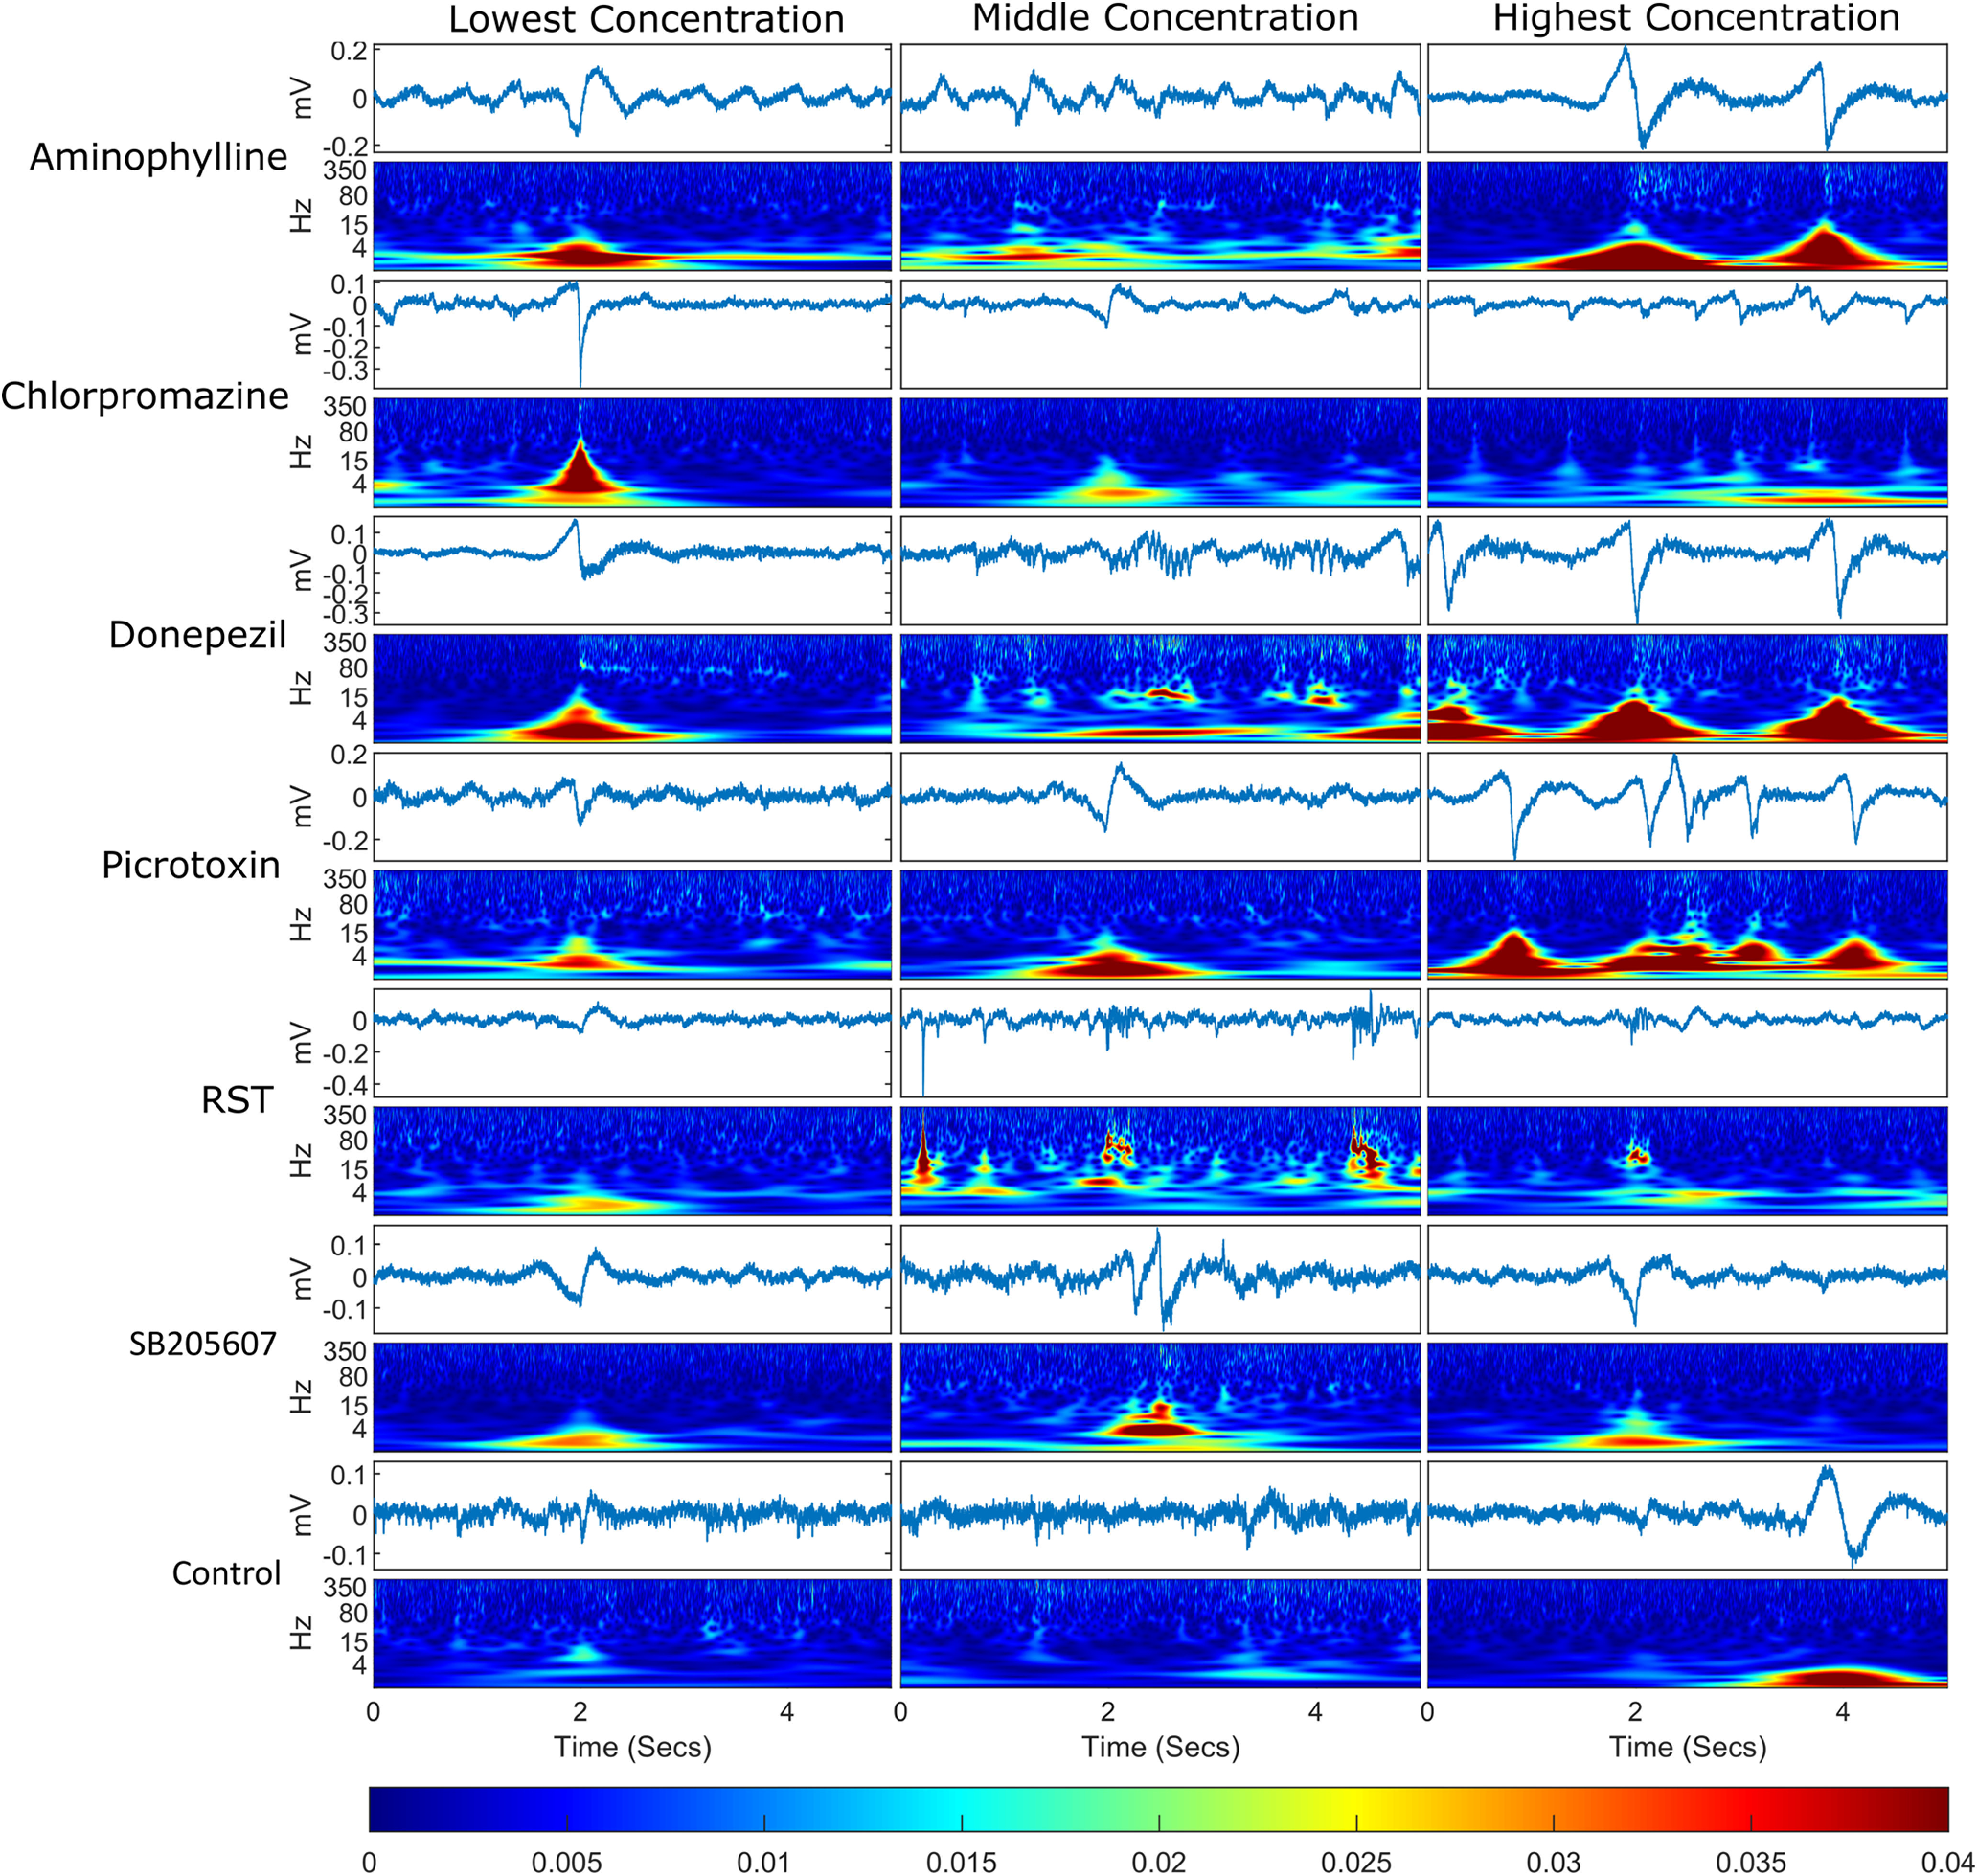
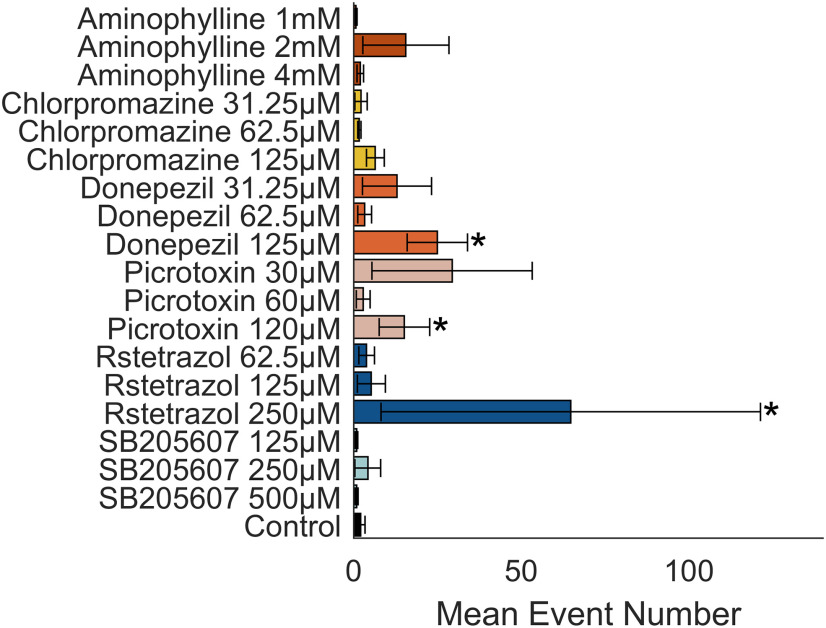
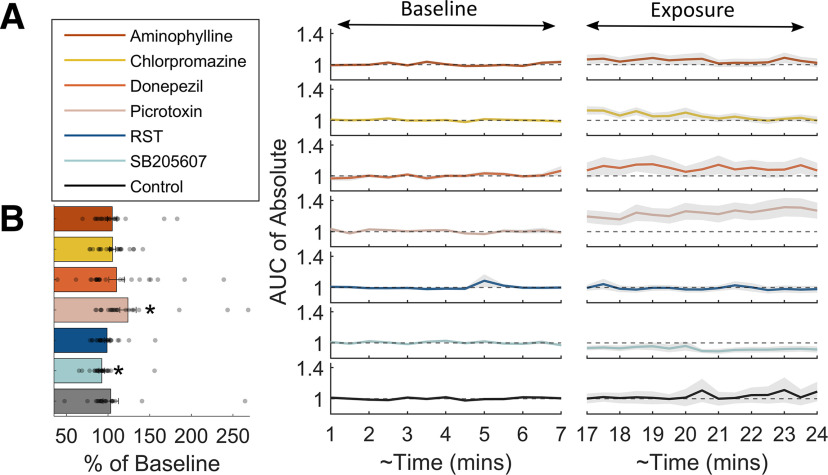
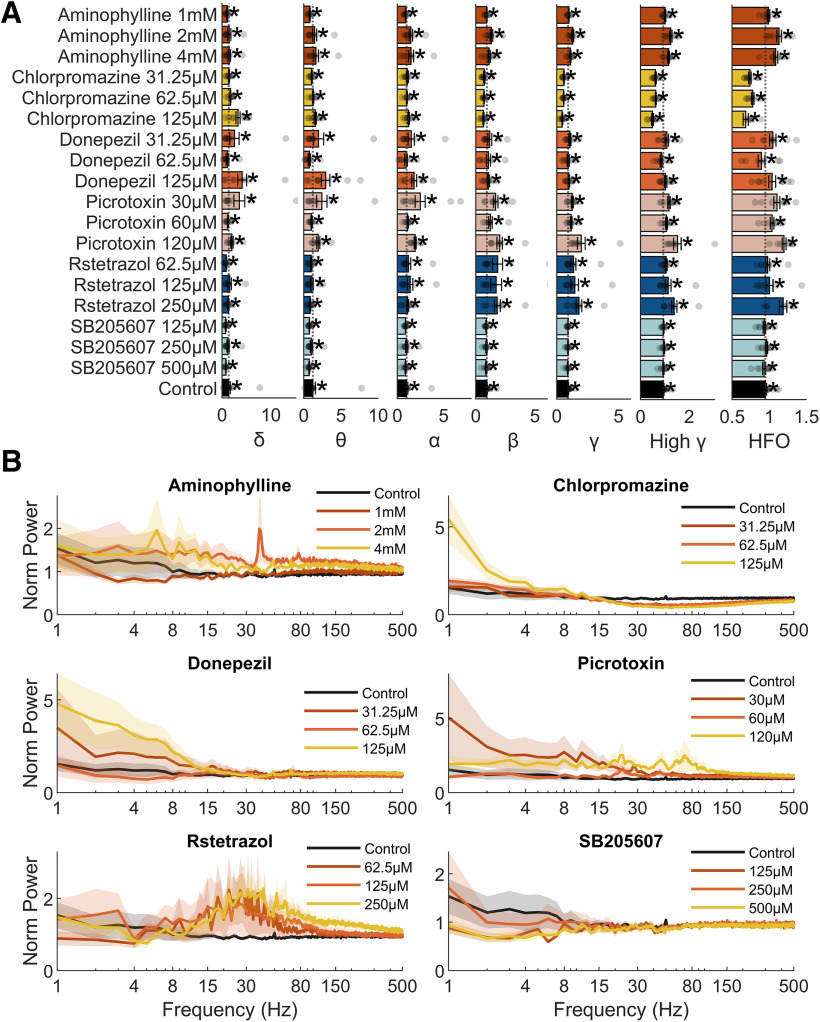
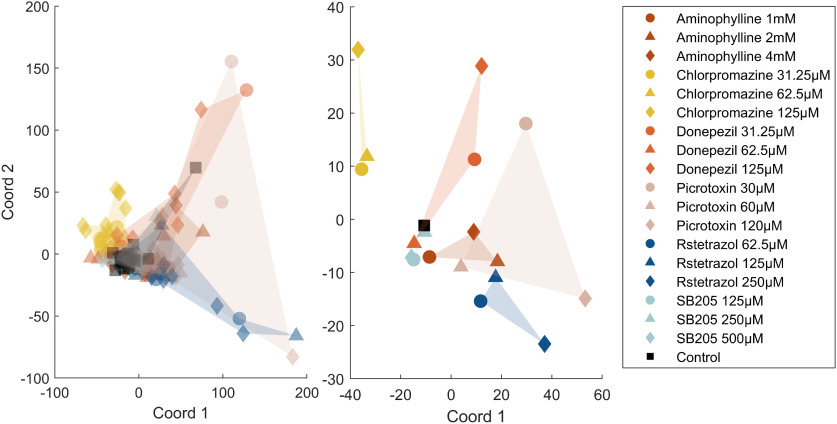
We assessed similarities and differences in the electrographic signatures of local field potentials (LFPs) evoked by different pharmacological agents in zebrafish larvae. We then compared and contrasted these characteristics with what is known from electrophysiological studies of seizures and epilepsy in mammals, including humans. Ultimately, our aim was to phenotype neurophysiological features of drug-induced seizures in larval zebrafish for expanding knowledge on the translational potential of this valuable alternative to mammalian models. LFPs were recorded from the midbrain of 4-d-old zebrafish larvae exposed to a pharmacologically diverse panel of seizurogenic compounds, and the outputs of these recordings were assessed using frequency domain analysis. This included analysis of changes occurring within various spectral frequency bands of relevance to mammalian CNS circuit pathophysiology. From these analyses, there were clear differences in the frequency spectra of drug-exposed LFPs, relative to controls, many of which shared notable similarities with the signatures exhibited by mammalian CNS circuits. These similarities included the presence of specific frequency components comparable to those observed in mammalian studies of seizures and epilepsy. Collectively, the data presented provide important information to support the value of larval zebrafish as an alternative model for the study of seizures and epilepsy. These data also provide further insight into the electrophysiological characteristics of seizures generated in nonmammalian species by the action of neuroactive drugs.
Keywords: 3Rs; drug discovery; electrophysiology; neuropharmacology; seizures; zebrafish.
Copyright © 2022 Pinion et al.
Figures
Similar articles
-
Functional brain imaging in larval zebrafish for characterising the effects of seizurogenic compounds acting via a range of pharmacological mechanisms.Br J Pharmacol. 2021 Jul;178(13):2671-2689. doi: 10.1111/bph.15458. Epub 2021 May 5. Br J Pharmacol. 2021. PMID: 33768524
-
Phenylthiourea-mediated experimental depigmentation reduces seizurogenic response of pentylenetetrazol in zebrafish larva.J Pharmacol Toxicol Methods. 2024 Jul-Aug;128:107532. doi: 10.1016/j.vascn.2024.107532. Epub 2024 Jun 7. J Pharmacol Toxicol Methods. 2024. PMID: 38852687
-
Imaging epilepsy in larval zebrafish.Eur J Paediatr Neurol. 2020 Jan;24:70-80. doi: 10.1016/j.ejpn.2020.01.006. Epub 2020 Jan 14. Eur J Paediatr Neurol. 2020. PMID: 31982307 Free PMC article. Review.
-
Forebrain electrophysiological recording in larval zebrafish.J Vis Exp. 2013 Jan 24;(71):50104. doi: 10.3791/50104. J Vis Exp. 2013. PMID: 23380808 Free PMC article.
-
Age Bias in Zebrafish Models of Epilepsy: What Can We Learn From Old Fish?Front Cell Dev Biol. 2020 Sep 10;8:573303. doi: 10.3389/fcell.2020.573303. eCollection 2020. Front Cell Dev Biol. 2020. PMID: 33015065 Free PMC article. Review.
Cited by
-
Machine learning enables high-throughput, low-replicate screening for novel anti-seizure targets and compounds using combined movement and calcium fluorescence in larval zebrafish.Eur J Pharmacol. 2025 Mar 15;991:177327. doi: 10.1016/j.ejphar.2025.177327. Epub 2025 Feb 4. Eur J Pharmacol. 2025. PMID: 39914783
-
Zebrafish as an Innovative Tool for Epilepsy Modeling: State of the Art and Potential Future Directions.Int J Mol Sci. 2023 Apr 22;24(9):7702. doi: 10.3390/ijms24097702. Int J Mol Sci. 2023. PMID: 37175408 Free PMC article. Review.
-
Diving into the zebrafish brain: exploring neuroscience frontiers with genetic tools, imaging techniques, and behavioral insights.Front Mol Neurosci. 2024 Mar 12;17:1358844. doi: 10.3389/fnmol.2024.1358844. eCollection 2024. Front Mol Neurosci. 2024. PMID: 38533456 Free PMC article. Review.
References
-
- Afrikanova T, Serruys A-SK, Buenafe OEM, Clinckers R, Smolders I, de Witte PAM, Crawford AD, Esguerra CV (2013) Validation of the zebrafish pentylenetetrazol seizure model: locomotor versus electrographic responses to antiepileptic drugs. PLoS One 8:e54166. 10.1371/journal.pone.0054166 - DOI - PMC - PubMed
Publication types
MeSH terms
Grants and funding
LinkOut - more resources
Full Text Sources
Medical
Molecular Biology Databases