. 2022 Feb 28;8(1):90.
doi: 10.1038/s41420-022-00894-w.

Myoglobin promotes macrophage polarization to M1 type and pyroptosis via the RIG-I/Caspase1/GSDMD signaling pathway in CS-AKI

Affiliations

Myoglobin promotes macrophage polarization to M1 type and pyroptosis via the RIG-I/Caspase1/GSDMD signaling pathway in CS-AKI

Ning Li et al. Cell Death Discov. .

Abstract

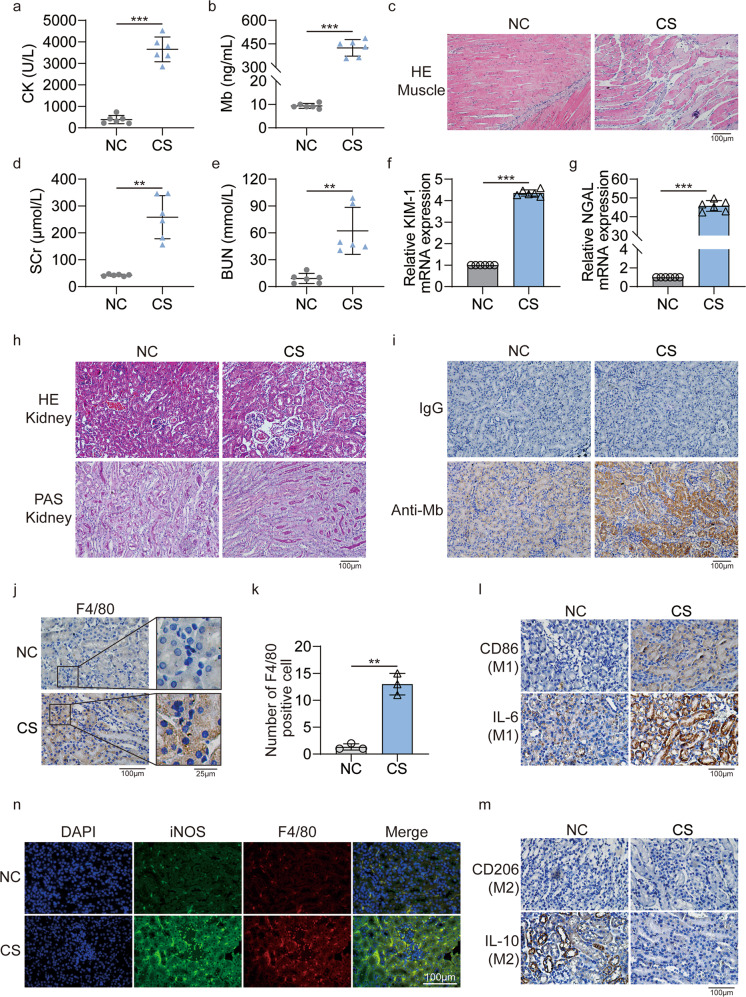
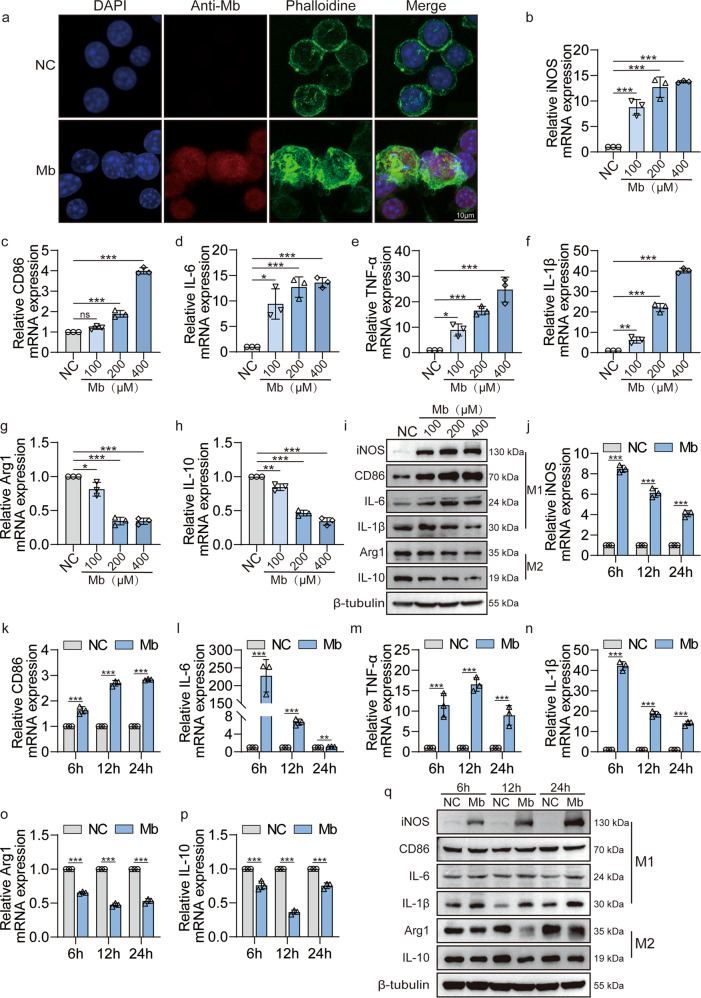
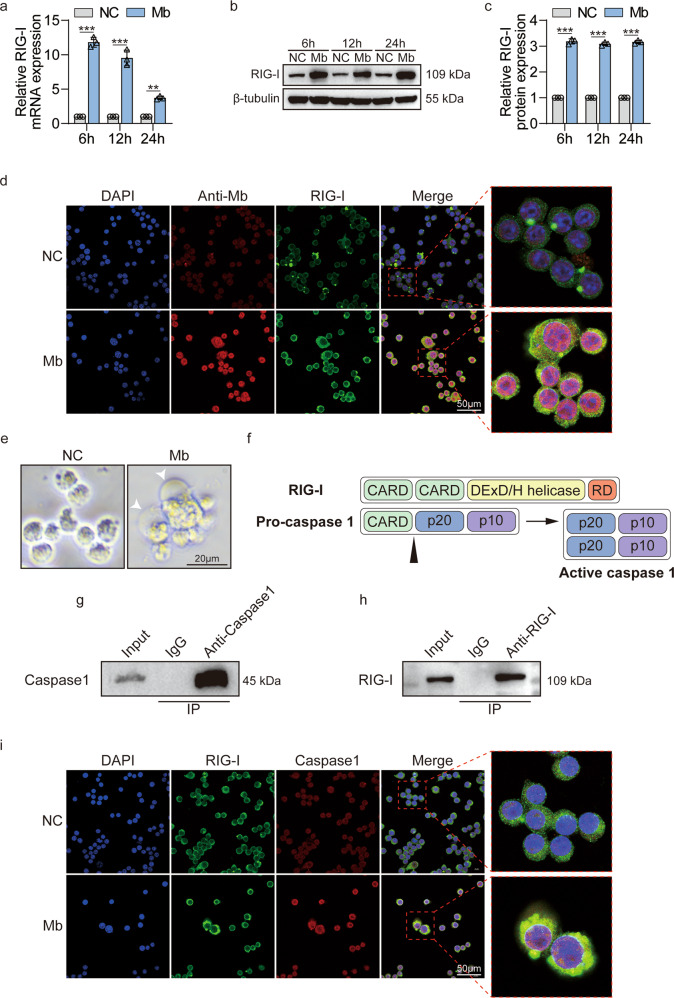
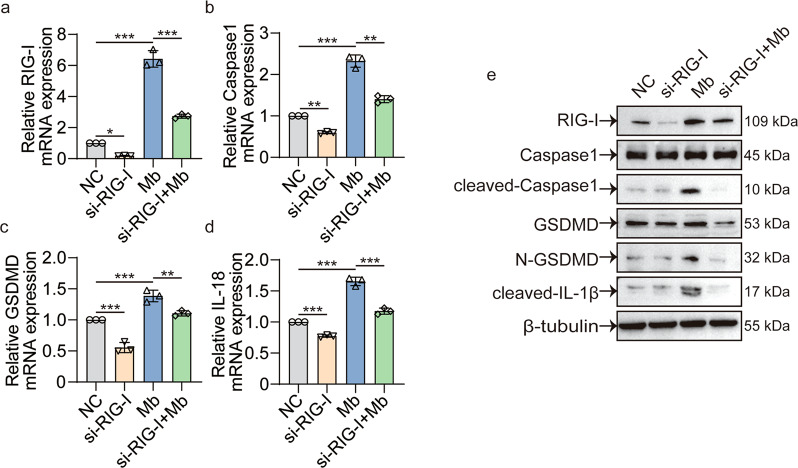
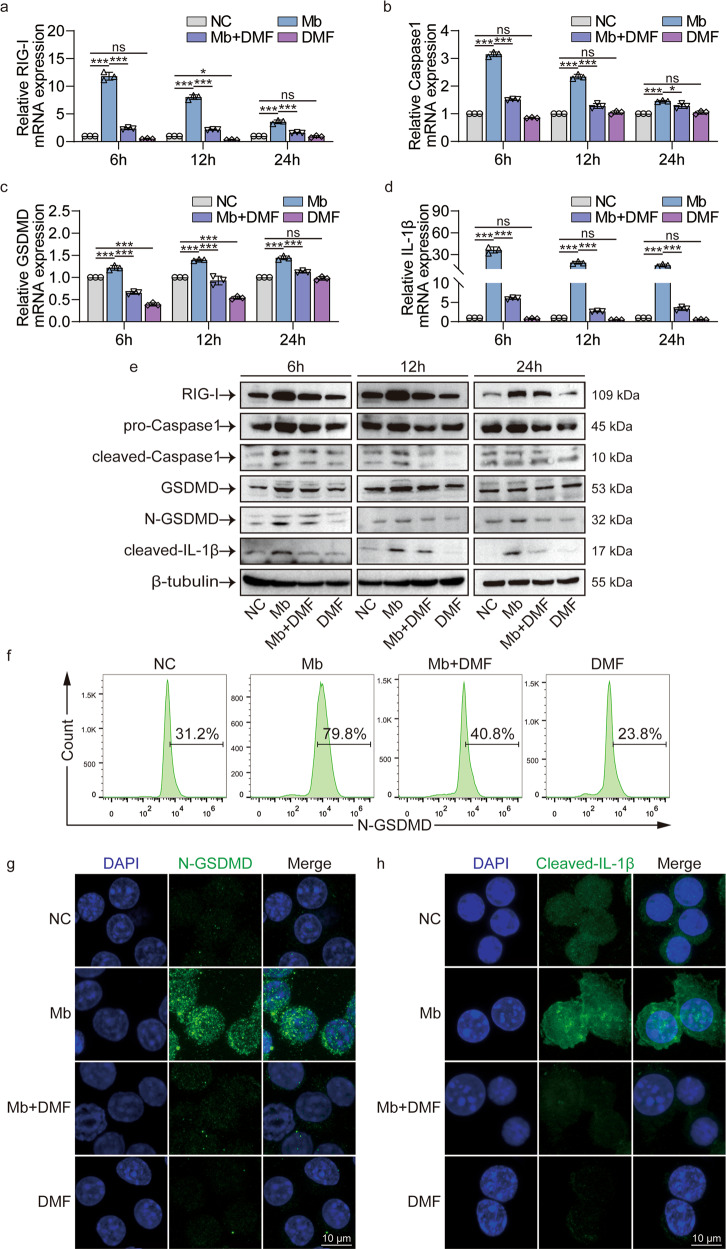
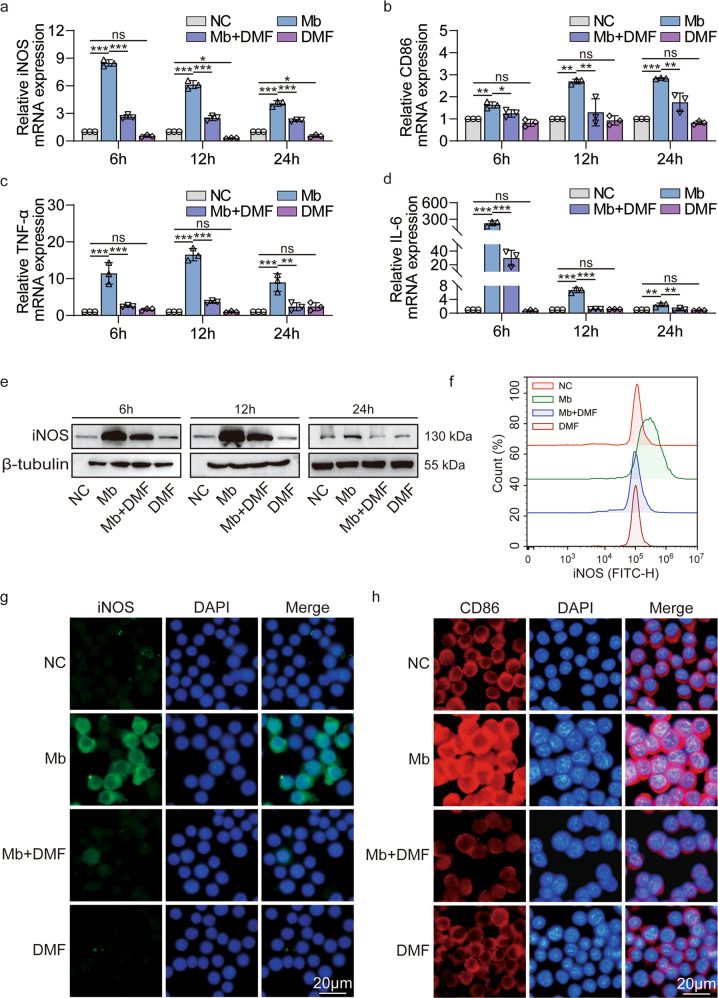
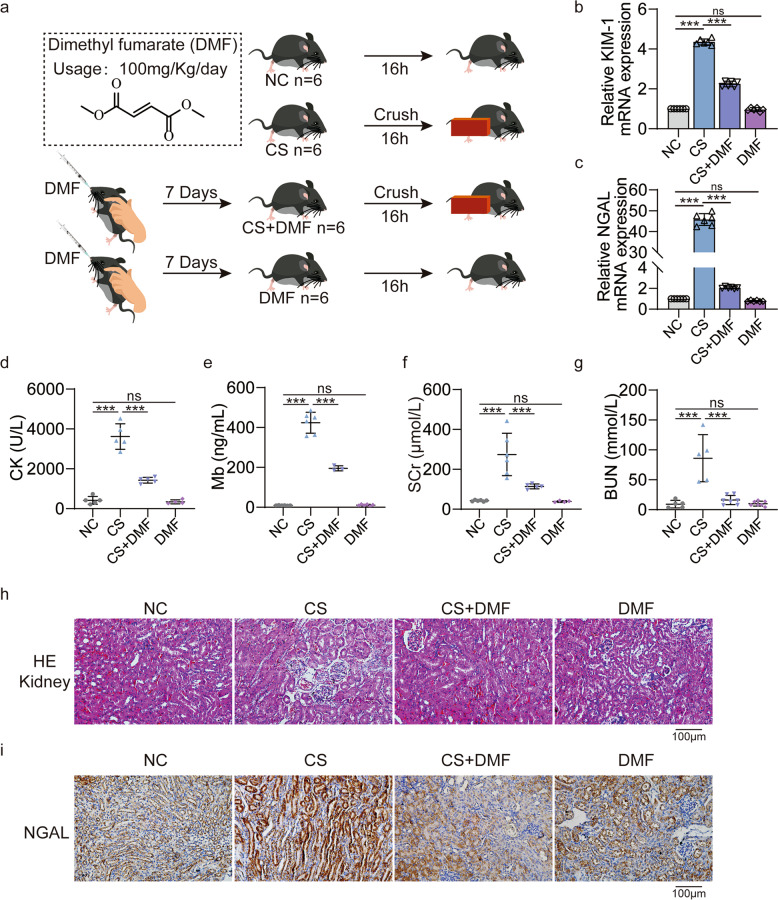
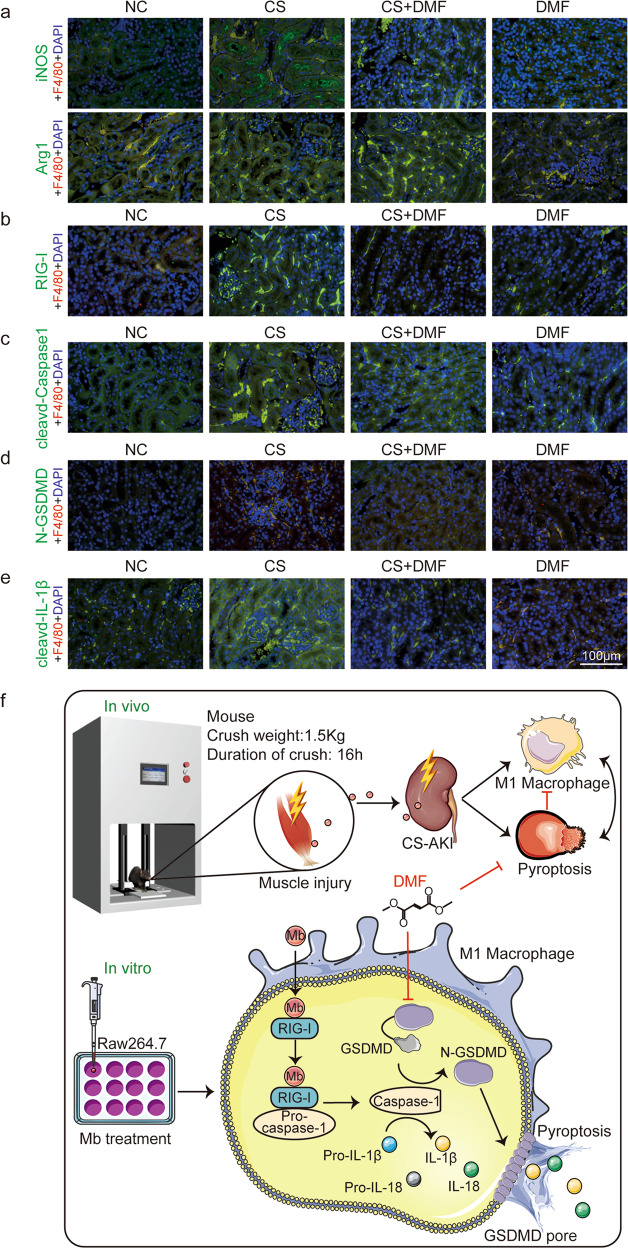
Crush syndrome (CS) is a life-threatening illness in traffic accidents and earthquakes. Crush syndrome-induced acute kidney injury (CS-AKI) is considered to be mainly due to myoglobin (Mb) circulation and deposition after skeletal muscle ruptures and releases. Macrophages are the primary immune cells that fight foreign substances and play critical roles in regulating the body's natural immune response. However, what effect does myoglobin have on macrophages and the mechanisms involved in the CS-AKI remain unclear. This study aims to look into how myoglobin affects macrophages of the CS-AKI model. C57BL/6 mice were used to construct the CS-AKI model by digital crush platform. Biochemical analysis and renal histology confirmed the successful establishment of the CS-AKI mouse model. Ferrous myoglobin was used to treat Raw264.7 macrophages to mimic the CS-AKI cell model in vitro. The macrophage polarization toward M1 type and activation of RIG-I as myoglobin sensor were verified by real-time quantitative PCR (qPCR), Western blotting (WB), and immunofluorescence (IF). Macrophage pyroptosis was observed under light microscopy. The interaction between RIG-I and caspase1 was subsequently explored by co-immunoprecipitation (Co-IP) and IF. Small interfering RNA (siRIG-I) and pyroptosis inhibitor dimethyl fumarate (DMF) were used to verify the role of macrophage polarization and pyroptosis in CS-AKI. In the kidney tissue of CS-AKI mice, macrophage infiltration and M1 type were found. We also detected that in the cell model of CS-AKI in vitro, ferrous myoglobin treatment promoted macrophages polarization to M1. Meanwhile, we observed pyroptosis, and myoglobin activated the RIG-I/Caspase1/GSDMD signaling pathway. In addition, pyroptosis inhibitor DMF not only alleviated kidney injury of CS-AKI mice but also inhibited macrophage polarization to M1 phenotype and pyroptosis via the RIG-I/Caspase1/GSDMD signaling pathway. Our research found that myoglobin promotes macrophage polarization to M1 type and pyroptosis via the RIG-I/Caspase1/GSDMD signaling pathway in CS-AKI.


Conflict of interest statement

The authors declare no competing interests.

Figures

Fig. 1
Fig. 1. Successful construct the CS-AKI mouse model.
a, b Concentration of biochemical indicators CK and myoglobin in serum. c HE staining analyses the pathological changes of muscle in the CS group (original magnification: 200×; scale bar: 100 μm). d, e Concentration of biochemical indicators SCr and BUN in serum. f, g qPCR analyses KIM-1 and NGAL mRNA level at the CS group. h HE and PAS staining analyze the pathological changes of renal tissues in the CS group (original magnification: 200×; scale bar: 100 μm). i IHC staining for myoglobin in the CS group, IgG as a negative control (original magnification: 200×; scale bar: 100 μm). j Representative anti-F4/80 staining showing increased macrophage infiltration in CS group compared to NC group (original magnification: 400×; scale bar: 100 μm). k F4/80-positive cells are counted equivalent infiltration of macrophages. l, m IHC staining analyses the expression of M1 associated molecular CD86, IL-6 and M2 associated molecular CD206, IL-10 in kidney tissues (original magnification: 400×, scale bar: 100 μm). n Representative confocal microscopy images of sections from kidneys harvested in NC and CS group mice stained for iNOS (green), F4/80 (red) and DAPI (blue) (scale bar: 100 μm). For statistical analysis, an unpaired two-tailed Student’s t test was used. Data are expressed as mean ± SD. n = 6. **P < 0.01, ***P < 0.001.
Fig. 2
Fig. 2. Myoglobin promotes macrophages polarization to M1 phenotype.
a Representative confocal microscopy images of cells subjected to 200 μM ferrous myoglobin treatments and stained for nuclei (DAPI, blue), anti-myoglobin (red) and microfilament (Phalloidine, green) to detect cytoskeleton (Scale bars: 10 μm). bi qPCR and WB analyse the expression of M1 molecules iNOS, CD86, IL-6, TNF-α, IL-1β and M2 molecular Arg1, IL-10 in macrophage that treatment with 100, 200, or 400 μM ferrous myoglobin for 6 h. jq qPCR and WB analyse the expression of M1 molecules iNOS, CD86, IL-6, TNF-α, IL-1β and M2 molecular Arg1, IL-10 in macrophage that treatment with 200 μM ferrous myoglobin for 6 h, 12 h and 24 h, respectively. For statistical analysis, one-way ANOVA followed by Dunnett’s method for multiple comparisons were used in (bh). Two-way ANOVA followed by Tukey’s method for multiple comparisons used in (jp). Data are expressed as mean ± SD, n = 3 per group. *P < 0.05, **P < 0.01, ***P < 0.001.
Fig. 3
Fig. 3. RIG-I is activated by ferrous myoglobin and interacts with caspase1.
ac qPCR and WB analyse RIG-I expression in macrophage treated with 200 μM ferrous myoglobin for 6 h, 12 h, and 24 h, respectively. c is a quantitative analysis of (b). d Representative confocal microscopy images of cells subjected to 200 μM ferrous myoglobin treatments and stained for nuclei (blue), anti-myoglobin (red), and RIG-I (green) to detect co-localization of myoglobin and RIG-I (Scale bars: 50 μm). e Representative cell light microscope images. Arrowheads indicate pyroptotic cells (Scale bars: 20 μm). f Schematic diagram of the molecular structure and possible interaction location between RIG-I and caspase1. gh Co-IP assays detect the interaction between caspase1 and RIG-I in macrophages that treatment with 200 μM ferrous myoglobin for 12 h. i Representative confocal microscopy images of cells subjected to 200 μM ferrous myoglobin treatments and stained for nuclei (blue), RIG-I (green), and caspase1 (red) to detect co-localization of RIG-I and caspase1 (Scale bars: 50 μm). For statistical analysis, two-way ANOVA followed by Tukey’s method for multiple comparisons used in (a) and (c). Data is expressed as mean ± SD, n = 3 per group. **P < 0.01, ***P < 0.001.
Fig. 4
Fig. 4. siRIG-I decreases the myoglobin induced expression of RIG-I and pyroptosis molecules.
ad qPCR analyses RIG-I, caspase1, GSDMD, IL-18 expression in control group (NC), siRIG-I group, ferrous myoglobin treatment group (Mb), and knocking down RIG-I then treatment with ferrous myoglobin group (siRIG-I + Mb). e WB analyses RIG-I, caspase1, cleaved-caspase1, GSDMD, N-GSDMD, cleaved-IL-1β expression in NC group, siRIG-I group, Mb group, and siRIG-I + Mb group. For statistical analysis, one-way ANOVA followed by Tukey’s method for multiple comparisons used in (ad). Data are expressed as mean ± SD, n = 3 per group. *P < 0.05, **P < 0.01, ***P < 0.001.
Fig. 5
Fig. 5. DMF inhibits RIG-I/Caspase1/GSDMD pyroptosis pathway after ferrous myoglobin treatment.
ad qPCR analyses RIG-I, caspase1, GSDMD, IL-1β expression in NC, Mb, Mb + DMF, and DMF group. e WB analyses RIG-I, caspase1, cleaved-caspase1, GSDMD, N-GSDMD, cleaved-IL-1β expression in NC, Mb, Mb+DMF, and DMF group. f Flow cytometry analyses N-GSDMD expression in NC, Mb, Mb+DMF, and DMF group. g, h Representative confocal microscopy images of cells in NC, Mb, Mb + DMF, and DMF group stain for N-GSDMD and cleaved-IL-1β (Scale bars: 10 μm). For statistical analysis, two-factor ANOVA followed by Tukey’s method of multiple comparisons used in (ad). Data are expressed as mean ± SD, n = 3 per group. *P < 0.05, **P < 0.01, ***P < 0.001.
Fig. 6
Fig. 6. DMF inhibits macrophage polarization to M1 phenotype after treatment with ferrous myoglobin.
ad qPCR analyses iNOS, CD86, TNF-α, IL-6 expression in NC, Mb, Mb + DMF, and DMF group. e, f WB and flow cytometry analyse iNOS expression in NC, Mb, Mb+DMF, and DMF group. g, h Representative confocal microscopy images of cells in NC, Mb, Mb + DMF, and DMF group stained for iNOS and CD86 (Scale bars: 20 μm). For statistical analysis, two-factor ANOVA followed by Tukey’s method of multiple comparisons used in (ad). Data are expressed as mean ± SD, n = 3 per group. *P < 0.05, **P < 0.01, ***P < 0.001.
Fig. 7
Fig. 7. DMF alleviated renal injury in CS-AKI mice.
a Schematic diagram of experimental design of DMF treatment for CS-AKI mice. b, c qPCR analyses KIM-1 and NGAL mRNA level in the renal tissues of four groups (NC, CS, CS + DMF, DMF). dg Concentration of biochemical indicators CK, myoglobin, SCr and BUN in serum. h Evaluation of the therapeutic effect of DMF on the kidney tissue of CS-AKI mice by HE staining (original magnification: 200×, scale bar: 100 μm). i IHC staining analyses the expression of NGAL in kidney tissues (original magnification: 200×, scale bar: 100 μm). For statistical analysis, one-way ANOVA followed by Tukey’s method for multiple comparisons used in (bg). Data are expressed as mean ± SD, n = 3 per group. **P < 0.01, ***P < 0.001.
Fig. 8
Fig. 8. DMF reduces M1 macrophage activation and macrophage pyroptosis.
ae Representative confocal microscopy images of sections from kidneys harvested in NC, CS, CS + DMF and DMF group mice stained for iNOS, Arg1, RIG-I, cleaved-Caspase1, N-GSDMD, and cleaved-IL-1β (green), F4/80 (red) and DAPI (blue) (scale bar: 100 μm). n = 6. f The model of myoglobin induced macrophage polarization and pyroptosis in CS-AKI. Mice decompressed after 16 h continuous compression with a 1.5 kg weight have damage to the muscles of their legs, and the necrotic muscles release myoglobin, which reaches the kidneys with the blood circulation and leads to the polarization of the kidney macrophages toward M1 type and pyroptosis. Raw264.7 macrophages treated with ferrous myoglobin to mimic cell model of CS-AKI in vitro promote macrophage polarization and pyroptosis via RIG-I/Caspase1/GSDMD signaling pathway. And promotes mature IL-18 and IL-1β release. Pyroptosis inhibitor DMF can inhibit macrophage polarization and pyroptosis in CS-AKI.

References

    1. Peiris D. A historical perspective on crush syndrome: the clinical application of its pathogenesis, established by the study of wartime crush injuries. J Clin Pathol. 2017;70:277–81. doi: 10.1136/jclinpath-2016-203984.. - DOI - PubMed
    1. Gibney RT, Sever MS, Vanholder RC. Disaster nephrology: crush injury and beyond. Kidney Int. 2014;85:1049–57. doi: 10.1038/ki.2013.392.. - DOI - PubMed
    1. Gameiro J, Fonseca JA, Outerelo C, Lopes JA. Acute kidney injury: from diagnosis to prevention and treatment strategies. J Clin Med. 2020;9. 10.3390/jcm9061704. - PMC - PubMed
    1. Zhou J, Bai Y, Jiang Y, Tarun P, Feng Y, Huang R, et al. Immunomodulatory role of recombinant human erythropoietin in acute kidney injury induced by crush syndrome via inhibition of the TLR4/NF-κB signaling pathway in macrophages. Immunopharmacol Immunotoxicol. 2020;42:37–47. doi: 10.1080/08923973.2019.1706555.. - DOI - PubMed
    1. Murata I, Imanari M, Komiya M, Kobayashi J, Inoue Y, Kanamoto I. Icing treatment in rats with crush syndrome can improve survival through reduction of potassium concentration and mitochondrial function disorder effect. Exp Therapeutic Med. 2020;19:777–85. doi: 10.3892/etm.2019.8230.. - DOI - PMC - PubMed