. 2022 Feb 28;7(1):18.
doi: 10.1038/s41536-022-00213-y.

An organ-derived extracellular matrix triggers in situ kidney regeneration in a preclinical model

Affiliations

An organ-derived extracellular matrix triggers in situ kidney regeneration in a preclinical model

Kazuki Tajima et al. NPJ Regen Med. .

Abstract

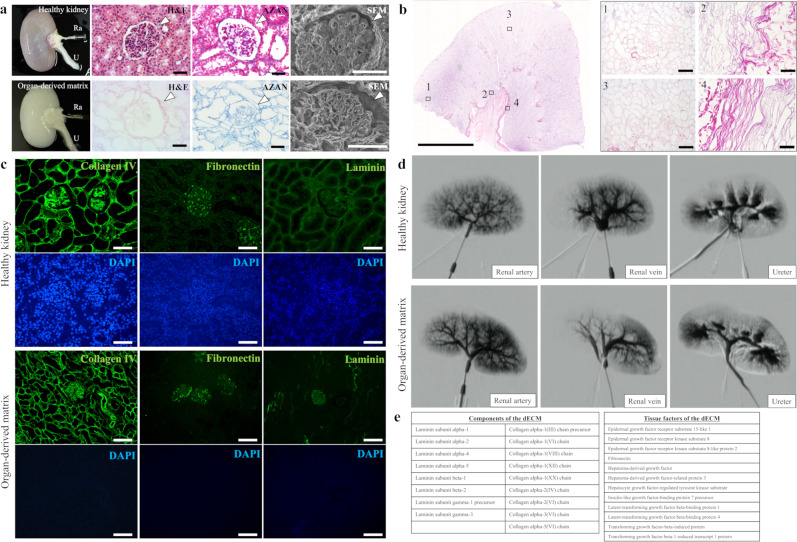
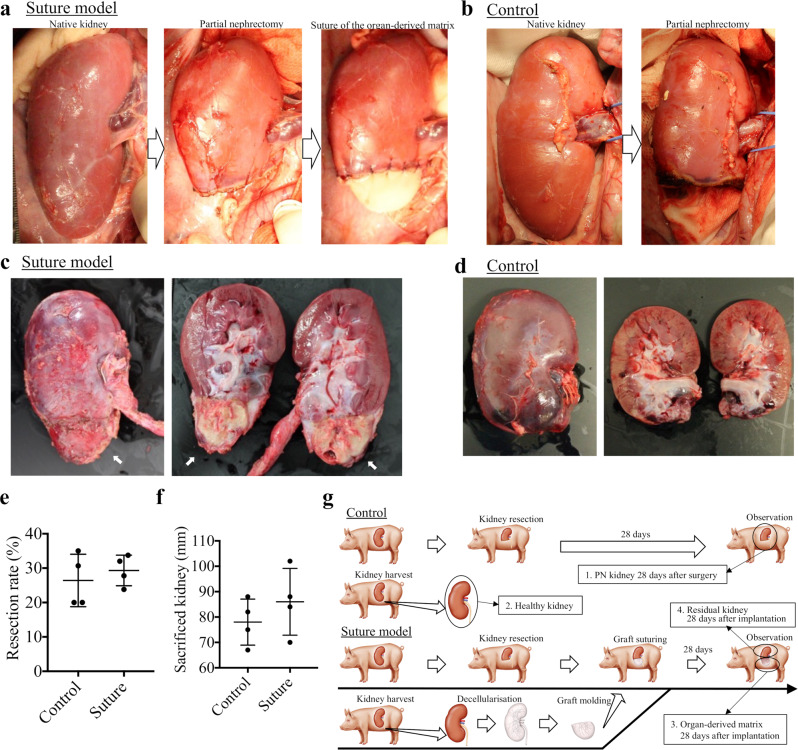
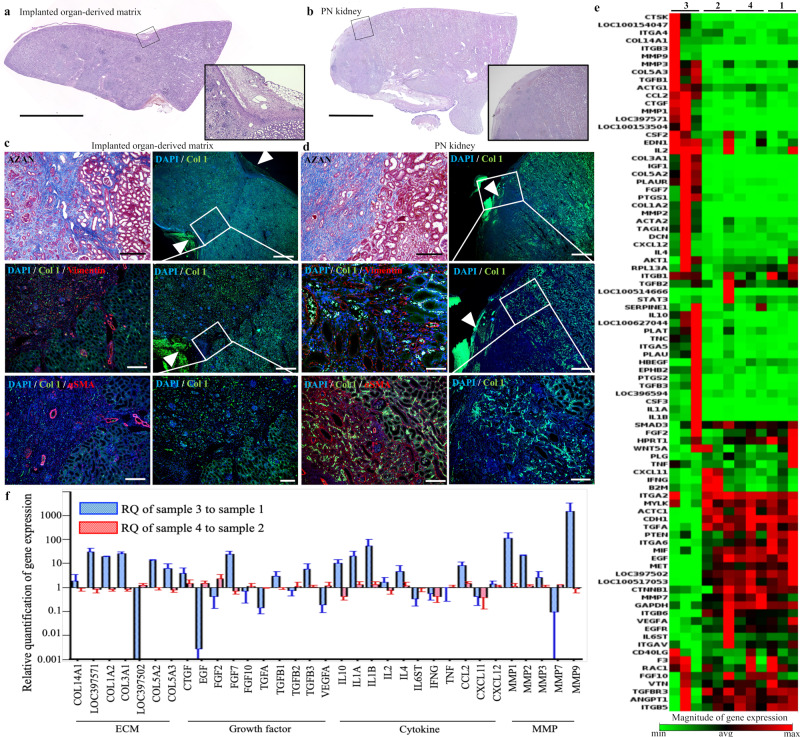
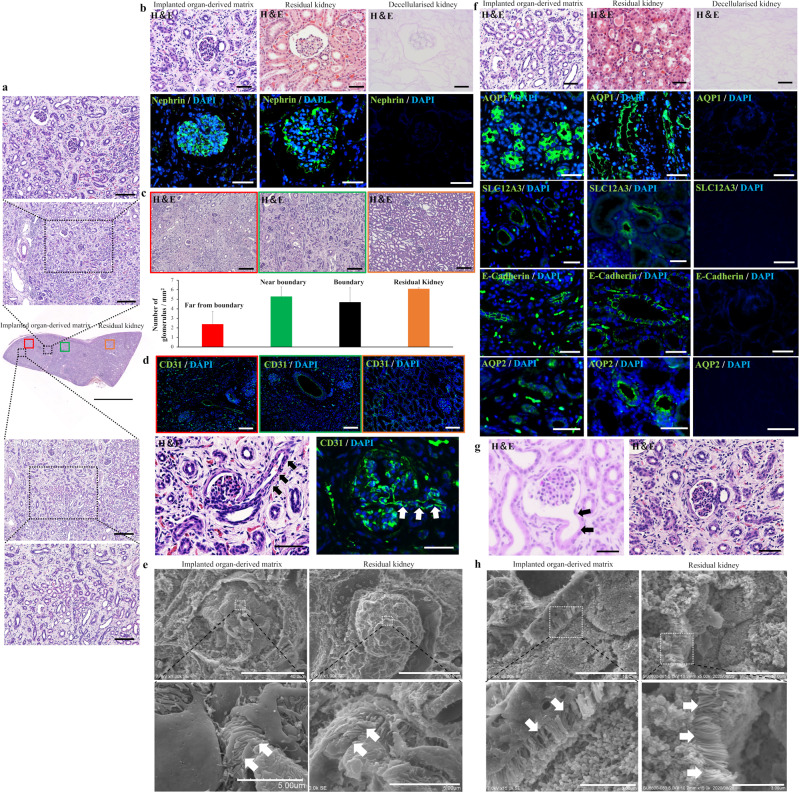
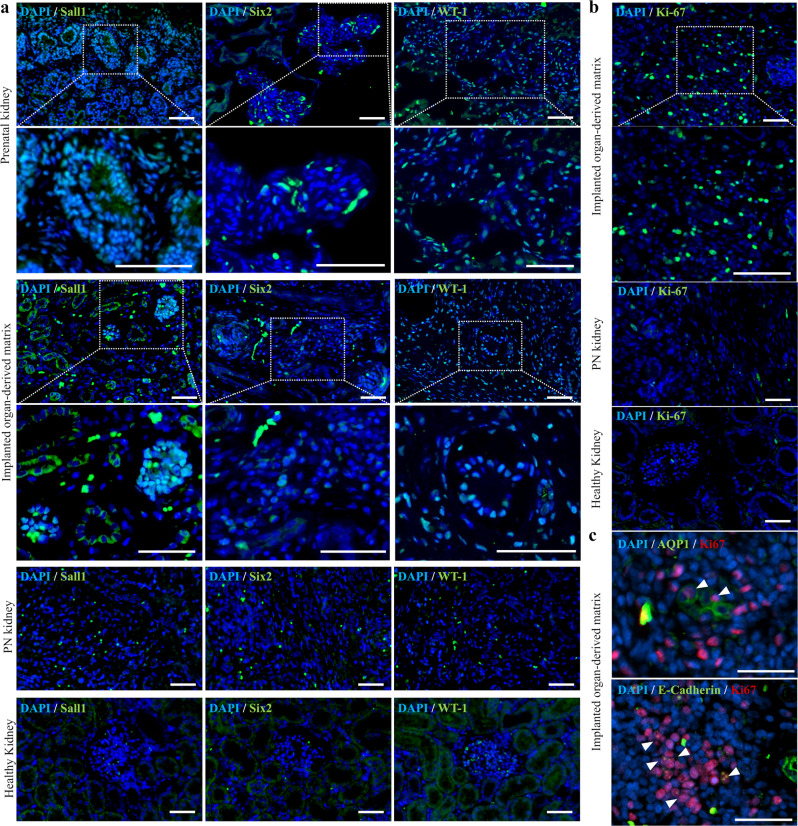
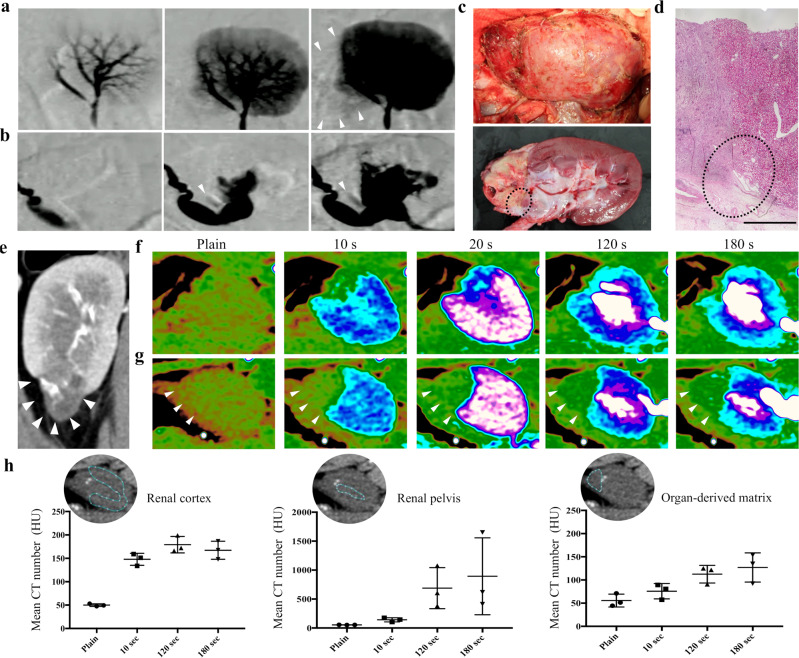
It has not been considered that nephrons regenerate in adult mammals. We present that an organ-derived extracellular matrix in situ induces nephron regeneration in a preclinical model. A porcine kidney-derived extracellular matrix was sutured onto the surface of partial nephrectomy (PN)-treated kidney. Twenty-eight days after implantation, glomeruli, vessels, and renal tubules, characteristic of nephrons, were histologically observed within the matrix. No fibrillogenesis was observed in the matrix nor the matrix-sutured kidney, although this occurred in a PN kidney without the matrix, indicating the structures were newly induced by the matrix. The expression of renal progenitor markers, including Sall1, Six2, and WT-1, within the matrix supported the induction of nephron regeneration by the matrix. Furthermore, active blood flow was observed inside the matrix using computed tomography. The matrix provides structural and functional foundations for the development of cell-free scaffolds with a remarkably low risk of immune rejection and cancerization.


Conflict of interest statement

The authors declare no competing interests.

Figures

Fig. 1
Fig. 1. Decellularization of the entire porcine kidney.
a Macro-scale photographs, H&E and Azan staining images, and SEM images for (top) a healthy kidney and (bottom) the organ-derived matrix. The white arrowheads show glomeruli. Scale bar: 30 μm for H&E and Azan staining images, 50 μm for SEM images. Ra, renal artery; U, ureter. b (left) Macro-scale montage image of H&E-stained organ-derived matrix in the whole section and (right) each enlarged region within the black-edged squares in the image. Scale bar: (left) 5 mm, (right) 50 μm. c Representative immunohistochemical images of collagen type IV, fibronectin, and laminin staining for a healthy kidney and the organ-derived matrix counterstained with DAPI. Scale bar: 100 μm. d Contrast-enhanced fluoroscopic X-ray images of a healthy kidney and the organ-derived matrix. e List of residual ECM and growth factor components in the organ-derived matrix obtained via exhaustive protein analysis using LC-MS.
Fig. 2
Fig. 2. Design of the porcine partial nephrectomy (PN) (control) and the suture model of the organ-derived matrix.
a Scheme for the construction of the matrix-sutured model. A porcine native kidney (left) is subjected to PN (middle), then the organ-derived matrix is sutured onto the resected surface of the native kidney (right). b Scheme for the construction of the control model. A porcine native kidney is only subjected to PN. c Photographs of a harvested kidney containing an organ-derived matrix sutured to residual kidney 28 days postimplantation. The white arrows show the implanted organ-derived matrix. d Photographs of a harvested PN kidney 28 days post-surgery. c, d The images on the right show the sagittal section of the harvested kidneys. e Comparison of the resection rate between the PN kidney (control) and the matrix-sutured kidney. Bars represent the mean ± SD, (n = 4). f Comparison of the major axes between the harvested PN kidney (control) and matrix-sutured kidney. Bars represent the mean ± SD, (n = 4). g Experimental outline of the porcine PN model (control) and the matrix-sutured model. The following four types of harvested kidneys were analyzed: PN kidney 28 days postsurgery (control, sample 1), healthy kidney (sample 2), organ-derived matrix 28 days post-implantation (sample 3), and corresponding residual kidney 28 days post-implantation (sample 4).
Fig. 3
Fig. 3. The organ-derived matrix-induced wound repair unaccompanied by fibrillogenesis.
a, b Macro-scale montage images of H&E staining in a the organ-derived matrix sutured to the residual kidney and b the PN kidney. The square insets show the magnification of the regions surrounded by black-edged squares in the images. Scale bar: 5 mm. c, d Histological images of Azan staining c around the boundary between the residual kidney and the organ-derived matrix and d near the resection line in the PN kidney, and immunohistochemical images of collagen type I/vimentin, collagen type I/αSMA, and collagen type I staining in the regions counterstained with DAPI. The images of collagen type I staining at varied magnifications are shown, indicating the appearance of the boundary and the resection area. The white arrowheads show c the boundary or d the point where the discontinuity of the kidney capsule was observed. Scale bar: 200 μm for Azan staining, 200 μm for collagen type I/vimentin or αSMA staining, and 1 mm, 500 μm, or 200 μm for collagen type I staining. e Clustergram showing the expression of 89 wound repair-related genes in the PN kidney 28 days post-surgery (sample 1), the healthy kidney (sample 2), the organ-derived matrix 28 days post-implantation (sample 3), and the residual kidney 28 days post-implantation (sample 4). f Quantification of expression levels for ECM-, growth factor-, cytokine-, and ECM-remodeling enzyme (MMP)-related genes in Fig. 3e. Blue and red histograms show the relative values of sample 3 to sample 1 and those of sample 4 to sample 2, respectively. Bars represent the mean ± SD, (n = 3).
Fig. 4
Fig. 4. Regeneration of glomeruli, vessels, and renal tubules induced by the organ-derived matrix.
a (middle) H&E staining montage image in the matrix sutured to the residual kidney. Red, green, and orange squares mark the region far from the boundary, near the boundary, and the residual kidney, respectively. Scale bar: 5 mm. (top and bottom) Enlarged images of the regions showing (top) glomerulus-like and (bottom) tubule-like structures. Scale bar: 200 and 100 μm for both images. b H&E images showing glomerulus-like structures in the matrix, matrix-sutured residual kidney, and decellularized kidney, and immunohistochemical images of nephrin staining in the kidneys counterstained with DAPI. Scale bar: 30 μm. c H&E staining showing a glomerulus structure and a histogram presenting the position-dependent number. Scale bar: 200 μm. The colors in the images and the histogram correspond to the areas represented by the colors in Fig. 4a. The black histogram corresponds to the area surrounded by the black square in Fig. 3a. Bars represent the mean ± SD, (n = 3). d (top) Immunohistochemical images of CD31 staining in the matrix counterstained with DAPI. The colors correspond to the areas represented by the colors in Fig. 4a. Scale bar: 100 μm. (bottom) H&E staining in the regions showing vessel-attached glomerulus structures in the matrix and CD31 staining counterstained with DAPI. The arrows show afferent arterioles. Scale bar: 50 μm. e SEM images showing glomerulus structures in the matrix and residual kidney. The arrows show foot processes. Scale bar: (top, left) 40 μm, (top, right) 50 μm, (bottom) 5 μm. f Magnified H&E staining images showing renal tubule-like structures in the matrix, residual kidney, and decellularized kidney, and immunohistochemical images of AQP1, SLC12A3, E-cadherin, and AQP 2 staining in the kidneys counterstained with DAPI. Scale bar: 30 μm. g H&E staining showing a juxtaglomerular apparatus-like structure in the matrix. The arrows indicate renal tubules. Scale bar: 50 μm. h SEM images of renal tubule structures in the matrix and residual kidney. The arrows indicate brush borders. Scale bar: (top) 10 μm, (bottom) 3 μm.
Fig. 5
Fig. 5. Expression of renal progenitor markers and proliferating cell markers in the organ-derived matrix.
a Sall1, Six2, WT-1, and DAPI staining in the prenatal kidney, the implanted organ-derived matrix, the PN kidney 28 days postsurgery (control), and the healthy kidney. Scale bar: 100 μm. b Ki67 and DAPI staining in the implanted organ-derived matrix, the PN kidney 28 days postsurgery (control), and the healthy kidney. Scale bar: 100 μm. c (top) AQP1 and (bottom) E-cadherin staining of DAPI- and Ki67-stained cells in the matrix. Scale bar: 50 μm. The white arrowheads show the AQP1- or E-cadherin-positive cells.
Fig. 6
Fig. 6. CT, angiography, and urography of the organ-derived matrix.
a, b Time lapse of the a angiography and b urography images of the matrix-implanted kidney. The white arrowheads show the regions where the contrast was enhanced in the matrix. c Photographs of (top) a kidney containing an organ-derived matrix sutured to residual kidney before harvest 28 days post-implantation and (bottom) the harvested and sagittally resected kidney. The direction of the kidneys is identical to that of the kidneys imaged in Fig. 6a and b. d H&E staining of the area surrounded by the black-dotted circle in Fig. 6c. The area within the black-dotted circle in Fig. 6d shows the region where the matrix, residual kidney, and fused renal capsule are closely packed. Scale bar: 2 mm. e CT images of the matrix-implanted kidney. The white arrows show the matrix. f, g Time course of the CT scan images for f the PN kidney and g the matrix-implanted kidney. The white arrowheads show the matrix. h Time course of the mean CT number in the renal cortex, renal pelvis, and matrix in the implanted kidney. The CT number in ROI was estimated using OsiriX Lite. The white-dotted blue circles indicate ROI in the renal cortex, renal pelvis, and matrix. Bars represent the mean ± SD, (n = 3).

Similar articles

Cited by

References

    1. Bertram JF, Douglas-Denton RN, Diouf B, Hughson MD, Hoy WE. Human nephron number: implications for health and disease. Pediatr. Nephrol. 2011;26:1529–1533. - PubMed
    1. Keller G, Zimmer G, Mall G, Ritz E, Amann K. Nephron number in patients with primary hypertension. N. Engl. J. Med. 2003;348:101–108. - PubMed
    1. Saxen L, Sariola H. Early organogenesis of the kidney. Pediatr. Nephrol. 1987;1:385–392. - PubMed
    1. Diep CQ, et al. Identification of adult nephron progenitors capable of kidney regeneration in zebrafish. Nature. 2011;470:95–100. - PMC - PubMed
    1. Jha V, et al. Chronic kidney disease: global dimension and perspectives. Lancet. 2013;382:260–272. - PubMed