. 2022 Feb 28;13(1):1084.
doi: 10.1038/s41467-022-28661-6.

Single-cell gene fusion detection by scFusion

Affiliations

Single-cell gene fusion detection by scFusion

Zijie Jin et al. Nat Commun. .

Abstract

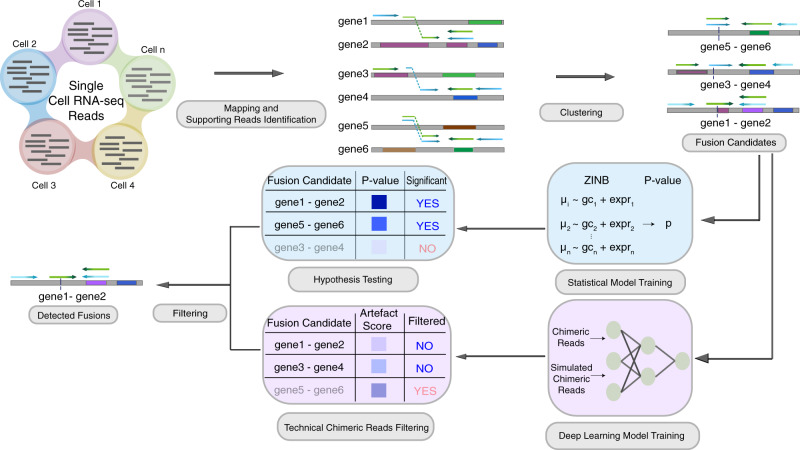
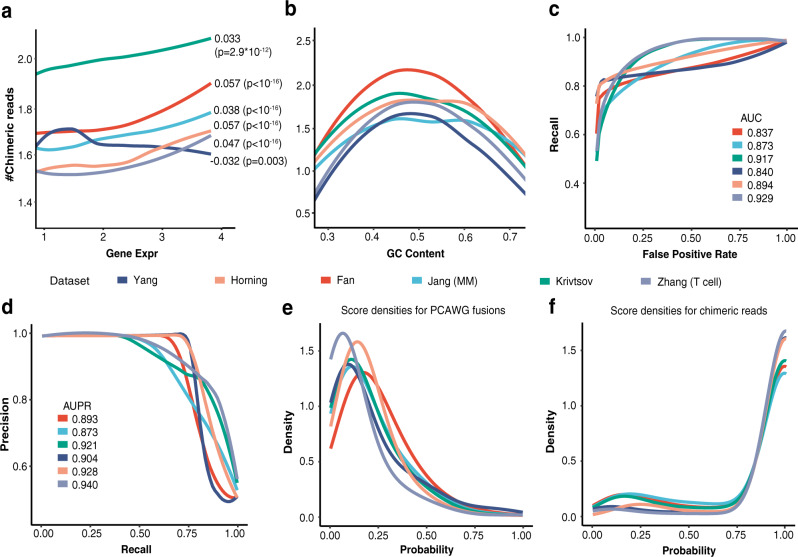
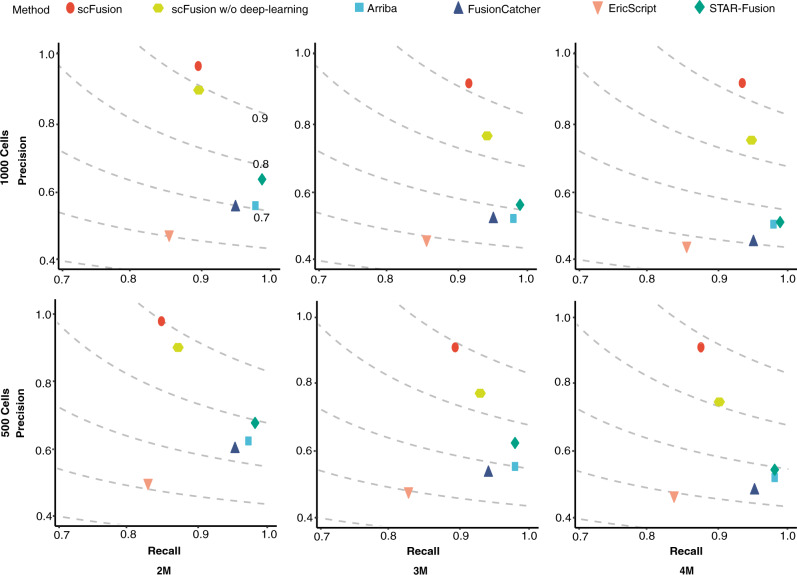
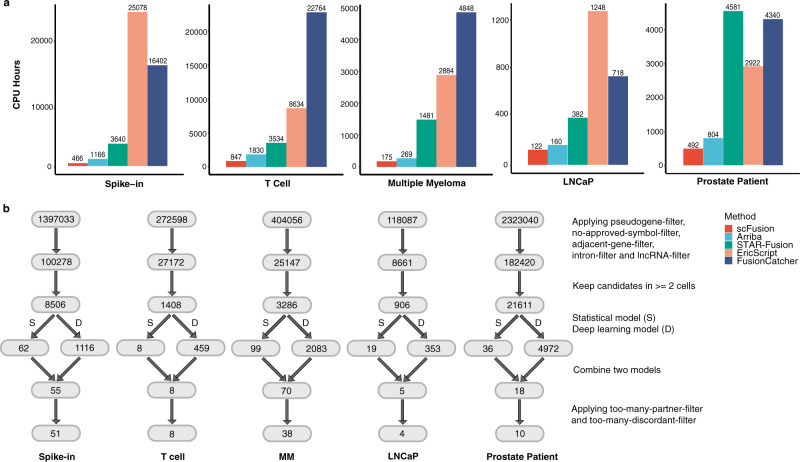
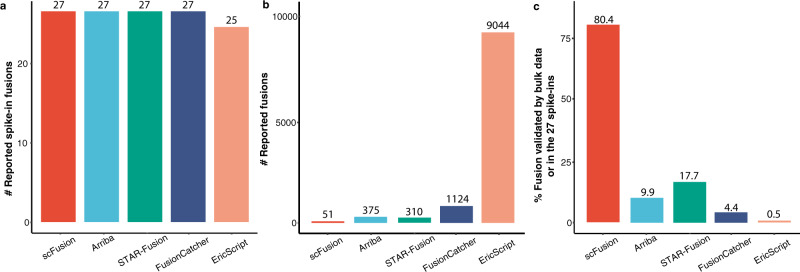
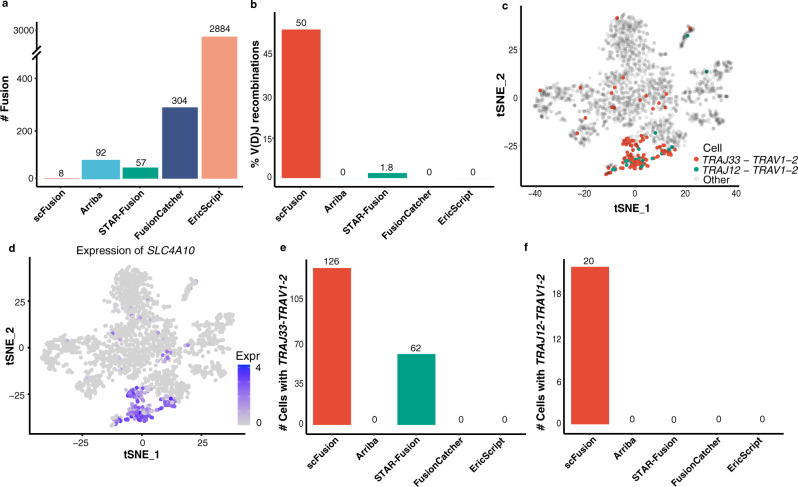
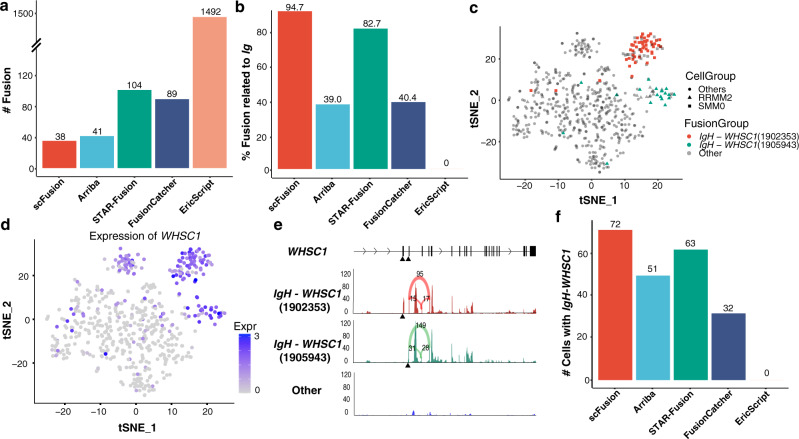
Gene fusions can play important roles in tumor initiation and progression. While fusion detection so far has been from bulk samples, full-length single-cell RNA sequencing (scRNA-seq) offers the possibility of detecting gene fusions at the single-cell level. However, scRNA-seq data have a high noise level and contain various technical artifacts that can lead to spurious fusion discoveries. Here, we present a computational tool, scFusion, for gene fusion detection based on scRNA-seq. We evaluate the performance of scFusion using simulated and five real scRNA-seq datasets and find that scFusion can efficiently and sensitively detect fusions with a low false discovery rate. In a T cell dataset, scFusion detects the invariant TCR gene recombinations in mucosal-associated invariant T cells that many methods developed for bulk data fail to detect; in a multiple myeloma dataset, scFusion detects the known recurrent fusion IgH-WHSC1, which is associated with overexpression of the WHSC1 oncogene. Our results demonstrate that scFusion can be used to investigate cellular heterogeneity of gene fusions and their transcriptional impact at the single-cell level.


Conflict of interest statement

The authors declare the following competing interests: Ruibin Xi holds the stock of GeneX Health Co.Ltd. A patent application about single-cell gene fusion detection is submitted. Applicant: Peking University. Inventors: Ruibin Xi, Zijie Jin. Application number: 202011451710.8. Status of the application: pending. The algorithm developed in this manuscript is covered in the patent application. For all other authors, no competing interests exist.

Figures

Fig. 1
Fig. 1. Overview of scFusion for single-cell gene fusion detection.
The single-cell RNA-seq reads are mapped and supporting reads are identified and clustered to obtain the fusion candidates list. Given the candidate information, a ZINB-based statistical model and a deep-learning model are trained to filter the potential false positives.
Fig. 2
Fig. 2. Features of technical chimeric reads.
The number of supporting chimeric reads depends on (a) the expression of partner genes and (b) the local GC content. The Pearson’s Correlations between the number of chimeric reads and the gene expression and the p-values are shown in the figure. P-values were calculated by two-sided Student’s t test. The GC content was calculated using sequences near breakpoints (200 bp). c The ROCs of the bi-LSTM model for different single-cell datasets (validation data). The AUCs are also shown. d The PR curves and their AUPRs. e The densities of the technical artifact score of gene fusions in the PCAWG study by the bi-LSTM models retrained using six different datasets. f The densities of the predicted probabilities of chimeric reads. The models are retrained using different datasets. Source data are provided as a Source Data file.
Fig. 3
Fig. 3. The precisions and recalls of scFusion, scFusion without the deep-learning model, and four bulk methods in six different simulation setups.
The figures in the two rows correspond to simulations with 1000 cells and 500 cells, and the figures in the three columns correspond to simulations with 2 million, 3 million, and 4 million reads in each data. The dots in the figures are the means of precisions and recalls of ten simulations in each setup. The dashed lines are the contour lines with constant F-scores (F-scores are marked in the top-left figure).
Fig. 4
Fig. 4. The computational time and effects of scFusion’s filters.
a The computational time of the five methods for fusion detection in five scRNA-seq data. The y-axis is the total CPU hours of each method. b Number of fusion candidates after each filter. The top is the total number of fusion candidates, and the second layer is the number of fusion candidates after excluding candidates involving pseudogenes, lncRNAs, genes without an approved symbol, and in intronic regions (they are called pseudogene-, lncRNA-, no-approved-symbol-, and intron- filters). The third layer is the number of candidates supported by at least 2 cells. The fourth layer shows the numbers of fusion candidates remained after the filtering by the statistical model and the deep-learning model, respectively. The fifth layer is the number of candidates that pass both models. The last number indicates the number of output fusions after removing candidates with a partner gene involving in more than five fusion candidates and candidates whose number of supporting discordant reads is ten times more than their supporting split-mapped reads (too-many-partner- and too-many-discordant- filters).
Fig. 5
Fig. 5. The performance of five methods on spike-in data.
a The numbers of reported spike-in fusions. b The numbers of reported fusions. c The proportions of fusions having bulk supporting chimeric reads or in the 27 spike-ins.
Fig. 6
Fig. 6. The T cell scRNA-seq data.
a The number of detected gene fusions by the five methods. b The percentages of V(D)J recombinations in fusions detected by the five methods. c The expressions of SLC4A10 shown in the tSNE plot of all T cells. d The cells with TRAJ33-TRAV1-2 and TRAJ12-TRAV1-2 colored in the tSNE plot. e, f The barplots of numbers of cells with the TRAJ33-TRAV1-2 (e) and TRAJ12-TRAV1-2 (f) recombinations by different algorithms. Source data are provided as a Source Data file.
Fig. 7
Fig. 7. The MM scRNA-seq data.
a The number of detected gene fusions by the five methods. The percentage of IgH-related fusions in fusions detected by the five methods. c The tSNE plot of all MM single cells. The cells with two IgH-WHSC1 fusions are colored in the plot. The cells from patient RMM2 and SMM0 are marked by triangle and rectangle, respectively. d The expression of WHSC1 shown in the tSNE plot. e The mean read depth of WHSC1 at different locations for the cells with the two IgH-WHSC1 fusions and the cells without the fusions. The black triangles indicate the breakpoints of the two fusions. The supporting number of splicing junctions are also shown in the plot (the numbers above the arcs). The read depth of a single cell at a location is calculated as the number of reads covering the location per million. The mean read depth is the average depth of all cells in a group. f The barplots of numbers of cells with the IgH-WHSC1 fusions by different algorithms. Source data are provided as a Source Data file.

Similar articles

Cited by

References

    1. Rowley JD. Identificaton of a translocation with quinacrine fluorescence in a patient with acute leukemia. Annal. Genetique. 1973;16:109–112. - PubMed
    1. Nowell PC, Hungerford DA. Chromosome studies on normal and leukemic human leukocytes. J. Natl Cancer Inst. 1960;25:85–109. - PubMed
    1. Demichelis F, et al. TMPRSS2:ERG gene fusion associated with lethal prostate cancer in a watchful waiting cohort. Oncogene. 2007;26:4596–4599. - PubMed
    1. Choi YL, et al. EML4-ALK mutations in lung cancer that confer resistance to ALK inhibitors. N. Engl. J. Med. 2010;363:1734–1739. - PubMed
    1. O’Hare T, et al. In vitro activity of Bcr-Abl inhibitors AMN107 and BMS-354825 against clinically relevant imatinib-resistant Abl kinase domain mutants. Cancer Res. 2005;65:4500–4505. - PubMed

Publication types